
|
|||||
|
 | |
| |
| |
| |
| |
| |
|
Gene: TTC38 |
Gene summary for TTC38 |
| Gene information | Species | Human | Gene symbol | TTC38 | Gene ID | 55020 |
| Gene name | tetratricopeptide repeat domain 38 | |
| Gene Alias | LL22NC03-5H6.5 | |
| Cytomap | 22q13.31 | |
| Gene Type | protein-coding | GO ID | GO:0005575 | UniProtAcc | Q5R3I4 |
Top |
Malignant transformation analysis |
| Identification of the aberrant gene expression in precancerous and cancerous lesions by comparing the gene expression of stem-like cells in diseased tissues with normal stem cells |
| Entrez ID | Symbol | Replicates | Species | Organ | Tissue | Adj P-value | Log2FC | Malignancy |
| 55020 | TTC38 | HTA11_2487_2000001011 | Human | Colorectum | SER | 2.72e-08 | 5.24e-01 | -0.1808 |
| 55020 | TTC38 | HTA11_347_2000001011 | Human | Colorectum | AD | 9.92e-08 | 4.12e-01 | -0.1954 |
| 55020 | TTC38 | HTA11_83_2000001011 | Human | Colorectum | SER | 4.76e-06 | 6.23e-01 | -0.1526 |
| 55020 | TTC38 | HTA11_696_2000001011 | Human | Colorectum | AD | 2.23e-06 | 4.02e-01 | -0.1464 |
| 55020 | TTC38 | HTA11_1391_2000001011 | Human | Colorectum | AD | 1.85e-04 | 5.72e-01 | -0.059 |
| 55020 | TTC38 | HTA11_99999971662_82457 | Human | Colorectum | MSS | 6.79e-04 | 3.95e-01 | 0.3859 |
| 55020 | TTC38 | A015-C-203 | Human | Colorectum | FAP | 7.07e-10 | -2.16e-01 | -0.1294 |
| 55020 | TTC38 | A002-C-201 | Human | Colorectum | FAP | 2.67e-04 | -1.26e-01 | 0.0324 |
| 55020 | TTC38 | A001-C-108 | Human | Colorectum | FAP | 3.11e-08 | -1.66e-01 | -0.0272 |
| 55020 | TTC38 | A002-C-205 | Human | Colorectum | FAP | 2.46e-09 | -2.60e-01 | -0.1236 |
| 55020 | TTC38 | A015-C-006 | Human | Colorectum | FAP | 1.31e-04 | -2.04e-01 | -0.0994 |
| 55020 | TTC38 | A015-C-106 | Human | Colorectum | FAP | 4.40e-02 | -1.24e-01 | -0.0511 |
| 55020 | TTC38 | A002-C-114 | Human | Colorectum | FAP | 3.17e-06 | -1.70e-01 | -0.1561 |
| 55020 | TTC38 | A015-C-104 | Human | Colorectum | FAP | 1.06e-09 | -2.16e-01 | -0.1899 |
| 55020 | TTC38 | A001-C-014 | Human | Colorectum | FAP | 1.00e-06 | -2.64e-01 | 0.0135 |
| 55020 | TTC38 | A002-C-016 | Human | Colorectum | FAP | 4.11e-08 | -2.27e-01 | 0.0521 |
| 55020 | TTC38 | A015-C-002 | Human | Colorectum | FAP | 2.46e-05 | -2.67e-01 | -0.0763 |
| 55020 | TTC38 | A002-C-116 | Human | Colorectum | FAP | 1.16e-11 | -2.70e-01 | -0.0452 |
| 55020 | TTC38 | A014-C-008 | Human | Colorectum | FAP | 1.20e-04 | -1.59e-01 | -0.191 |
| 55020 | TTC38 | A018-E-020 | Human | Colorectum | FAP | 1.34e-06 | -8.84e-02 | -0.2034 |
| Page: 1 2 |
| Tissue | Expression Dynamics | Abbreviation |
| Colorectum (GSE201348) |  | FAP: Familial adenomatous polyposis |
| CRC: Colorectal cancer | ||
| Colorectum (HTA11) |  | AD: Adenomas |
| SER: Sessile serrated lesions | ||
| MSI-H: Microsatellite-high colorectal cancer | ||
| MSS: Microsatellite stable colorectal cancer | ||
| Liver | 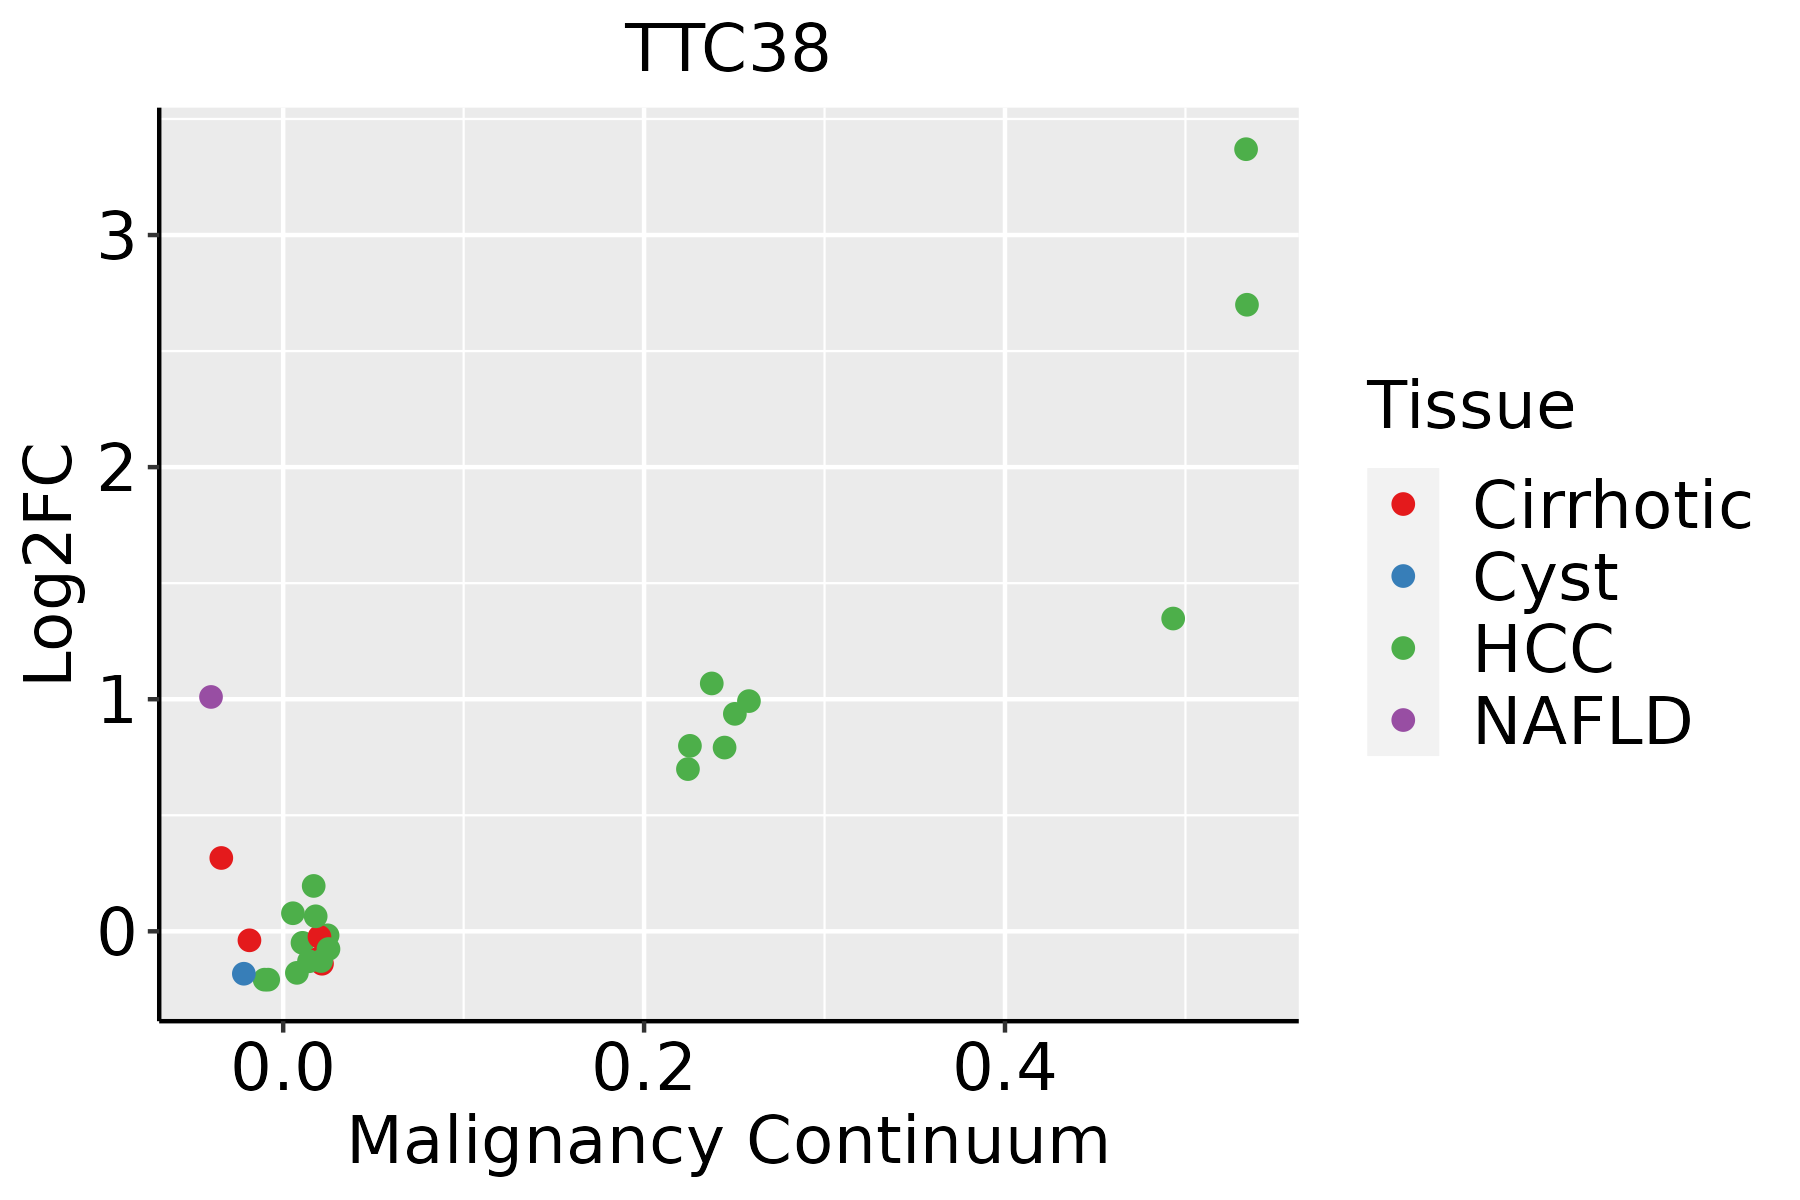 | HCC: Hepatocellular carcinoma |
| NAFLD: Non-alcoholic fatty liver disease |
| ∗log2FC in expression of this searched gene in stem-like cells from each diseased tissue sample relative to stem-like cells in normal samples in each tissue plotted against the malignancy continuum. Samples are colored based on if they are from different disease stage. |
Top |
Malignant transformation related pathway analysis |
| Find out the enriched GO biological processes and KEGG pathways involved in transition from healthy to precancer to cancer |
| Tissue | Disease Stage | Enriched GO biological Processes |
| Colorectum | AD |  |
| Colorectum | SER |  |
| Colorectum | MSS |  |
| Colorectum | MSI-H |  |
| Colorectum | FAP |  |
| ∗Top 15 enriched GO BP terms are showed in the bar plot of each disease state in each tissue. Each row represents a significant GO biological process which is colored according to the -log10(p.adjust). |
| Page: 1 2 3 4 5 6 7 8 9 |
| GO ID | Tissue | Disease Stage | Description | Gene Ratio | Bg Ratio | pvalue | p.adjust | Count |
| Page: 1 |
| Pathway ID | Tissue | Disease Stage | Description | Gene Ratio | Bg Ratio | pvalue | p.adjust | qvalue | Count |
| Page: 1 |
Top |
Cell-cell communication analysis |
| Identification of potential cell-cell interactions between two cell types and their ligand-receptor pairs for different disease states |
| Ligand | Receptor | LRpair | Pathway | Tissue | Disease Stage |
| Page: 1 |
Top |
Single-cell gene regulatory network inference analysis |
| Find out the significant the regulons (TFs) and the target genes of each regulon across cell types for different disease states |
| TF | Cell Type | Tissue | Disease Stage | Target Gene | RSS | Regulon Activity |
| ∗The dot plots of a searched regulon are shown for all cell subpopulations in each disease state of each tissue based on the regulon specific score inferred using pySCENIC and by calculating the average expression. |
| Page: 1 |
Top |
Somatic mutation of malignant transformation related genes |
| Annotation of somatic variants for genes involved in malignant transformation |
| Hugo Symbol | Variant Class | Variant Classification | dbSNP RS | HGVSc | HGVSp | HGVSp Short | SWISSPROT | BIOTYPE | SIFT | PolyPhen | Tumor Sample Barcode | Tissue | Histology | Sex | Age | Stage | Therapy Types | Drugs | Outcome |
| TTC38 | SNV | Missense_Mutation | novel | c.946G>A | p.Val316Ile | p.V316I | Q5R3I4 | protein_coding | tolerated(0.19) | benign(0.007) | TCGA-A7-A4SD-01 | Breast | breast invasive carcinoma | Female | <65 | I/II | Chemotherapy | taxotere | CR |
| TTC38 | SNV | Missense_Mutation | c.448G>T | p.Asp150Tyr | p.D150Y | Q5R3I4 | protein_coding | deleterious(0) | probably_damaging(0.998) | TCGA-AN-A0FX-01 | Breast | breast invasive carcinoma | Female | <65 | I/II | Unknown | Unknown | SD | |
| TTC38 | SNV | Missense_Mutation | rs766399816 | c.632N>T | p.Pro211Leu | p.P211L | Q5R3I4 | protein_coding | deleterious(0.04) | possibly_damaging(0.768) | TCGA-E9-A2JS-01 | Breast | breast invasive carcinoma | Female | >=65 | I/II | Chemotherapy | cyclophosphamide | PD |
| TTC38 | SNV | Missense_Mutation | c.1249N>A | p.Val417Ile | p.V417I | Q5R3I4 | protein_coding | tolerated(0.28) | benign(0.037) | TCGA-EW-A1J6-01 | Breast | breast invasive carcinoma | Female | >=65 | I/II | Hormone Therapy | femara | SD | |
| TTC38 | SNV | Missense_Mutation | novel | c.1254N>G | p.Phe418Leu | p.F418L | Q5R3I4 | protein_coding | deleterious(0.01) | possibly_damaging(0.904) | TCGA-MY-A913-01 | Cervix | cervical & endocervical cancer | Female | <65 | I/II | Chemotherapy | cisplatin | CR |
| TTC38 | SNV | Missense_Mutation | c.1000N>A | p.Ala334Thr | p.A334T | Q5R3I4 | protein_coding | tolerated(0.05) | benign(0.296) | TCGA-AA-3663-01 | Colorectum | colon adenocarcinoma | Male | <65 | I/II | Unknown | Unknown | SD | |
| TTC38 | SNV | Missense_Mutation | rs753722029 | c.589N>A | p.Asp197Asn | p.D197N | Q5R3I4 | protein_coding | deleterious(0.01) | benign(0.345) | TCGA-AA-A010-01 | Colorectum | colon adenocarcinoma | Female | <65 | I/II | Chemotherapy | folinic | CR |
| TTC38 | SNV | Missense_Mutation | c.500G>A | p.Arg167Gln | p.R167Q | Q5R3I4 | protein_coding | deleterious(0.01) | possibly_damaging(0.619) | TCGA-AG-A002-01 | Colorectum | rectum adenocarcinoma | Male | <65 | I/II | Unknown | Unknown | SD | |
| TTC38 | SNV | Missense_Mutation | c.500N>A | p.Arg167Gln | p.R167Q | Q5R3I4 | protein_coding | deleterious(0.01) | possibly_damaging(0.619) | TCGA-A5-A2K5-01 | Endometrium | uterine corpus endometrioid carcinoma | Female | >=65 | I/II | Unknown | Unknown | SD | |
| TTC38 | SNV | Missense_Mutation | rs372817703 | c.1180G>A | p.Val394Ile | p.V394I | Q5R3I4 | protein_coding | deleterious(0.04) | benign(0.299) | TCGA-AJ-A3BH-01 | Endometrium | uterine corpus endometrioid carcinoma | Female | Unknown | I/II | Unknown | Unknown | SD |
| Page: 1 2 3 4 5 |
Top |
Related drugs of malignant transformation related genes |
| Identification of chemicals and drugs interact with genes involved in malignant transfromation |
| (DGIdb 4.0) |
| Entrez ID | Symbol | Category | Interaction Types | Drug Claim Name | Drug Name | PMIDs |
| Page: 1 |

Copyright 2023-Present -The University of Texas Health Science Center at Houston |