
|
|||||
|
 | |
| |
| |
| |
| |
| |
|
Gene: TTC37 |
Gene summary for TTC37 |
| Gene information | Species | Human | Gene symbol | TTC37 | Gene ID | 9652 |
| Gene name | tetratricopeptide repeat domain 37 | |
| Gene Alias | KIAA0372 | |
| Cytomap | 5q15 | |
| Gene Type | protein-coding | GO ID | GO:0000291 | UniProtAcc | Q6PGP7 |
Top |
Malignant transformation analysis |
| Identification of the aberrant gene expression in precancerous and cancerous lesions by comparing the gene expression of stem-like cells in diseased tissues with normal stem cells |
| Entrez ID | Symbol | Replicates | Species | Organ | Tissue | Adj P-value | Log2FC | Malignancy |
| 9652 | TTC37 | LZE7T | Human | Esophagus | ESCC | 2.47e-05 | 1.10e-01 | 0.0667 |
| 9652 | TTC37 | LZE8T | Human | Esophagus | ESCC | 1.61e-02 | 3.43e-02 | 0.067 |
| 9652 | TTC37 | LZE20T | Human | Esophagus | ESCC | 1.18e-04 | 3.17e-02 | 0.0662 |
| 9652 | TTC37 | LZE24T | Human | Esophagus | ESCC | 2.34e-08 | 1.18e-01 | 0.0596 |
| 9652 | TTC37 | P1T-E | Human | Esophagus | ESCC | 4.20e-02 | 2.60e-01 | 0.0875 |
| 9652 | TTC37 | P2T-E | Human | Esophagus | ESCC | 1.01e-16 | 3.62e-01 | 0.1177 |
| 9652 | TTC37 | P4T-E | Human | Esophagus | ESCC | 9.11e-08 | 2.36e-01 | 0.1323 |
| 9652 | TTC37 | P5T-E | Human | Esophagus | ESCC | 2.03e-02 | 4.72e-02 | 0.1327 |
| 9652 | TTC37 | P8T-E | Human | Esophagus | ESCC | 2.40e-18 | 2.27e-01 | 0.0889 |
| 9652 | TTC37 | P9T-E | Human | Esophagus | ESCC | 1.08e-08 | 9.34e-02 | 0.1131 |
| 9652 | TTC37 | P10T-E | Human | Esophagus | ESCC | 9.82e-27 | 3.26e-01 | 0.116 |
| 9652 | TTC37 | P11T-E | Human | Esophagus | ESCC | 1.14e-03 | 2.68e-01 | 0.1426 |
| 9652 | TTC37 | P12T-E | Human | Esophagus | ESCC | 8.77e-17 | 2.69e-01 | 0.1122 |
| 9652 | TTC37 | P15T-E | Human | Esophagus | ESCC | 1.18e-03 | 7.59e-02 | 0.1149 |
| 9652 | TTC37 | P16T-E | Human | Esophagus | ESCC | 2.15e-13 | 2.55e-02 | 0.1153 |
| 9652 | TTC37 | P20T-E | Human | Esophagus | ESCC | 5.81e-20 | 3.47e-01 | 0.1124 |
| 9652 | TTC37 | P21T-E | Human | Esophagus | ESCC | 1.43e-20 | 2.52e-01 | 0.1617 |
| 9652 | TTC37 | P22T-E | Human | Esophagus | ESCC | 1.29e-21 | 2.03e-01 | 0.1236 |
| 9652 | TTC37 | P23T-E | Human | Esophagus | ESCC | 4.31e-18 | 3.58e-01 | 0.108 |
| 9652 | TTC37 | P24T-E | Human | Esophagus | ESCC | 1.38e-15 | 1.45e-01 | 0.1287 |
| Page: 1 2 3 4 5 6 |
| Tissue | Expression Dynamics | Abbreviation |
| Esophagus | 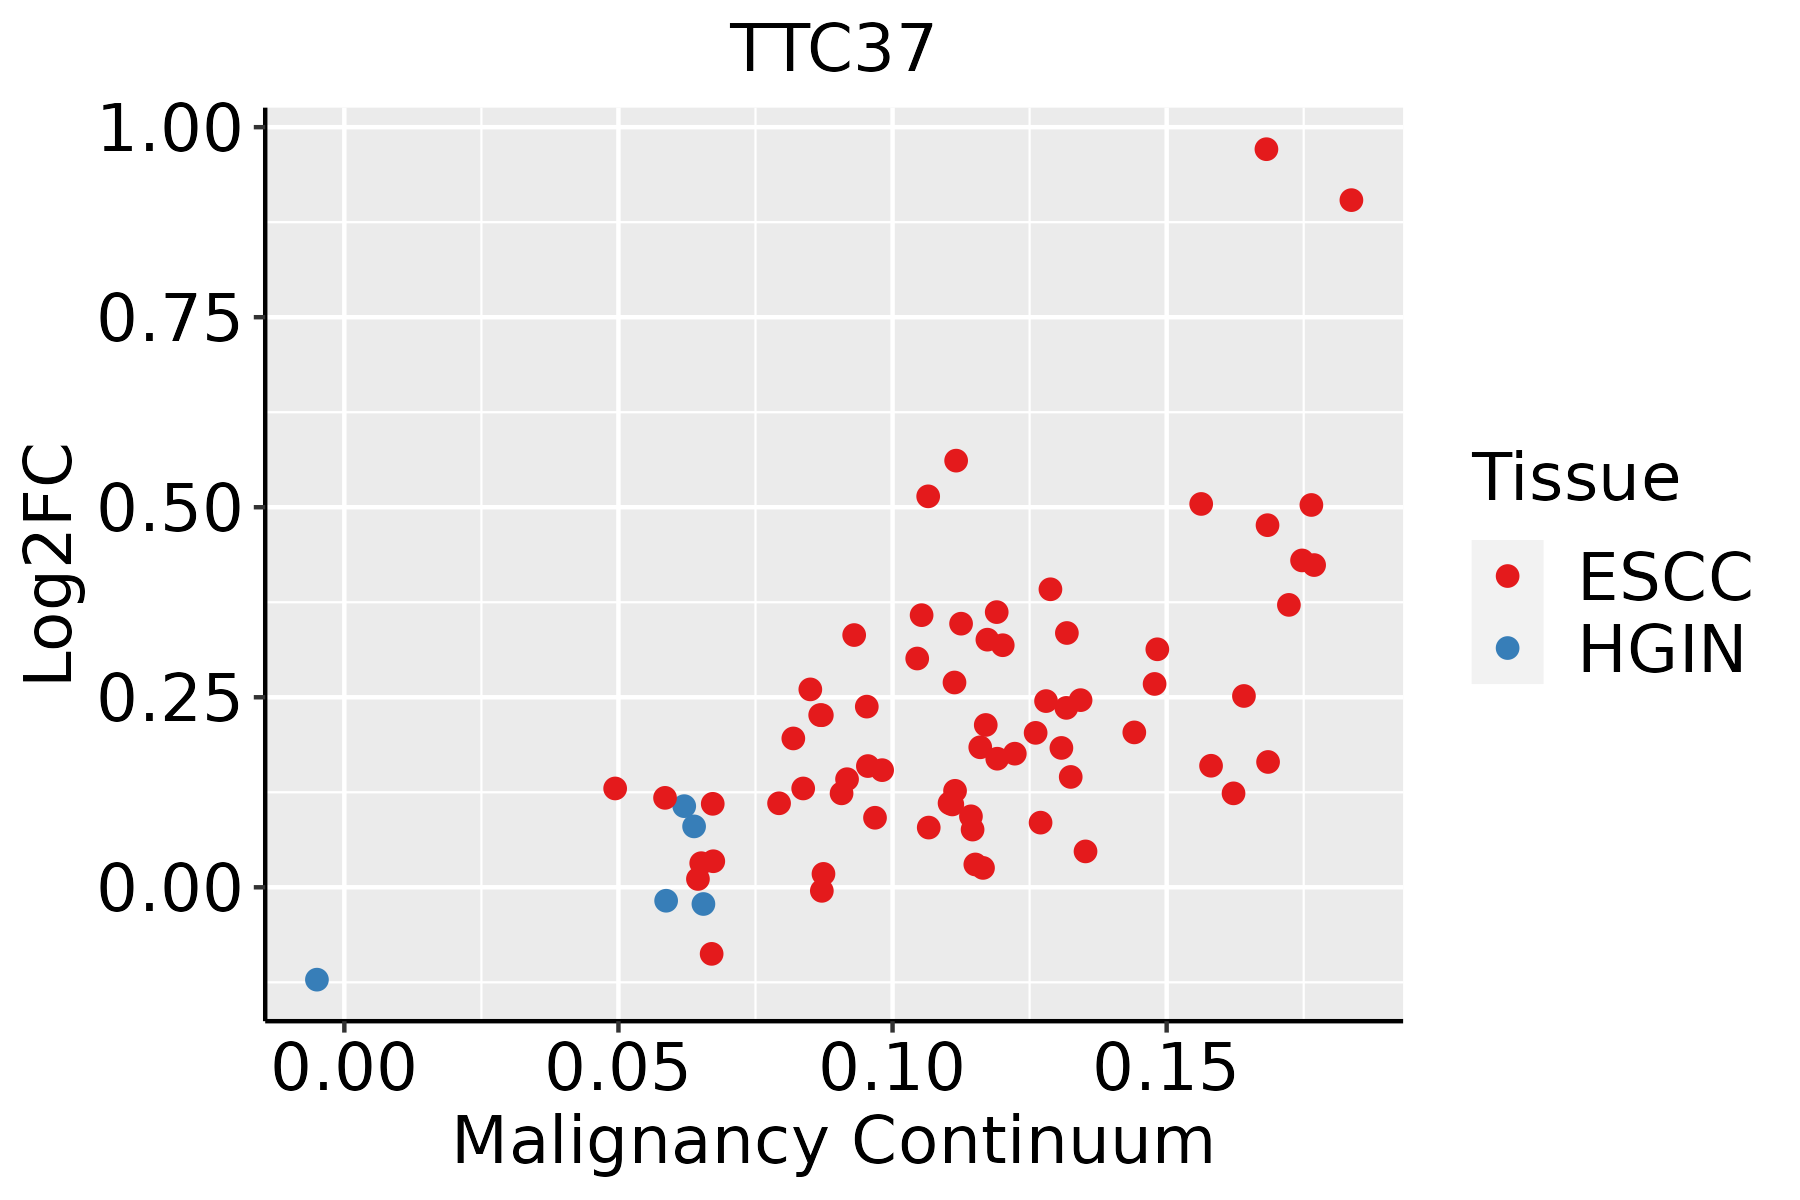 | ESCC: Esophageal squamous cell carcinoma |
| HGIN: High-grade intraepithelial neoplasias | ||
| LGIN: Low-grade intraepithelial neoplasias | ||
| Liver | 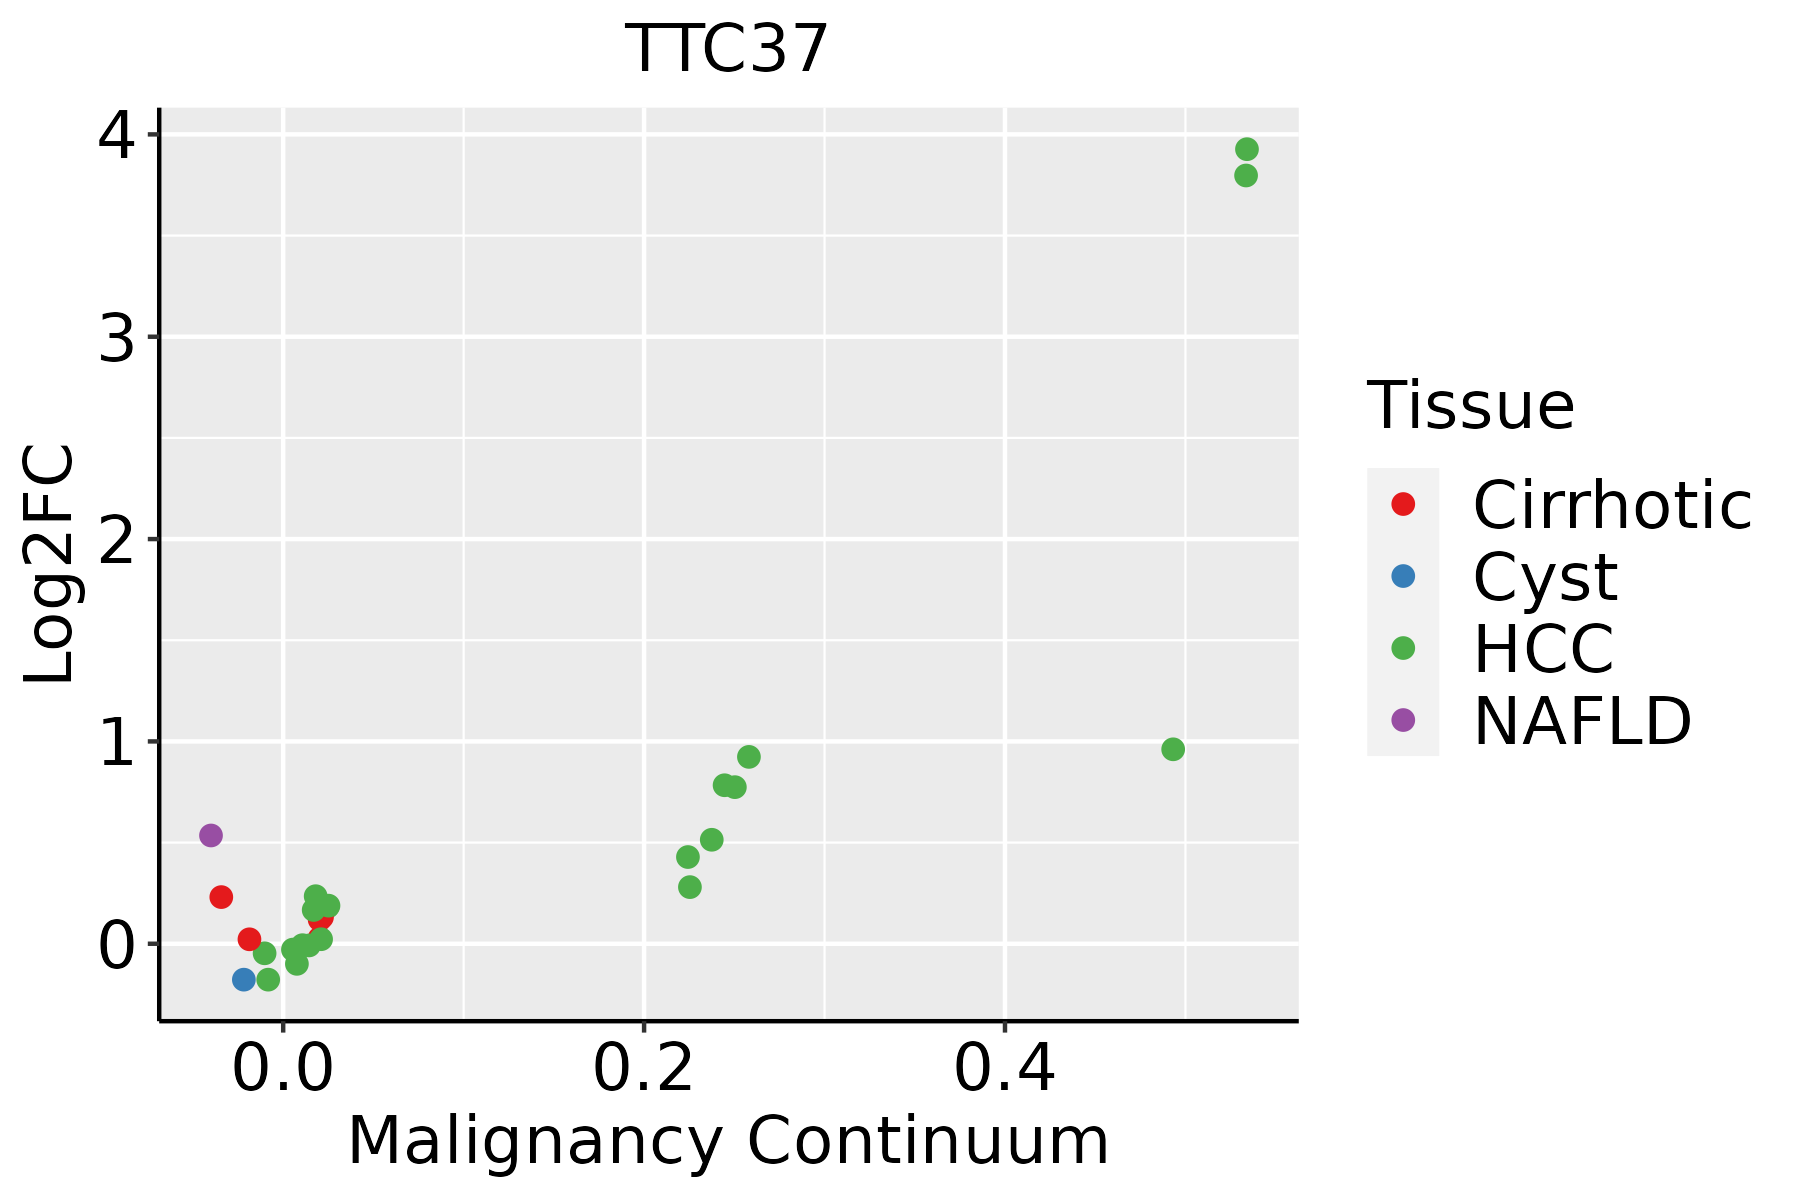 | HCC: Hepatocellular carcinoma |
| NAFLD: Non-alcoholic fatty liver disease | ||
| Oral Cavity | 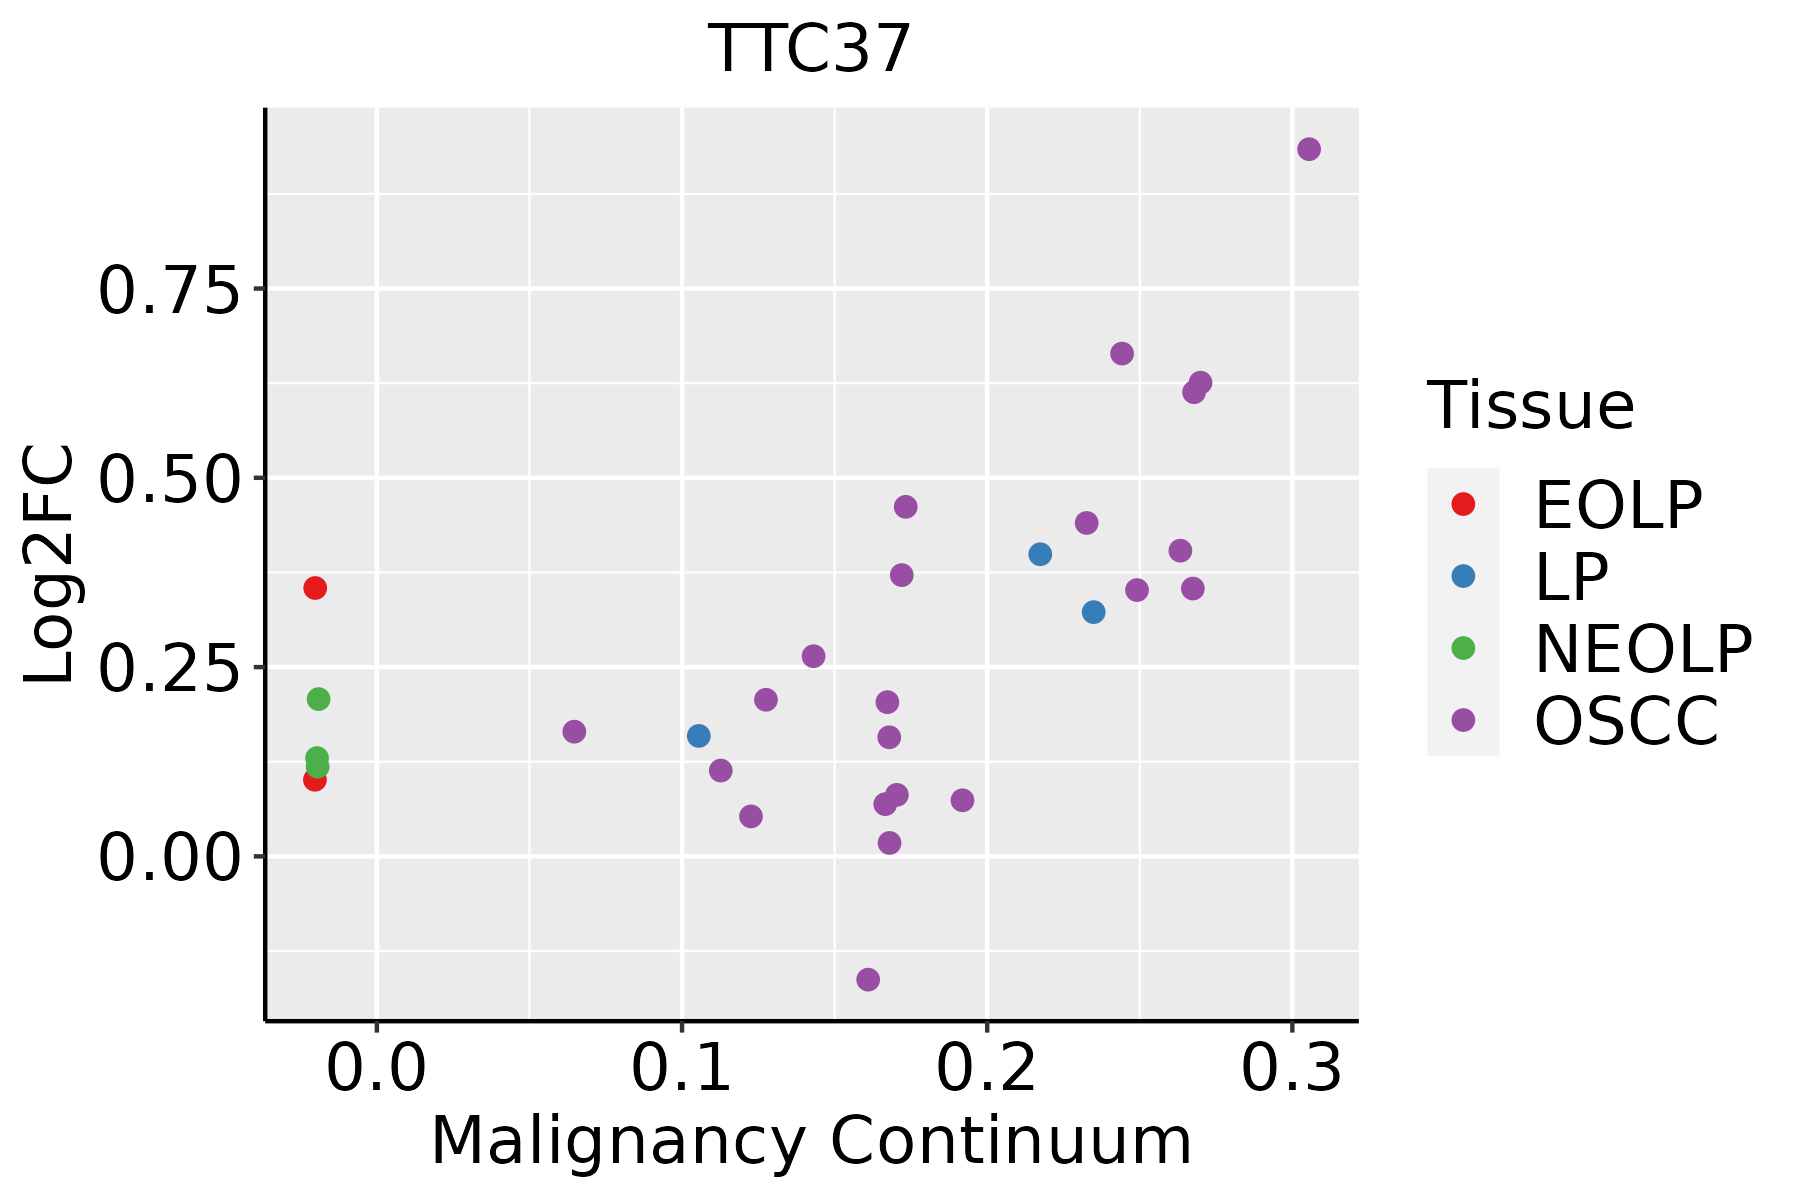 | EOLP: Erosive Oral lichen planus |
| LP: leukoplakia | ||
| NEOLP: Non-erosive oral lichen planus | ||
| OSCC: Oral squamous cell carcinoma | ||
| Prostate | 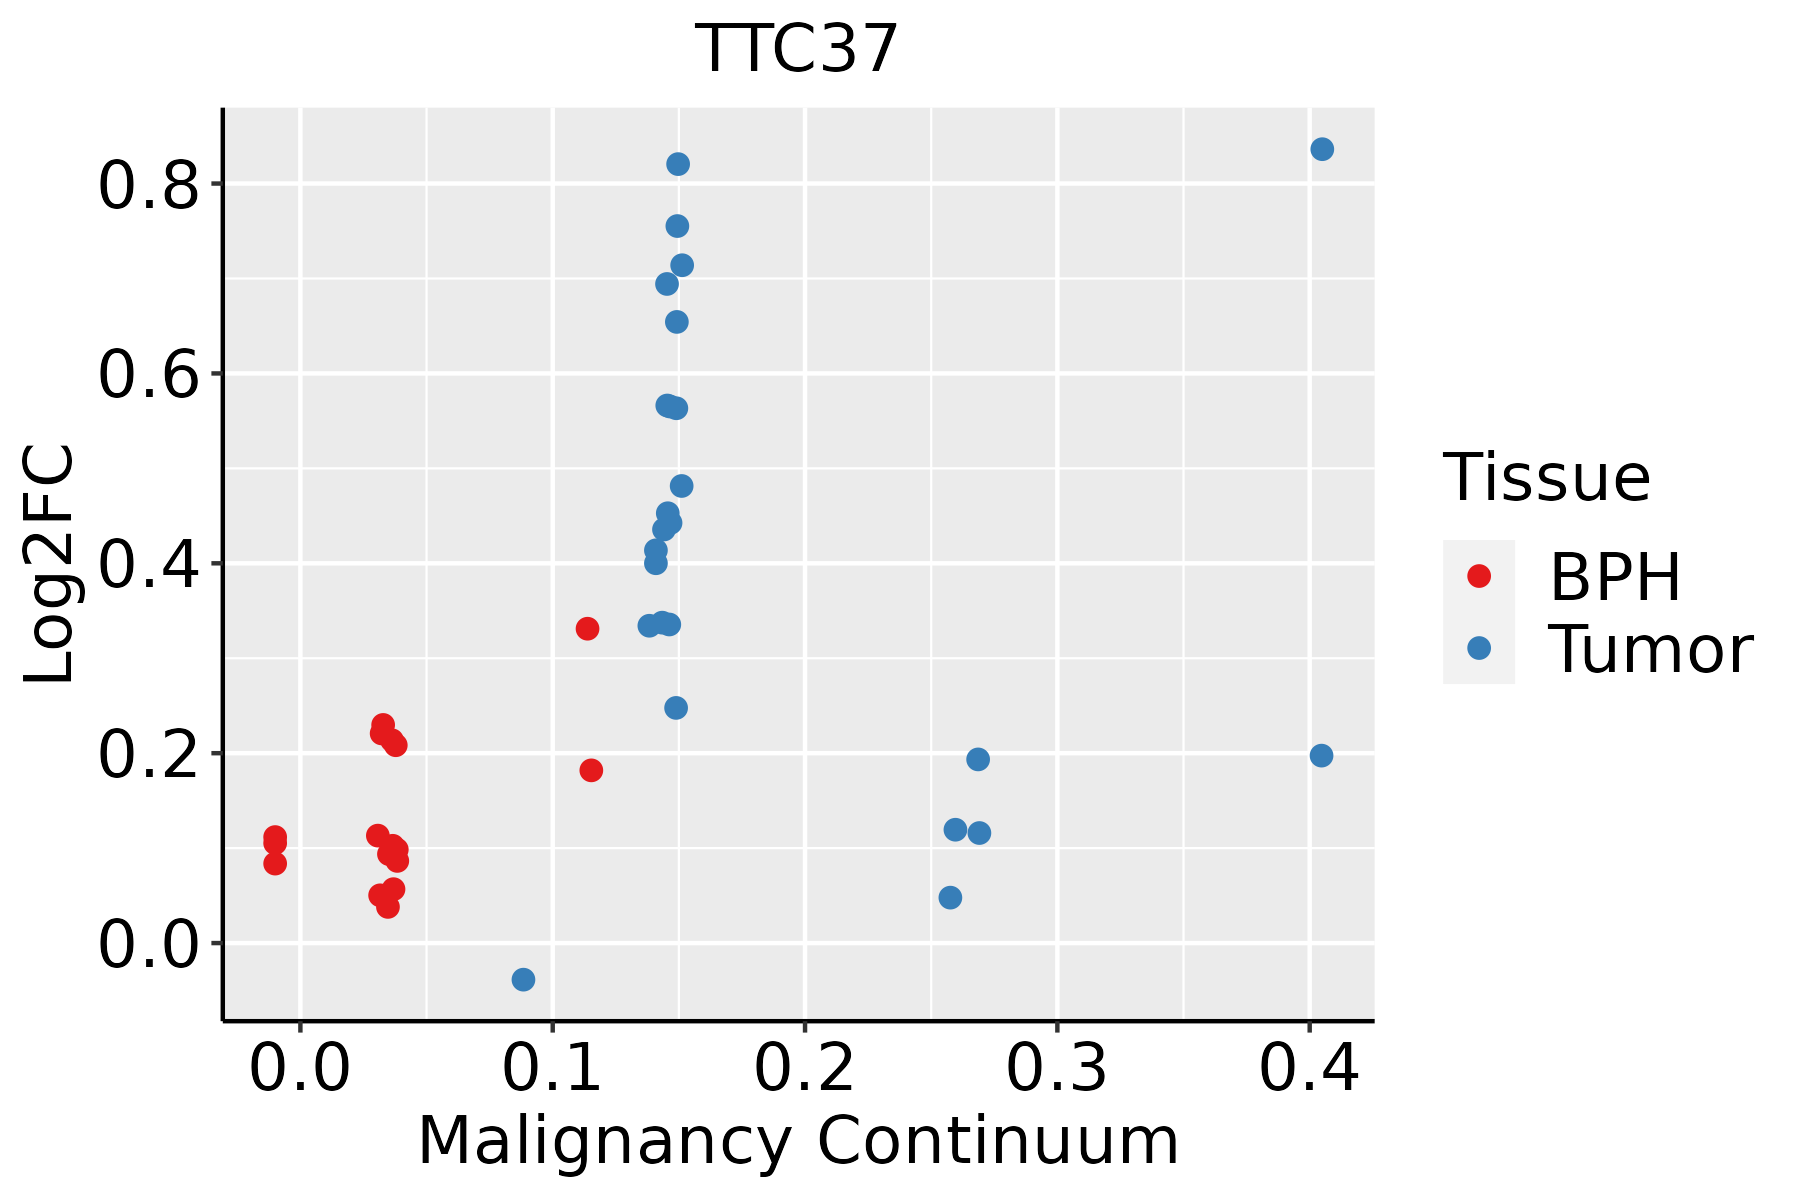 | BPH: Benign Prostatic Hyperplasia |
| Skin |  | AK: Actinic keratosis |
| cSCC: Cutaneous squamous cell carcinoma | ||
| SCCIS:squamous cell carcinoma in situ | ||
| Thyroid | 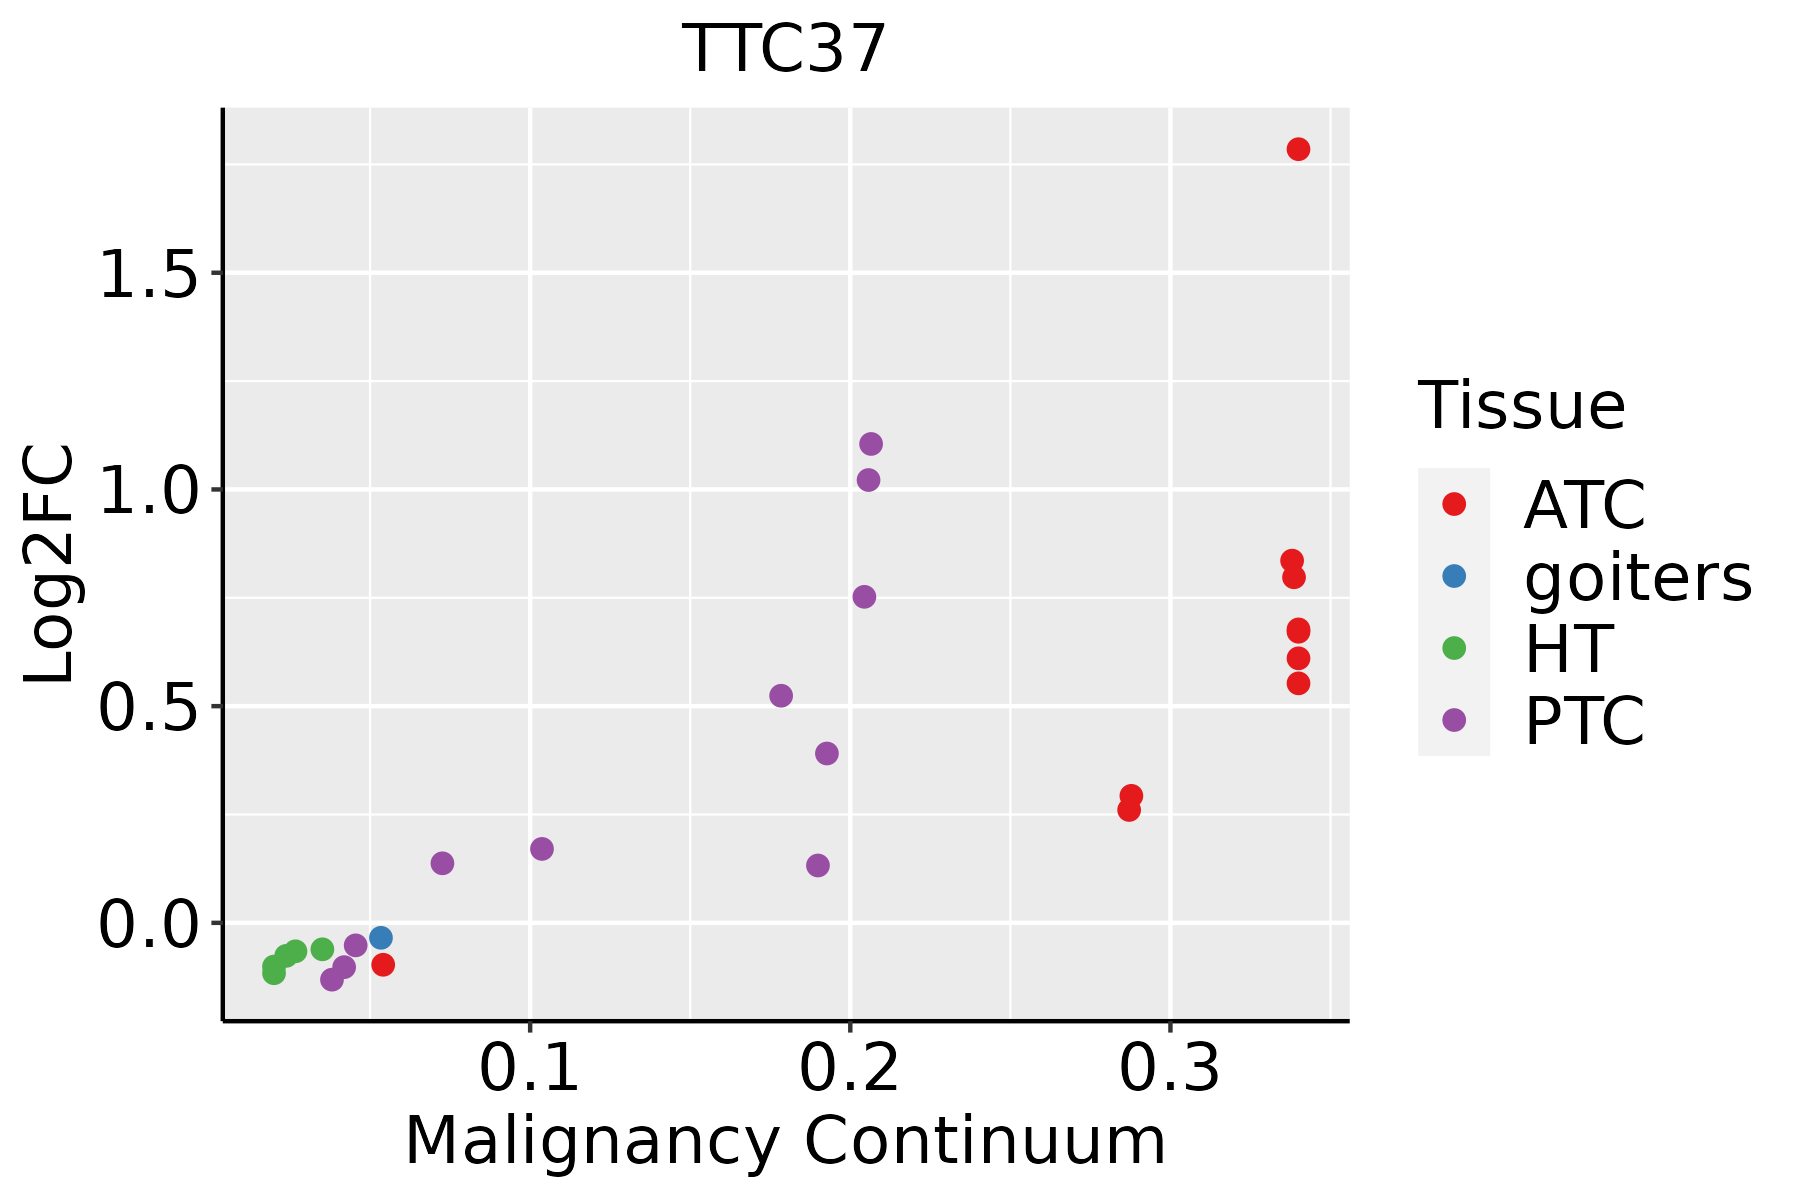 | ATC: Anaplastic thyroid cancer |
| HT: Hashimoto's thyroiditis | ||
| PTC: Papillary thyroid cancer |
| ∗log2FC in expression of this searched gene in stem-like cells from each diseased tissue sample relative to stem-like cells in normal samples in each tissue plotted against the malignancy continuum. Samples are colored based on if they are from different disease stage. |
Top |
Malignant transformation related pathway analysis |
| Find out the enriched GO biological processes and KEGG pathways involved in transition from healthy to precancer to cancer |
| Tissue | Disease Stage | Enriched GO biological Processes |
| Colorectum | AD |  |
| Colorectum | SER |  |
| Colorectum | MSS |  |
| Colorectum | MSI-H |  |
| Colorectum | FAP |  |
| ∗Top 15 enriched GO BP terms are showed in the bar plot of each disease state in each tissue. Each row represents a significant GO biological process which is colored according to the -log10(p.adjust). |
| Page: 1 2 3 4 5 6 7 8 9 |
| GO ID | Tissue | Disease Stage | Description | Gene Ratio | Bg Ratio | pvalue | p.adjust | Count |
| GO:0006401110 | Esophagus | ESCC | RNA catabolic process | 204/8552 | 278/18723 | 3.39e-21 | 5.66e-19 | 204 |
| GO:0034655110 | Esophagus | ESCC | nucleobase-containing compound catabolic process | 272/8552 | 407/18723 | 2.92e-18 | 2.90e-16 | 272 |
| GO:0006402110 | Esophagus | ESCC | mRNA catabolic process | 170/8552 | 232/18723 | 8.70e-18 | 8.00e-16 | 170 |
| GO:004670018 | Esophagus | ESCC | heterocycle catabolic process | 286/8552 | 445/18723 | 1.12e-15 | 7.47e-14 | 286 |
| GO:004427019 | Esophagus | ESCC | cellular nitrogen compound catabolic process | 288/8552 | 451/18723 | 3.03e-15 | 1.79e-13 | 288 |
| GO:001943918 | Esophagus | ESCC | aromatic compound catabolic process | 295/8552 | 467/18723 | 1.09e-14 | 5.98e-13 | 295 |
| GO:190136118 | Esophagus | ESCC | organic cyclic compound catabolic process | 307/8552 | 495/18723 | 9.99e-14 | 4.80e-12 | 307 |
| GO:000095618 | Esophagus | ESCC | nuclear-transcribed mRNA catabolic process | 88/8552 | 112/18723 | 9.41e-13 | 4.14e-11 | 88 |
| GO:00002913 | Esophagus | ESCC | nuclear-transcribed mRNA catabolic process, exonucleolytic | 18/8552 | 19/18723 | 8.00e-06 | 7.78e-05 | 18 |
| GO:00344271 | Esophagus | ESCC | nuclear-transcribed mRNA catabolic process, exonucleolytic, 3'-5' | 10/8552 | 11/18723 | 2.54e-03 | 1.08e-02 | 10 |
| GO:00194396 | Liver | NAFLD | aromatic compound catabolic process | 102/1882 | 467/18723 | 2.29e-14 | 1.91e-11 | 102 |
| GO:19013616 | Liver | NAFLD | organic cyclic compound catabolic process | 105/1882 | 495/18723 | 7.04e-14 | 5.15e-11 | 105 |
| GO:00442707 | Liver | NAFLD | cellular nitrogen compound catabolic process | 93/1882 | 451/18723 | 1.04e-11 | 4.34e-09 | 93 |
| GO:00467006 | Liver | NAFLD | heterocycle catabolic process | 92/1882 | 445/18723 | 1.16e-11 | 4.52e-09 | 92 |
| GO:00064026 | Liver | NAFLD | mRNA catabolic process | 56/1882 | 232/18723 | 3.49e-10 | 9.27e-08 | 56 |
| GO:00346556 | Liver | NAFLD | nucleobase-containing compound catabolic process | 80/1882 | 407/18723 | 3.07e-09 | 4.61e-07 | 80 |
| GO:00064016 | Liver | NAFLD | RNA catabolic process | 61/1882 | 278/18723 | 3.26e-09 | 4.76e-07 | 61 |
| GO:00009564 | Liver | NAFLD | nuclear-transcribed mRNA catabolic process | 26/1882 | 112/18723 | 3.68e-05 | 9.23e-04 | 26 |
| GO:190136111 | Liver | Cirrhotic | organic cyclic compound catabolic process | 213/4634 | 495/18723 | 1.58e-19 | 3.67e-17 | 213 |
| GO:001943911 | Liver | Cirrhotic | aromatic compound catabolic process | 202/4634 | 467/18723 | 6.93e-19 | 1.28e-16 | 202 |
| Page: 1 2 3 4 5 6 |
| Pathway ID | Tissue | Disease Stage | Description | Gene Ratio | Bg Ratio | pvalue | p.adjust | qvalue | Count |
| hsa0301824 | Esophagus | ESCC | RNA degradation | 62/4205 | 79/8465 | 1.18e-07 | 9.39e-07 | 4.81e-07 | 62 |
| hsa0301834 | Esophagus | ESCC | RNA degradation | 62/4205 | 79/8465 | 1.18e-07 | 9.39e-07 | 4.81e-07 | 62 |
| hsa030182 | Liver | HCC | RNA degradation | 58/4020 | 79/8465 | 2.29e-06 | 2.19e-05 | 1.22e-05 | 58 |
| hsa030183 | Liver | HCC | RNA degradation | 58/4020 | 79/8465 | 2.29e-06 | 2.19e-05 | 1.22e-05 | 58 |
| hsa030189 | Oral cavity | OSCC | RNA degradation | 59/3704 | 79/8465 | 2.05e-08 | 1.91e-07 | 9.70e-08 | 59 |
| hsa0301814 | Oral cavity | OSCC | RNA degradation | 59/3704 | 79/8465 | 2.05e-08 | 1.91e-07 | 9.70e-08 | 59 |
| hsa0301841 | Oral cavity | EOLP | RNA degradation | 22/1218 | 79/8465 | 1.33e-03 | 4.80e-03 | 2.83e-03 | 22 |
| hsa0301851 | Oral cavity | EOLP | RNA degradation | 22/1218 | 79/8465 | 1.33e-03 | 4.80e-03 | 2.83e-03 | 22 |
| hsa0301822 | Prostate | Tumor | RNA degradation | 30/1791 | 79/8465 | 4.48e-04 | 2.35e-03 | 1.46e-03 | 30 |
| hsa0301832 | Prostate | Tumor | RNA degradation | 30/1791 | 79/8465 | 4.48e-04 | 2.35e-03 | 1.46e-03 | 30 |
| Page: 1 |
Top |
Cell-cell communication analysis |
| Identification of potential cell-cell interactions between two cell types and their ligand-receptor pairs for different disease states |
| Ligand | Receptor | LRpair | Pathway | Tissue | Disease Stage |
| Page: 1 |
Top |
Single-cell gene regulatory network inference analysis |
| Find out the significant the regulons (TFs) and the target genes of each regulon across cell types for different disease states |
| TF | Cell Type | Tissue | Disease Stage | Target Gene | RSS | Regulon Activity |
| ∗The dot plots of a searched regulon are shown for all cell subpopulations in each disease state of each tissue based on the regulon specific score inferred using pySCENIC and by calculating the average expression. |
| Page: 1 |
Top |
Somatic mutation of malignant transformation related genes |
| Annotation of somatic variants for genes involved in malignant transformation |
| Hugo Symbol | Variant Class | Variant Classification | dbSNP RS | HGVSc | HGVSp | HGVSp Short | SWISSPROT | BIOTYPE | SIFT | PolyPhen | Tumor Sample Barcode | Tissue | Histology | Sex | Age | Stage | Therapy Types | Drugs | Outcome |
| TTC37 | SNV | Missense_Mutation | novel | c.2380N>T | p.Ala794Ser | p.A794S | Q6PGP7 | protein_coding | tolerated(0.65) | benign(0) | TCGA-AN-A046-01 | Breast | breast invasive carcinoma | Female | >=65 | I/II | Unknown | Unknown | SD |
| TTC37 | SNV | Missense_Mutation | rs148576007 | c.1189C>T | p.Arg397Trp | p.R397W | Q6PGP7 | protein_coding | deleterious(0) | possibly_damaging(0.447) | TCGA-AO-A0J3-01 | Breast | breast invasive carcinoma | Female | >=65 | I/II | Chemotherapy | cyclophosphamide | SD |
| TTC37 | SNV | Missense_Mutation | c.4573N>C | p.Tyr1525His | p.Y1525H | Q6PGP7 | protein_coding | tolerated(0.06) | probably_damaging(0.999) | TCGA-D8-A27G-01 | Breast | breast invasive carcinoma | Female | >=65 | I/II | Unknown | Unknown | SD | |
| TTC37 | SNV | Missense_Mutation | c.1121G>C | p.Arg374Pro | p.R374P | Q6PGP7 | protein_coding | tolerated(0.12) | benign(0.045) | TCGA-E2-A159-01 | Breast | breast invasive carcinoma | Female | <65 | I/II | Chemotherapy | cyclophosphamide | SD | |
| TTC37 | SNV | Missense_Mutation | c.1124N>G | p.Thr375Arg | p.T375R | Q6PGP7 | protein_coding | deleterious(0.02) | benign(0.401) | TCGA-E2-A2P5-01 | Breast | breast invasive carcinoma | Female | >=65 | III/IV | Hormone Therapy | arimidex | PD | |
| TTC37 | SNV | Missense_Mutation | rs868011508 | c.1537N>T | p.Ala513Ser | p.A513S | Q6PGP7 | protein_coding | deleterious(0.05) | possibly_damaging(0.788) | TCGA-GI-A2C8-01 | Breast | breast invasive carcinoma | Female | <65 | III/IV | Unspecific | Adriamycin | SD |
| TTC37 | SNV | Missense_Mutation | c.333N>A | p.Asp111Glu | p.D111E | Q6PGP7 | protein_coding | deleterious(0.03) | benign(0.058) | TCGA-GM-A2DL-01 | Breast | breast invasive carcinoma | Female | <65 | I/II | Hormone Therapy | tamoxiphen | CR | |
| TTC37 | deletion | Frame_Shift_Del | novel | c.4039delN | p.Thr1347LeufsTer7 | p.T1347Lfs*7 | Q6PGP7 | protein_coding | TCGA-EW-A2FV-01 | Breast | breast invasive carcinoma | Female | <65 | III/IV | Chemotherapy | docetaxel | SD | ||
| TTC37 | deletion | Frame_Shift_Del | novel | c.2267delN | p.Asn756MetfsTer15 | p.N756Mfs*15 | Q6PGP7 | protein_coding | TCGA-EW-A2FV-01 | Breast | breast invasive carcinoma | Female | <65 | III/IV | Chemotherapy | docetaxel | SD | ||
| TTC37 | SNV | Missense_Mutation | novel | c.1460G>T | p.Arg487Ile | p.R487I | Q6PGP7 | protein_coding | deleterious(0) | possibly_damaging(0.661) | TCGA-2W-A8YY-01 | Cervix | cervical & endocervical cancer | Female | <65 | I/II | Chemotherapy | cisplatin | CR |
| Page: 1 2 3 4 5 6 7 8 9 10 11 12 13 14 15 |
Top |
Related drugs of malignant transformation related genes |
| Identification of chemicals and drugs interact with genes involved in malignant transfromation |
| (DGIdb 4.0) |
| Entrez ID | Symbol | Category | Interaction Types | Drug Claim Name | Drug Name | PMIDs |
| 9652 | TTC37 | NA | duloxetine | DULOXETINE | 29407288 |
| Page: 1 |

Copyright 2023-Present -The University of Texas Health Science Center at Houston |