
|
|||||
|
 | |
| |
| |
| |
| |
| |
|
Gene: TTC22 |
Gene summary for TTC22 |
| Gene information | Species | Human | Gene symbol | TTC22 | Gene ID | 55001 |
| Gene name | tetratricopeptide repeat domain 22 | |
| Gene Alias | TTC22 | |
| Cytomap | 1p32.3 | |
| Gene Type | protein-coding | GO ID | NA | UniProtAcc | Q5TAA0 |
Top |
Malignant transformation analysis |
| Identification of the aberrant gene expression in precancerous and cancerous lesions by comparing the gene expression of stem-like cells in diseased tissues with normal stem cells |
| Entrez ID | Symbol | Replicates | Species | Organ | Tissue | Adj P-value | Log2FC | Malignancy |
| 55001 | TTC22 | HTA11_2487_2000001011 | Human | Colorectum | SER | 9.84e-06 | 5.08e-01 | -0.1808 |
| 55001 | TTC22 | HTA11_347_2000001011 | Human | Colorectum | AD | 1.85e-10 | 4.44e-01 | -0.1954 |
| 55001 | TTC22 | HTA11_411_2000001011 | Human | Colorectum | SER | 1.17e-03 | 9.62e-01 | -0.2602 |
| 55001 | TTC22 | HTA11_866_2000001011 | Human | Colorectum | AD | 2.24e-02 | 1.75e-01 | -0.1001 |
| 55001 | TTC22 | HTA11_5212_2000001011 | Human | Colorectum | AD | 9.38e-03 | 3.90e-01 | -0.2061 |
| 55001 | TTC22 | HTA11_546_2000001011 | Human | Colorectum | AD | 6.85e-04 | 2.68e-01 | -0.0842 |
| 55001 | TTC22 | A002-C-116 | Human | Colorectum | FAP | 3.85e-03 | -8.90e-02 | -0.0452 |
| 55001 | TTC22 | LZE22T | Human | Esophagus | ESCC | 2.76e-03 | 3.19e-01 | 0.068 |
| 55001 | TTC22 | LZE24T | Human | Esophagus | ESCC | 8.82e-07 | 1.95e-01 | 0.0596 |
| 55001 | TTC22 | P1T-E | Human | Esophagus | ESCC | 6.66e-05 | 4.47e-01 | 0.0875 |
| 55001 | TTC22 | P2T-E | Human | Esophagus | ESCC | 1.16e-09 | 1.55e-01 | 0.1177 |
| 55001 | TTC22 | P4T-E | Human | Esophagus | ESCC | 2.89e-03 | 9.87e-02 | 0.1323 |
| 55001 | TTC22 | P5T-E | Human | Esophagus | ESCC | 8.67e-10 | 1.33e-01 | 0.1327 |
| 55001 | TTC22 | P8T-E | Human | Esophagus | ESCC | 4.00e-13 | 1.43e-01 | 0.0889 |
| 55001 | TTC22 | P9T-E | Human | Esophagus | ESCC | 4.17e-02 | 8.42e-02 | 0.1131 |
| 55001 | TTC22 | P10T-E | Human | Esophagus | ESCC | 1.63e-10 | 1.15e-01 | 0.116 |
| 55001 | TTC22 | P12T-E | Human | Esophagus | ESCC | 8.32e-12 | 1.77e-01 | 0.1122 |
| 55001 | TTC22 | P15T-E | Human | Esophagus | ESCC | 1.97e-16 | 3.39e-01 | 0.1149 |
| 55001 | TTC22 | P16T-E | Human | Esophagus | ESCC | 2.83e-06 | 8.95e-02 | 0.1153 |
| 55001 | TTC22 | P20T-E | Human | Esophagus | ESCC | 1.74e-21 | 5.26e-01 | 0.1124 |
| Page: 1 2 3 |
| Tissue | Expression Dynamics | Abbreviation |
| Colorectum (GSE201348) | 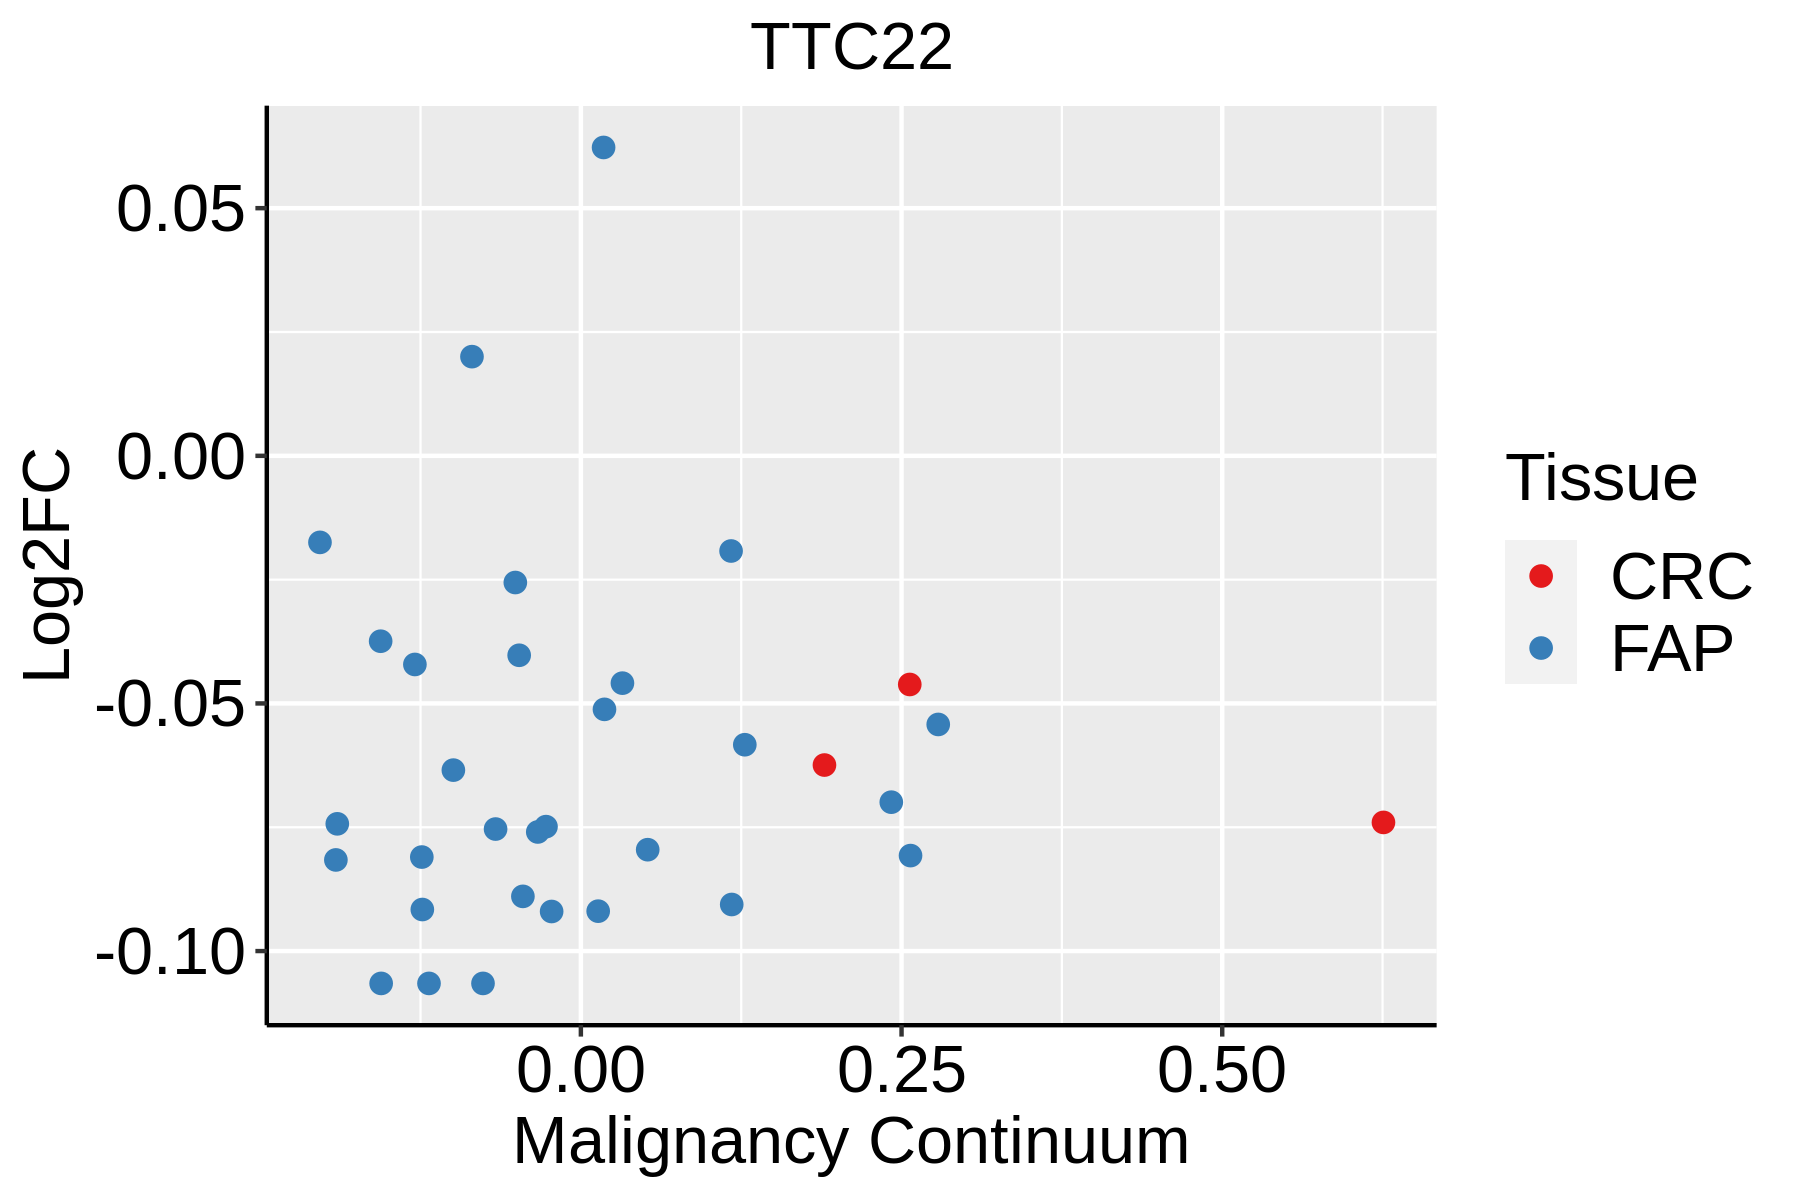 | FAP: Familial adenomatous polyposis |
| CRC: Colorectal cancer | ||
| Colorectum (HTA11) |  | AD: Adenomas |
| SER: Sessile serrated lesions | ||
| MSI-H: Microsatellite-high colorectal cancer | ||
| MSS: Microsatellite stable colorectal cancer | ||
| Esophagus | 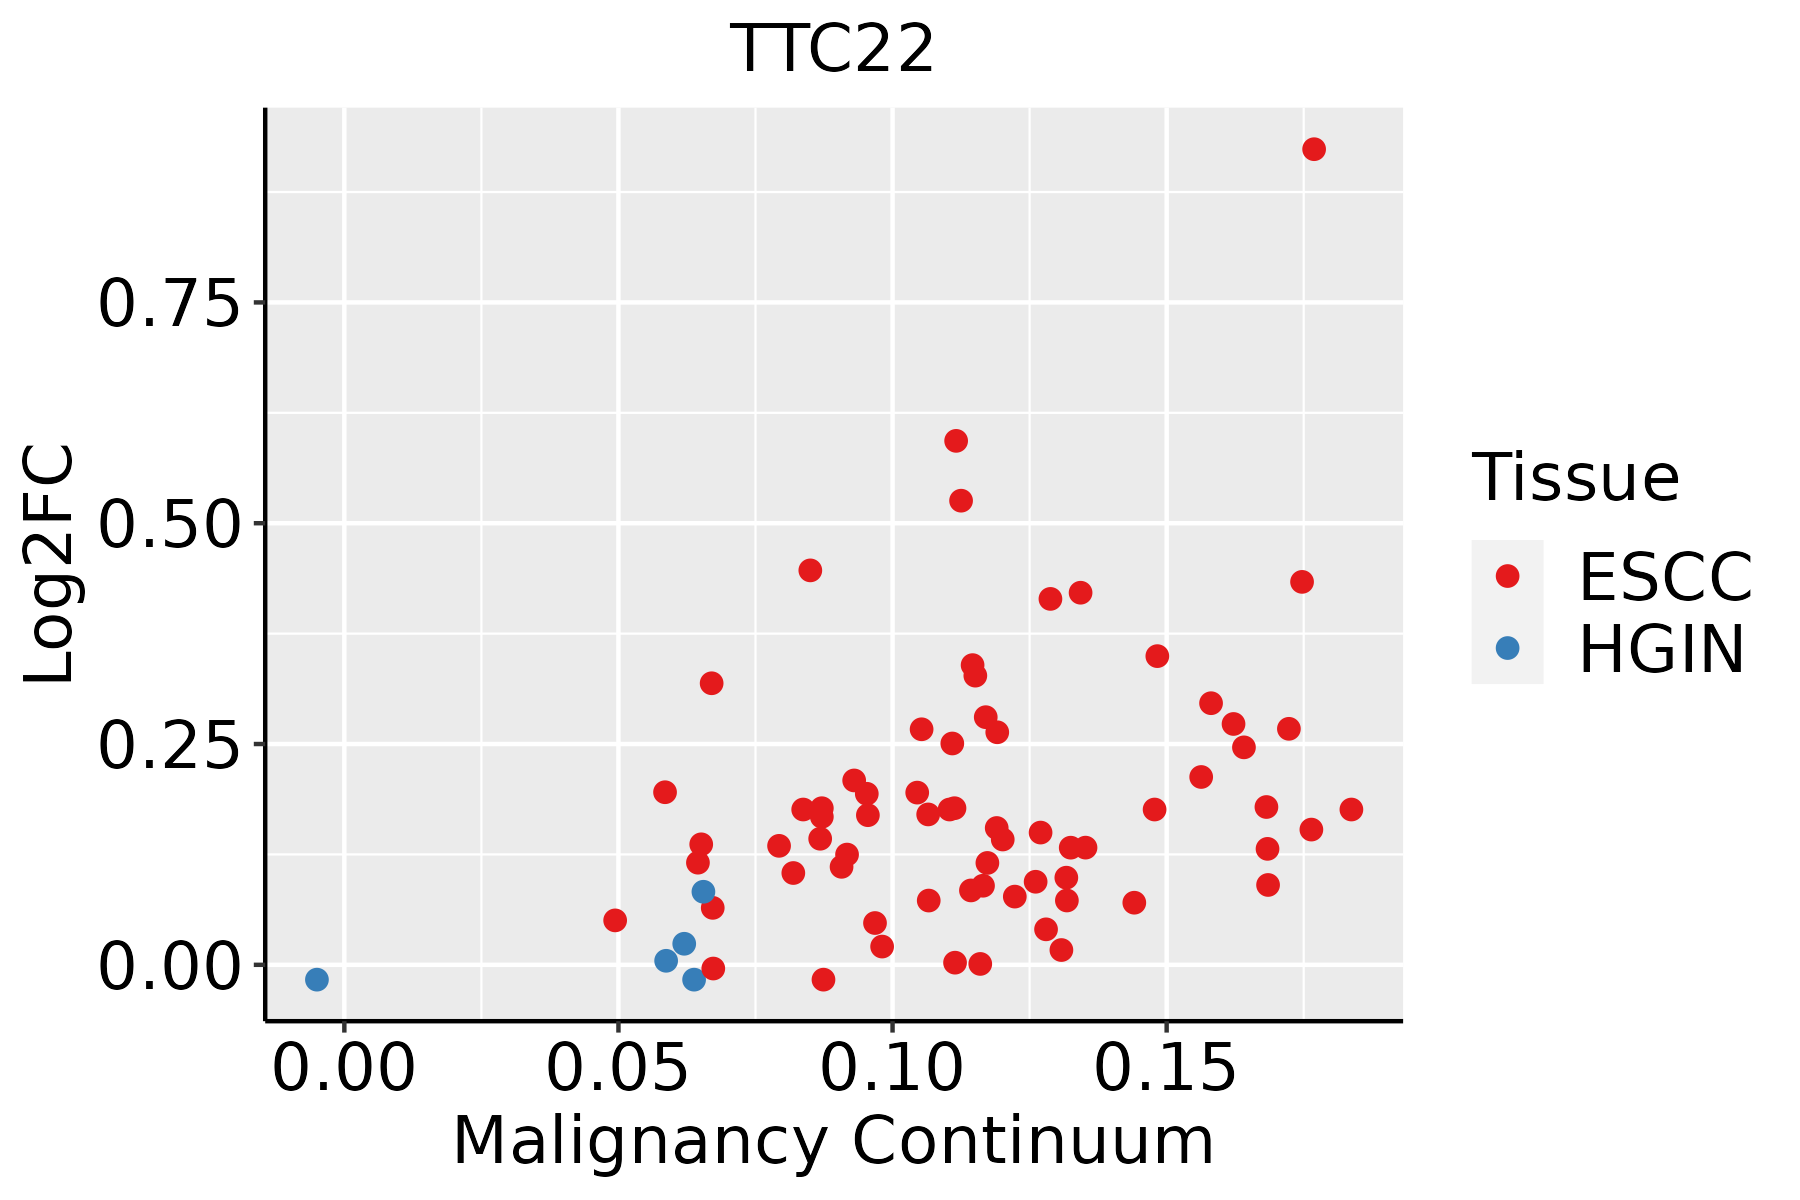 | ESCC: Esophageal squamous cell carcinoma |
| HGIN: High-grade intraepithelial neoplasias | ||
| LGIN: Low-grade intraepithelial neoplasias |
| ∗log2FC in expression of this searched gene in stem-like cells from each diseased tissue sample relative to stem-like cells in normal samples in each tissue plotted against the malignancy continuum. Samples are colored based on if they are from different disease stage. |
Top |
Malignant transformation related pathway analysis |
| Find out the enriched GO biological processes and KEGG pathways involved in transition from healthy to precancer to cancer |
| Tissue | Disease Stage | Enriched GO biological Processes |
| Colorectum | AD |  |
| Colorectum | SER |  |
| Colorectum | MSS |  |
| Colorectum | MSI-H |  |
| Colorectum | FAP |  |
| ∗Top 15 enriched GO BP terms are showed in the bar plot of each disease state in each tissue. Each row represents a significant GO biological process which is colored according to the -log10(p.adjust). |
| Page: 1 2 3 4 5 6 7 8 9 |
| GO ID | Tissue | Disease Stage | Description | Gene Ratio | Bg Ratio | pvalue | p.adjust | Count |
| Page: 1 |
| Pathway ID | Tissue | Disease Stage | Description | Gene Ratio | Bg Ratio | pvalue | p.adjust | qvalue | Count |
| Page: 1 |
Top |
Cell-cell communication analysis |
| Identification of potential cell-cell interactions between two cell types and their ligand-receptor pairs for different disease states |
| Ligand | Receptor | LRpair | Pathway | Tissue | Disease Stage |
| Page: 1 |
Top |
Single-cell gene regulatory network inference analysis |
| Find out the significant the regulons (TFs) and the target genes of each regulon across cell types for different disease states |
| TF | Cell Type | Tissue | Disease Stage | Target Gene | RSS | Regulon Activity |
| ∗The dot plots of a searched regulon are shown for all cell subpopulations in each disease state of each tissue based on the regulon specific score inferred using pySCENIC and by calculating the average expression. |
| Page: 1 |
Top |
Somatic mutation of malignant transformation related genes |
| Annotation of somatic variants for genes involved in malignant transformation |
| Hugo Symbol | Variant Class | Variant Classification | dbSNP RS | HGVSc | HGVSp | HGVSp Short | SWISSPROT | BIOTYPE | SIFT | PolyPhen | Tumor Sample Barcode | Tissue | Histology | Sex | Age | Stage | Therapy Types | Drugs | Outcome |
| TTC22 | SNV | Missense_Mutation | rs753225414 | c.689C>T | p.Thr230Met | p.T230M | Q5TAA0 | protein_coding | deleterious(0.04) | possibly_damaging(0.84) | TCGA-AN-A0FY-01 | Breast | breast invasive carcinoma | Female | <65 | I/II | Unknown | Unknown | SD |
| TTC22 | SNV | Missense_Mutation | rs756889138 | c.726N>A | p.Asp242Glu | p.D242E | Q5TAA0 | protein_coding | tolerated(0.5) | benign(0) | TCGA-B6-A0I1-01 | Breast | breast invasive carcinoma | Female | >=65 | I/II | Unknown | Unknown | PD |
| TTC22 | insertion | Nonsense_Mutation | novel | c.940_941insTGTGAGC | p.Ala314ValfsTer2 | p.A314Vfs*2 | Q5TAA0 | protein_coding | TCGA-AO-A03T-01 | Breast | breast invasive carcinoma | Female | <65 | I/II | Chemotherapy | cyclophosphamide | SD | ||
| TTC22 | insertion | In_Frame_Ins | novel | c.938_939insCCCACCTCGACCTCCCAAAGTGCTGGAATTCCA | p.Met313delinsIleProProArgProProLysValLeuGluPheGln | p.M313delinsIPPRPPKVLEFQ | Q5TAA0 | protein_coding | TCGA-AO-A03T-01 | Breast | breast invasive carcinoma | Female | <65 | I/II | Chemotherapy | cyclophosphamide | SD | ||
| TTC22 | SNV | Missense_Mutation | novel | c.789C>A | p.Phe263Leu | p.F263L | Q5TAA0 | protein_coding | tolerated(0.1) | probably_damaging(0.978) | TCGA-2W-A8YY-01 | Cervix | cervical & endocervical cancer | Female | <65 | I/II | Chemotherapy | cisplatin | CR |
| TTC22 | SNV | Missense_Mutation | novel | c.325N>A | p.Val109Met | p.V109M | Q5TAA0 | protein_coding | deleterious(0) | probably_damaging(0.997) | TCGA-C5-A901-01 | Cervix | cervical & endocervical cancer | Female | <65 | I/II | Unknown | Unknown | SD |
| TTC22 | SNV | Missense_Mutation | novel | c.1696N>A | p.Ala566Thr | p.A566T | Q5TAA0 | protein_coding | tolerated_low_confidence(0.29) | benign(0.025) | TCGA-5M-AAT6-01 | Colorectum | colon adenocarcinoma | Female | <65 | III/IV | Unknown | Unknown | PD |
| TTC22 | SNV | Missense_Mutation | c.694G>A | p.Ala232Thr | p.A232T | Q5TAA0 | protein_coding | tolerated(0.54) | benign(0) | TCGA-AA-A017-01 | Colorectum | colon adenocarcinoma | Female | <65 | I/II | Unknown | Unknown | SD | |
| TTC22 | SNV | Missense_Mutation | rs780887864 | c.721G>A | p.Glu241Lys | p.E241K | Q5TAA0 | protein_coding | tolerated(0.3) | benign(0.007) | TCGA-AZ-6601-01 | Colorectum | colon adenocarcinoma | Male | >=65 | I/II | Unknown | Unknown | PD |
| TTC22 | SNV | Missense_Mutation | c.1198G>A | p.Ala400Thr | p.A400T | Q5TAA0 | protein_coding | tolerated(0.1) | probably_damaging(0.945) | TCGA-CK-4951-01 | Colorectum | colon adenocarcinoma | Female | >=65 | I/II | Unknown | Unknown | PD |
| Page: 1 2 3 |
Top |
Related drugs of malignant transformation related genes |
| Identification of chemicals and drugs interact with genes involved in malignant transfromation |
| (DGIdb 4.0) |
| Entrez ID | Symbol | Category | Interaction Types | Drug Claim Name | Drug Name | PMIDs |
| Page: 1 |

Copyright 2023-Present -The University of Texas Health Science Center at Houston |