
|
|||||
|
 | |
| |
| |
| |
| |
| |
|
Gene: TTC21B |
Gene summary for TTC21B |
| Gene information | Species | Human | Gene symbol | TTC21B | Gene ID | 79809 |
| Gene name | tetratricopeptide repeat domain 21B | |
| Gene Alias | ATD4 | |
| Cytomap | 2q24.3 | |
| Gene Type | protein-coding | GO ID | GO:0003002 | UniProtAcc | A8KA77 |
Top |
Malignant transformation analysis |
| Identification of the aberrant gene expression in precancerous and cancerous lesions by comparing the gene expression of stem-like cells in diseased tissues with normal stem cells |
| Entrez ID | Symbol | Replicates | Species | Organ | Tissue | Adj P-value | Log2FC | Malignancy |
| 79809 | TTC21B | NAFLD1 | Human | Liver | NAFLD | 1.55e-07 | 5.38e-01 | -0.04 |
| 79809 | TTC21B | HCC1_Meng | Human | Liver | HCC | 2.05e-23 | -5.20e-02 | 0.0246 |
| 79809 | TTC21B | HCC2_Meng | Human | Liver | HCC | 6.29e-07 | -3.40e-02 | 0.0107 |
| 79809 | TTC21B | HCC2 | Human | Liver | HCC | 4.43e-05 | 1.89e+00 | 0.5341 |
| 79809 | TTC21B | S028 | Human | Liver | HCC | 4.01e-04 | 1.21e-01 | 0.2503 |
| 79809 | TTC21B | GSM5252132_BPH389PrGF | Human | Prostate | BPH | 1.58e-02 | 1.74e-01 | -0.2247 |
| 79809 | TTC21B | GSM5252136_BPH556PrGA1_Fcol | Human | Prostate | BPH | 3.05e-02 | 1.53e-01 | -0.23 |
| 79809 | TTC21B | GSM5252137_BPH556PrGA2_Fcol | Human | Prostate | BPH | 3.04e-03 | 2.32e-01 | -0.23 |
| 79809 | TTC21B | 048752_1579-all-cells | Human | Prostate | BPH | 3.04e-04 | 2.71e-01 | 0.1008 |
| 79809 | TTC21B | 052095_1628-all-cells | Human | Prostate | BPH | 5.27e-19 | 4.49e-01 | 0.1032 |
| 79809 | TTC21B | 052097_1595-all-cells | Human | Prostate | BPH | 4.21e-11 | 2.80e-01 | 0.0972 |
| 79809 | TTC21B | 052099_1652-all-cells | Human | Prostate | BPH | 1.97e-11 | 2.85e-01 | 0.1038 |
| 79809 | TTC21B | Dong_P3 | Human | Prostate | Tumor | 8.63e-04 | 5.93e-02 | 0.0278 |
| 79809 | TTC21B | GSM5353222_PA_PB2B_Pool_1_3_S52_L002 | Human | Prostate | Tumor | 8.99e-11 | 5.55e-01 | 0.1608 |
| 79809 | TTC21B | GSM5353223_PA_PB2B_Pool_2_S26_L001 | Human | Prostate | Tumor | 1.78e-04 | 4.66e-01 | 0.1604 |
| 79809 | TTC21B | GSM5353237_PA_PR5251_T2_S8_L001 | Human | Prostate | Tumor | 8.04e-04 | 6.14e-01 | 0.1622 |
| Page: 1 |
| Tissue | Expression Dynamics | Abbreviation |
| Liver | 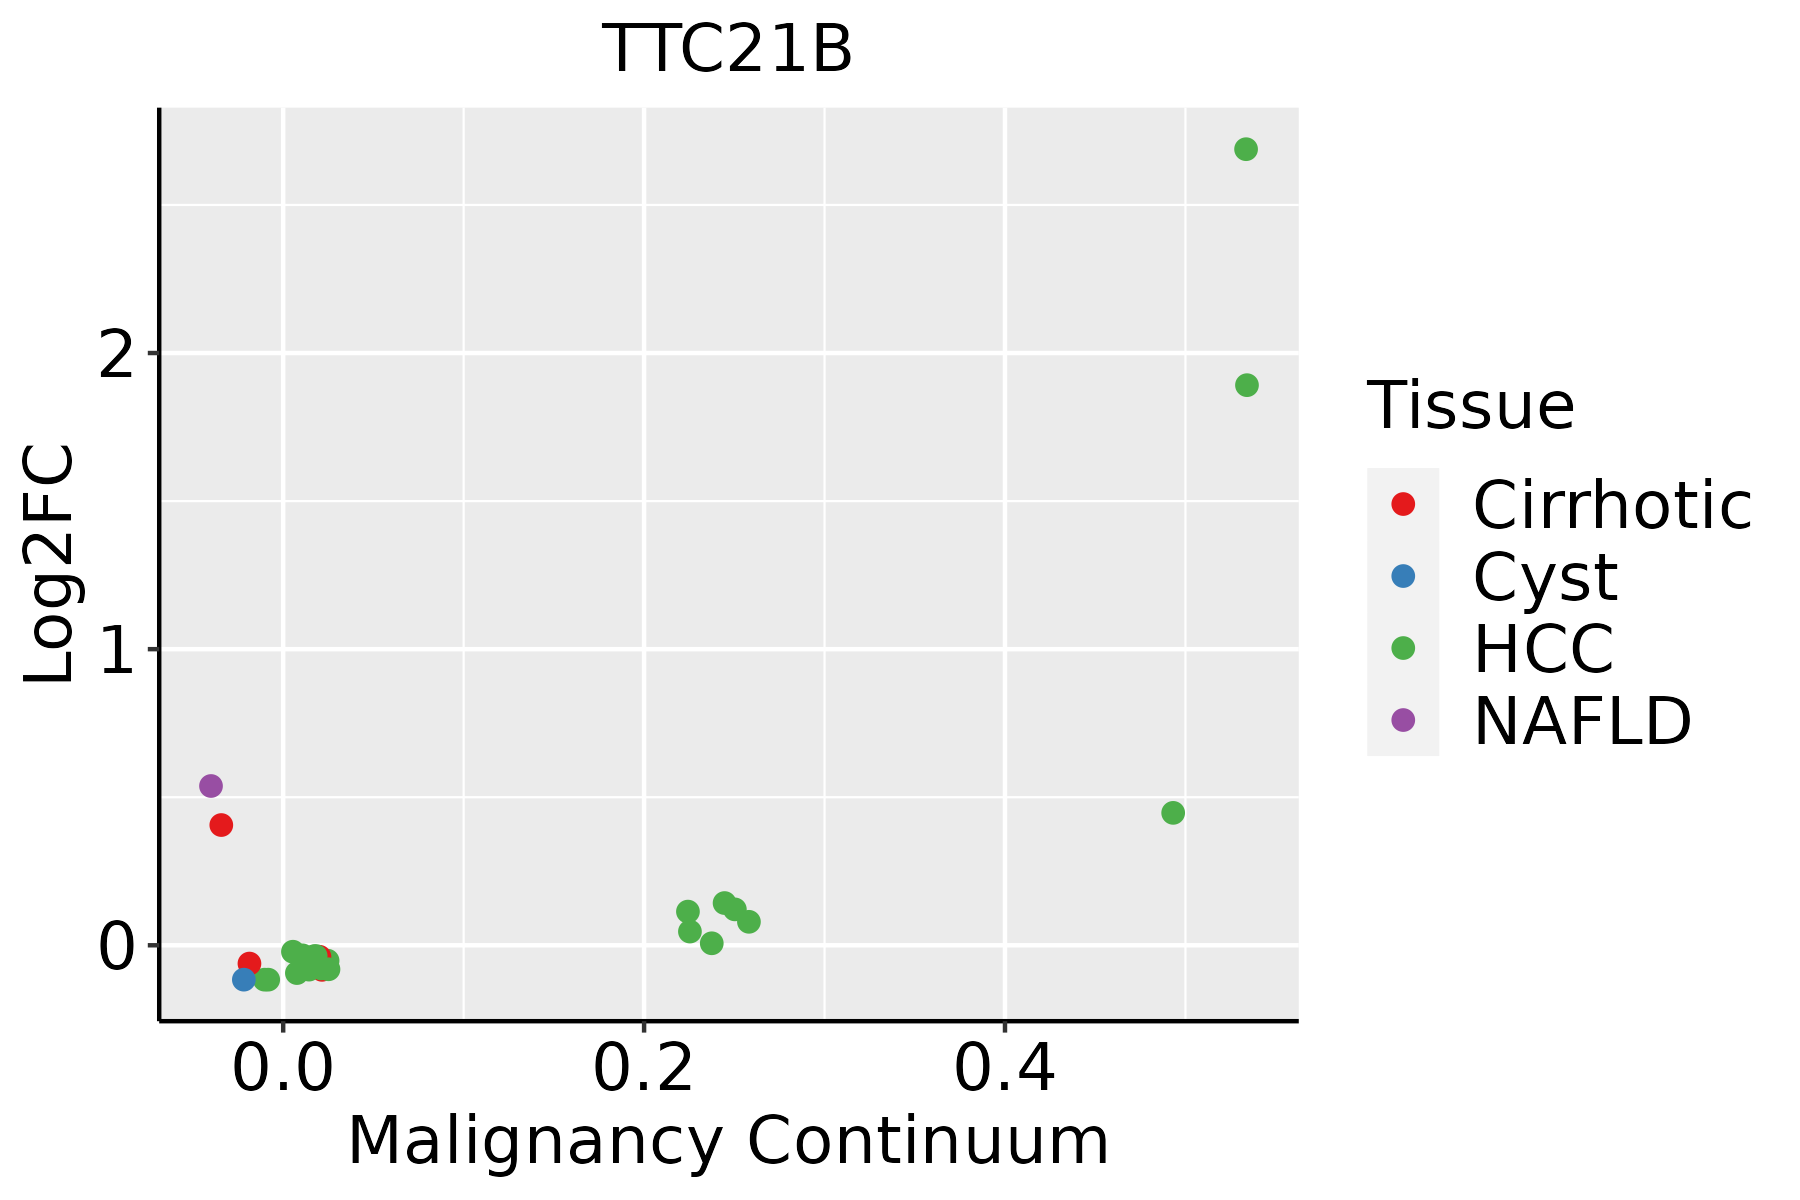 | HCC: Hepatocellular carcinoma |
| NAFLD: Non-alcoholic fatty liver disease | ||
| Prostate | 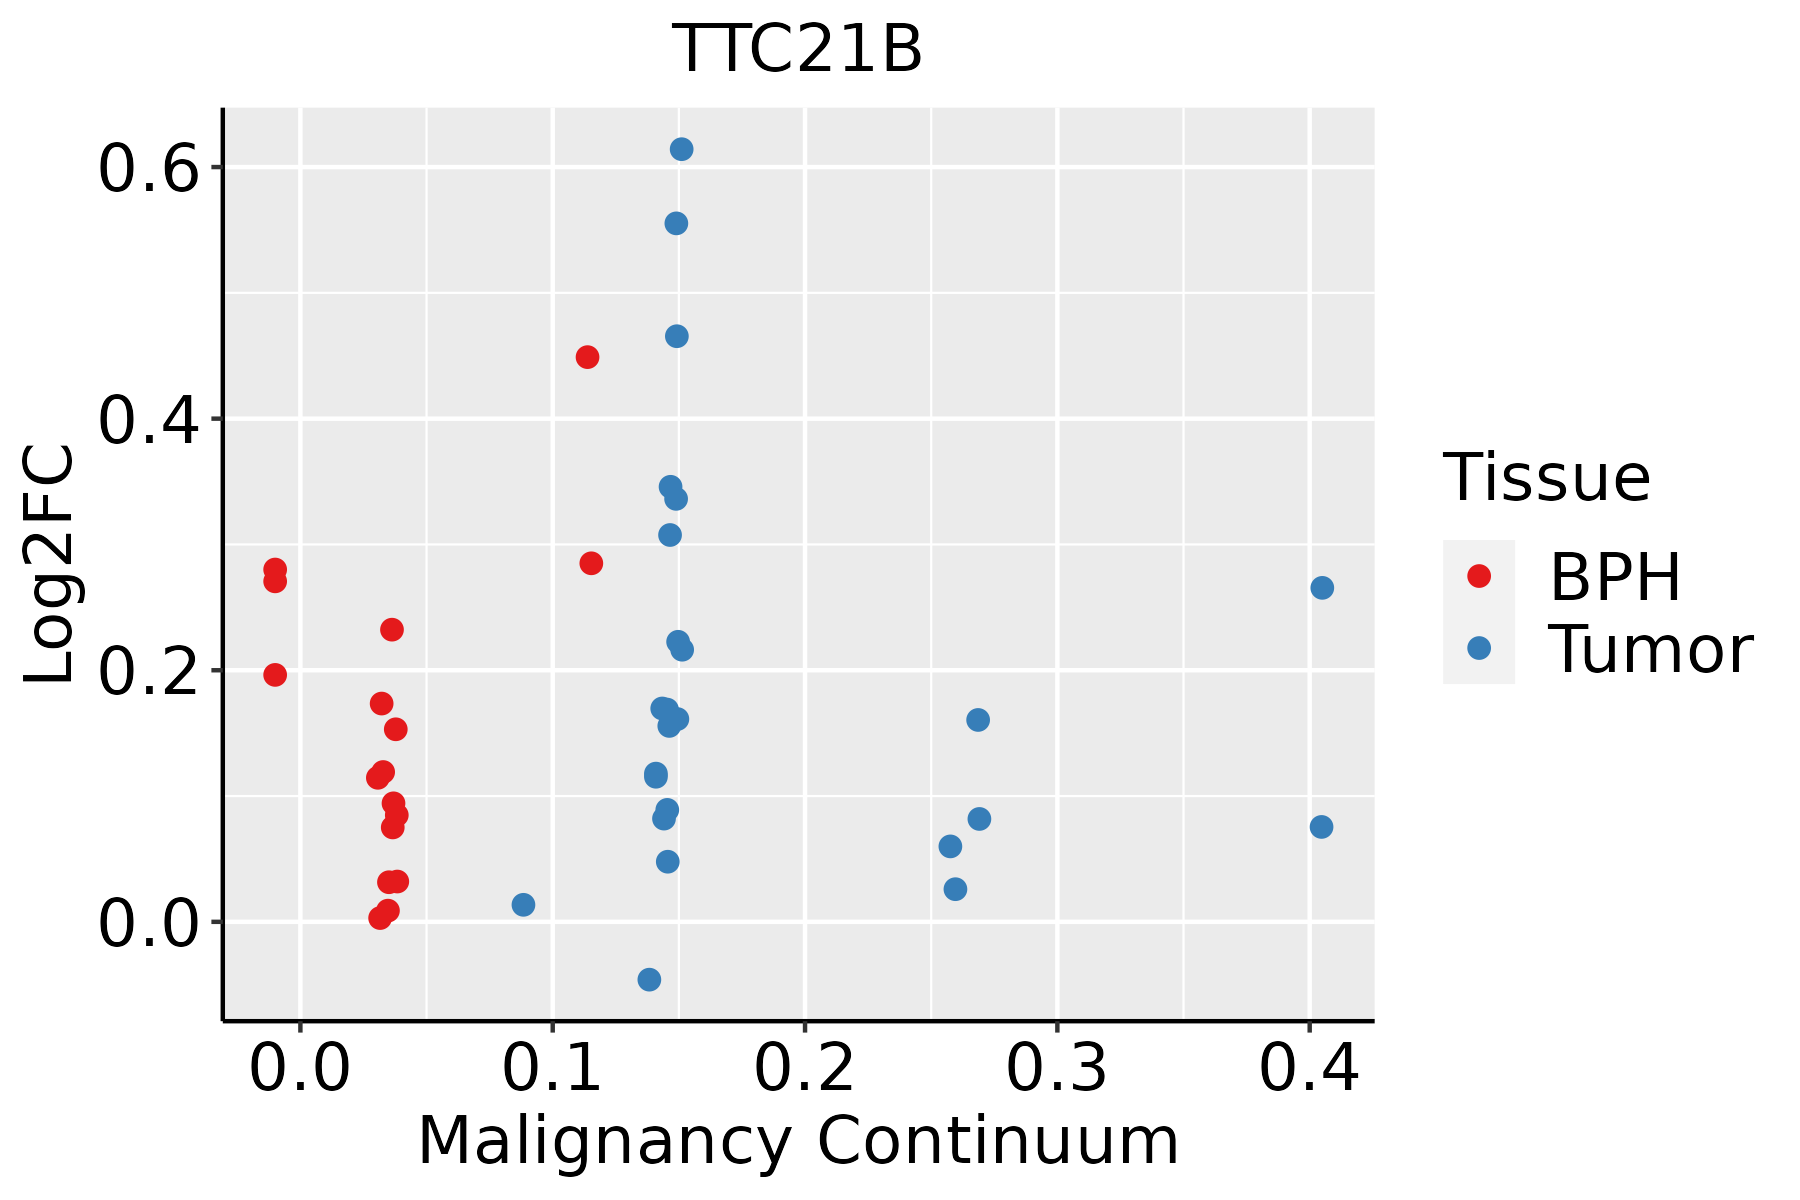 | BPH: Benign Prostatic Hyperplasia |
| ∗log2FC in expression of this searched gene in stem-like cells from each diseased tissue sample relative to stem-like cells in normal samples in each tissue plotted against the malignancy continuum. Samples are colored based on if they are from different disease stage. |
Top |
Malignant transformation related pathway analysis |
| Find out the enriched GO biological processes and KEGG pathways involved in transition from healthy to precancer to cancer |
| Tissue | Disease Stage | Enriched GO biological Processes |
| Colorectum | AD |  |
| Colorectum | SER |  |
| Colorectum | MSS |  |
| Colorectum | MSI-H |  |
| Colorectum | FAP |  |
| ∗Top 15 enriched GO BP terms are showed in the bar plot of each disease state in each tissue. Each row represents a significant GO biological process which is colored according to the -log10(p.adjust). |
| Page: 1 2 3 4 5 6 7 8 9 |
| GO ID | Tissue | Disease Stage | Description | Gene Ratio | Bg Ratio | pvalue | p.adjust | Count |
| GO:00160555 | Liver | NAFLD | Wnt signaling pathway | 74/1882 | 444/18723 | 8.98e-06 | 2.96e-04 | 74 |
| GO:01987385 | Liver | NAFLD | cell-cell signaling by wnt | 74/1882 | 446/18723 | 1.05e-05 | 3.33e-04 | 74 |
| GO:00301115 | Liver | NAFLD | regulation of Wnt signaling pathway | 57/1882 | 328/18723 | 2.79e-05 | 7.46e-04 | 57 |
| GO:00608285 | Liver | NAFLD | regulation of canonical Wnt signaling pathway | 44/1882 | 253/18723 | 2.14e-04 | 3.68e-03 | 44 |
| GO:00600705 | Liver | NAFLD | canonical Wnt signaling pathway | 50/1882 | 303/18723 | 3.08e-04 | 4.83e-03 | 50 |
| GO:00301774 | Liver | NAFLD | positive regulation of Wnt signaling pathway | 27/1882 | 140/18723 | 6.82e-04 | 8.76e-03 | 27 |
| GO:00902634 | Liver | NAFLD | positive regulation of canonical Wnt signaling pathway | 21/1882 | 106/18723 | 1.81e-03 | 1.86e-02 | 21 |
| GO:00307055 | Liver | NAFLD | cytoskeleton-dependent intracellular transport | 33/1882 | 195/18723 | 1.98e-03 | 1.98e-02 | 33 |
| GO:00323866 | Liver | NAFLD | regulation of intracellular transport | 49/1882 | 337/18723 | 5.34e-03 | 4.11e-02 | 49 |
| GO:00109703 | Liver | NAFLD | transport along microtubule | 26/1882 | 155/18723 | 6.30e-03 | 4.69e-02 | 26 |
| GO:003238621 | Liver | HCC | regulation of intracellular transport | 231/7958 | 337/18723 | 1.99e-22 | 3.40e-20 | 231 |
| GO:019873821 | Liver | HCC | cell-cell signaling by wnt | 247/7958 | 446/18723 | 2.11e-08 | 4.96e-07 | 247 |
| GO:001605521 | Liver | HCC | Wnt signaling pathway | 245/7958 | 444/18723 | 3.68e-08 | 8.09e-07 | 245 |
| GO:00315031 | Liver | HCC | protein-containing complex localization | 129/7958 | 220/18723 | 9.38e-07 | 1.42e-05 | 129 |
| GO:003011121 | Liver | HCC | regulation of Wnt signaling pathway | 180/7958 | 328/18723 | 3.62e-06 | 4.72e-05 | 180 |
| GO:003070521 | Liver | HCC | cytoskeleton-dependent intracellular transport | 111/7958 | 195/18723 | 3.25e-05 | 3.28e-04 | 111 |
| GO:00109702 | Liver | HCC | transport along microtubule | 90/7958 | 155/18723 | 6.49e-05 | 5.92e-04 | 90 |
| GO:006007021 | Liver | HCC | canonical Wnt signaling pathway | 162/7958 | 303/18723 | 7.00e-05 | 6.32e-04 | 162 |
| GO:006082821 | Liver | HCC | regulation of canonical Wnt signaling pathway | 137/7958 | 253/18723 | 1.15e-04 | 9.70e-04 | 137 |
| GO:003017721 | Liver | HCC | positive regulation of Wnt signaling pathway | 81/7958 | 140/18723 | 1.73e-04 | 1.36e-03 | 81 |
| Page: 1 2 3 |
| Pathway ID | Tissue | Disease Stage | Description | Gene Ratio | Bg Ratio | pvalue | p.adjust | qvalue | Count |
| Page: 1 |
Top |
Cell-cell communication analysis |
| Identification of potential cell-cell interactions between two cell types and their ligand-receptor pairs for different disease states |
| Ligand | Receptor | LRpair | Pathway | Tissue | Disease Stage |
| Page: 1 |
Top |
Single-cell gene regulatory network inference analysis |
| Find out the significant the regulons (TFs) and the target genes of each regulon across cell types for different disease states |
| TF | Cell Type | Tissue | Disease Stage | Target Gene | RSS | Regulon Activity |
| ∗The dot plots of a searched regulon are shown for all cell subpopulations in each disease state of each tissue based on the regulon specific score inferred using pySCENIC and by calculating the average expression. |
| Page: 1 |
Top |
Somatic mutation of malignant transformation related genes |
| Annotation of somatic variants for genes involved in malignant transformation |
| Hugo Symbol | Variant Class | Variant Classification | dbSNP RS | HGVSc | HGVSp | HGVSp Short | SWISSPROT | BIOTYPE | SIFT | PolyPhen | Tumor Sample Barcode | Tissue | Histology | Sex | Age | Stage | Therapy Types | Drugs | Outcome |
| TTC21B | SNV | Missense_Mutation | novel | c.1169N>G | p.Ser390Cys | p.S390C | Q7Z4L5 | protein_coding | deleterious(0.01) | possibly_damaging(0.838) | TCGA-A2-A0CL-01 | Breast | breast invasive carcinoma | Female | <65 | III/IV | Chemotherapy | cytoxan | SD |
| TTC21B | SNV | Missense_Mutation | rs747866883 | c.902G>A | p.Arg301His | p.R301H | Q7Z4L5 | protein_coding | deleterious(0.04) | probably_damaging(0.999) | TCGA-A8-A0A4-01 | Breast | breast invasive carcinoma | Female | >=65 | I/II | Hormone Therapy | tamoxiphen | CR |
| TTC21B | SNV | Missense_Mutation | novel | c.3877N>T | p.Leu1293Phe | p.L1293F | Q7Z4L5 | protein_coding | deleterious(0) | probably_damaging(0.999) | TCGA-AC-A5XS-01 | Breast | breast invasive carcinoma | Female | >=65 | I/II | Hormone Therapy | femara | SD |
| TTC21B | SNV | Missense_Mutation | novel | c.3799N>A | p.Ala1267Thr | p.A1267T | Q7Z4L5 | protein_coding | tolerated(0.56) | benign(0) | TCGA-AN-A046-01 | Breast | breast invasive carcinoma | Female | >=65 | I/II | Unknown | Unknown | SD |
| TTC21B | SNV | Missense_Mutation | c.1016N>T | p.Arg339Ile | p.R339I | Q7Z4L5 | protein_coding | deleterious(0) | benign(0.193) | TCGA-AN-A0AK-01 | Breast | breast invasive carcinoma | Female | >=65 | I/II | Unknown | Unknown | SD | |
| TTC21B | SNV | Missense_Mutation | c.1993N>A | p.Leu665Ile | p.L665I | Q7Z4L5 | protein_coding | tolerated(0.09) | benign(0.085) | TCGA-BH-A0EE-01 | Breast | breast invasive carcinoma | Female | >=65 | I/II | Chemotherapy | docetaxel | SD | |
| TTC21B | SNV | Missense_Mutation | c.781N>T | p.Gly261Trp | p.G261W | Q7Z4L5 | protein_coding | deleterious(0) | probably_damaging(1) | TCGA-BH-A203-01 | Breast | breast invasive carcinoma | Female | >=65 | I/II | Unknown | Unknown | PD | |
| TTC21B | insertion | Frame_Shift_Ins | novel | c.873_874insT | p.Thr292TyrfsTer11 | p.T292Yfs*11 | Q7Z4L5 | protein_coding | TCGA-E2-A15C-01 | Breast | breast invasive carcinoma | Female | <65 | I/II | Hormone Therapy | arimidex | SD | ||
| TTC21B | SNV | Missense_Mutation | c.1834N>T | p.Asp612Tyr | p.D612Y | Q7Z4L5 | protein_coding | deleterious(0.02) | possibly_damaging(0.526) | TCGA-C5-A1MJ-01 | Cervix | cervical & endocervical cancer | Female | <65 | I/II | Unknown | Unknown | SD | |
| TTC21B | SNV | Missense_Mutation | novel | c.2215G>A | p.Glu739Lys | p.E739K | Q7Z4L5 | protein_coding | deleterious(0) | possibly_damaging(0.755) | TCGA-C5-A8XK-01 | Cervix | cervical & endocervical cancer | Female | <65 | I/II | Chemotherapy | cisplatin | SD |
| Page: 1 2 3 4 5 6 7 8 9 10 11 12 13 14 15 16 |
Top |
Related drugs of malignant transformation related genes |
| Identification of chemicals and drugs interact with genes involved in malignant transfromation |
| (DGIdb 4.0) |
| Entrez ID | Symbol | Category | Interaction Types | Drug Claim Name | Drug Name | PMIDs |
| Page: 1 |

Copyright 2023-Present -The University of Texas Health Science Center at Houston |