Schematic overview of the cellular and molecular mechanisms involved in the cancer progression, including the proposed cellular and molecular mechanisms in cancer cells trajectory. AT1: alveolar type 1 cells; AT2: alveolar type 2 cells; AAH: atypical adenomatous hyperplasia; AIS: adenocarcinoma in situ; MIA: minimally invasive adenocarcinoma; IA: invasive adenocarcinoma; EMT: epithelial-mesenchymal transition

Home

Download

Statistics

Help

Contact

Center for Computational Systems Medicine
leaf

Gene summary

leaf

Malignant transformation analysis

leaf

Malignant transformation related pathway analysis

leaf

Cell-cell communication analysis

leaf

Single-cell gene regulatory network inference analysis

leaf

Somatic mutation of malignant transformation related genes

leaf

Related drugs of malignant transformation related genes

Gene: TTC19

Gene summary for TTC19

check button Gene summary.

Gene informationSpeciesHuman
Gene symbol

TTC19

Gene ID

54902

Gene nametetratricopeptide repeat domain 19
Gene Alias2010204O13Rik
Cytomap17p12
Gene Typeprotein-coding
GO ID

GO:0000278

UniProtAcc

Q6DKK2


Top

Malignant transformation analysis

check button Identification of the aberrant gene expression in precancerous and cancerous lesions by comparing the gene expression of stem-like cells in diseased tissues with normal stem cells
check button Malignant transformation involving gene list.
Entrez IDSymbolReplicatesSpeciesOrganTissueAdj P-valueLog2FCMalignancy
54902TTC19HTA11_3410_2000001011HumanColorectumAD3.65e-12-4.45e-010.0155
54902TTC19HTA11_3361_2000001011HumanColorectumAD1.64e-03-4.21e-01-0.1207
54902TTC19HTA11_696_2000001011HumanColorectumAD4.88e-02-2.49e-01-0.1464
54902TTC19HTA11_866_3004761011HumanColorectumAD7.04e-03-2.73e-010.096
54902TTC19HTA11_10711_2000001011HumanColorectumAD4.76e-02-3.49e-010.0338
54902TTC19HTA11_7696_3000711011HumanColorectumAD3.01e-03-3.05e-010.0674
54902TTC19HTA11_99999971662_82457HumanColorectumMSS2.35e-04-3.41e-010.3859
54902TTC19HTA11_99999973899_84307HumanColorectumMSS9.19e-04-4.93e-010.2585
54902TTC19HTA11_99999974143_84620HumanColorectumMSS2.55e-06-3.63e-010.3005
54902TTC19A001-C-207HumanColorectumFAP1.31e-06-3.19e-010.1278
54902TTC19A015-C-203HumanColorectumFAP1.74e-27-4.88e-01-0.1294
54902TTC19A015-C-204HumanColorectumFAP2.31e-06-2.83e-01-0.0228
54902TTC19A014-C-040HumanColorectumFAP1.48e-05-4.34e-01-0.1184
54902TTC19A002-C-201HumanColorectumFAP7.24e-17-4.14e-010.0324
54902TTC19A002-C-203HumanColorectumFAP2.97e-03-1.78e-010.2786
54902TTC19A001-C-119HumanColorectumFAP2.81e-09-3.96e-01-0.1557
54902TTC19A001-C-108HumanColorectumFAP3.26e-14-2.35e-01-0.0272
54902TTC19A002-C-205HumanColorectumFAP8.85e-24-4.21e-01-0.1236
54902TTC19A001-C-104HumanColorectumFAP9.58e-03-1.64e-010.0184
54902TTC19A015-C-005HumanColorectumFAP1.47e-05-2.41e-01-0.0336
Page: 1 2 3 4 5 6 7 8 

check button Transcriptomic changes along malignancy continuum.
TissueExpression DynamicsAbbreviation
Colorectum (GSE201348)The image shows the transcriptomic changes along malignancy continuum.log2FC in expression of this searched gene in stem-like cells from each diseased tissue sample relative to stem-like cells in normal samples in each tissue plotted against the malignancy continuum. Samples are colored based on if they are from different disease stage.FAP: Familial adenomatous polyposis
CRC: Colorectal cancer
Colorectum (HTA11)The image shows the transcriptomic changes along malignancy continuum.log2FC in expression of this searched gene in stem-like cells from each diseased tissue sample relative to stem-like cells in normal samples in each tissue plotted against the malignancy continuum. Samples are colored based on if they are from different disease stage.AD: Adenomas
SER: Sessile serrated lesions
MSI-H: Microsatellite-high colorectal cancer
MSS: Microsatellite stable colorectal cancer
EsophagusThe image shows the transcriptomic changes along malignancy continuum.log2FC in expression of this searched gene in stem-like cells from each diseased tissue sample relative to stem-like cells in normal samples in each tissue plotted against the malignancy continuum. Samples are colored based on if they are from different disease stage.
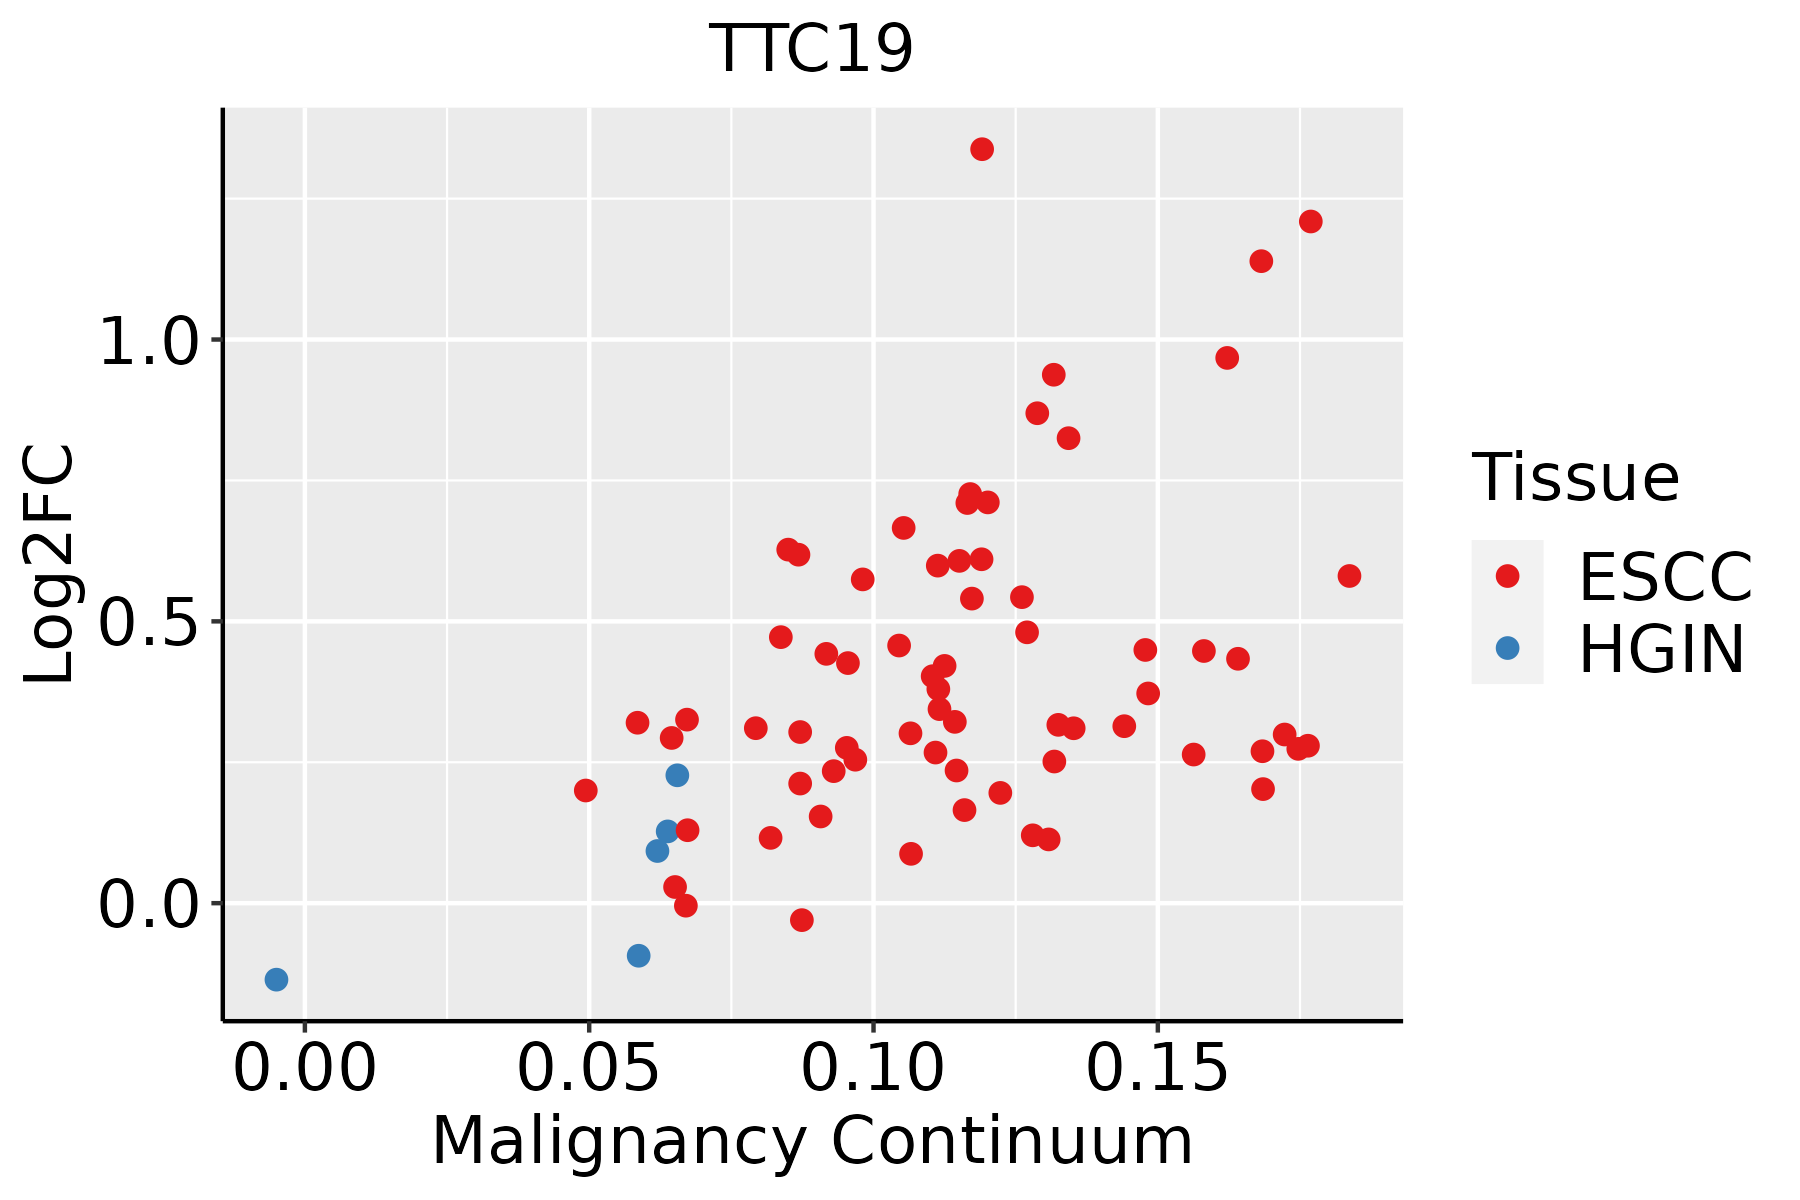
ESCC: Esophageal squamous cell carcinoma
HGIN: High-grade intraepithelial neoplasias
LGIN: Low-grade intraepithelial neoplasias
LungThe image shows the transcriptomic changes along malignancy continuum.log2FC in expression of this searched gene in stem-like cells from each diseased tissue sample relative to stem-like cells in normal samples in each tissue plotted against the malignancy continuum. Samples are colored based on if they are from different disease stage.
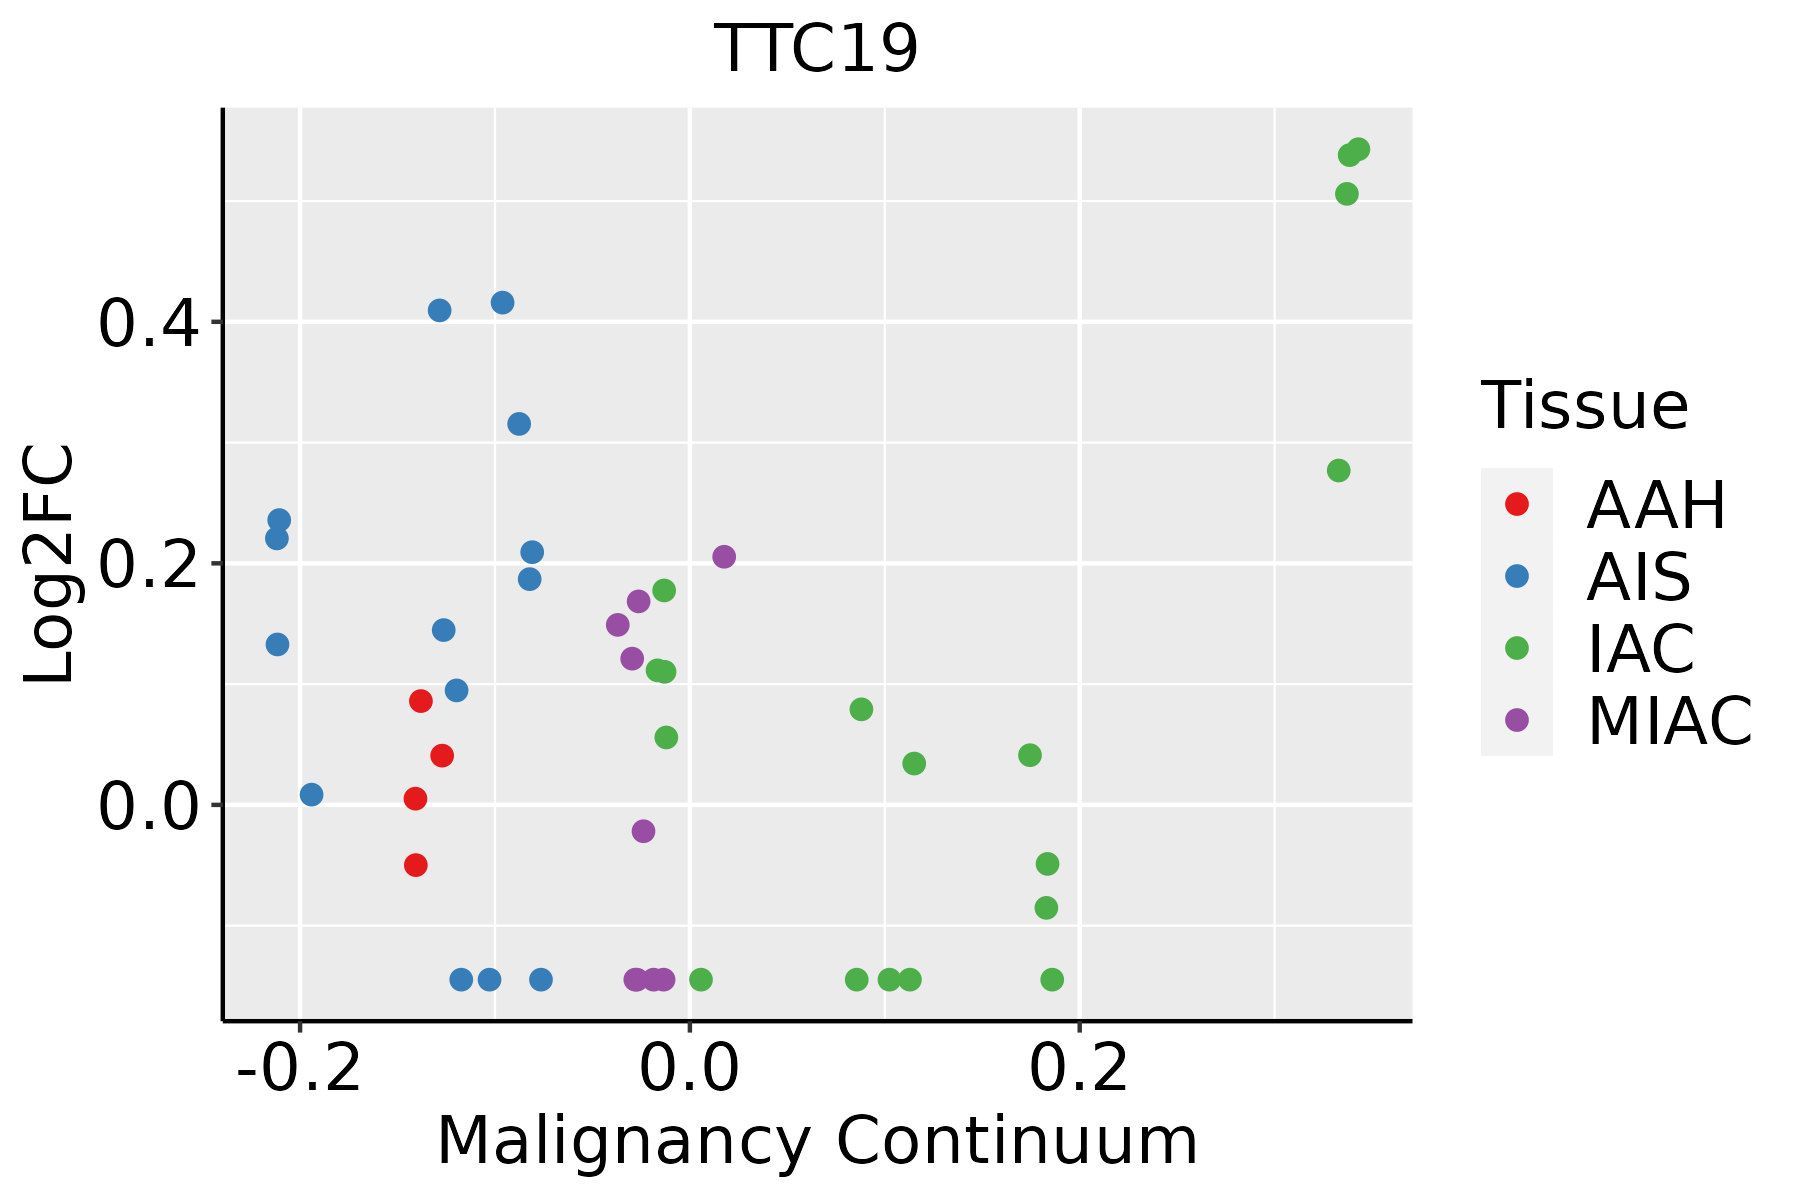
AAH: Atypical adenomatous hyperplasia
AIS: Adenocarcinoma in situ
IAC: Invasive lung adenocarcinoma
MIA: Minimally invasive adenocarcinoma
Oral CavityThe image shows the transcriptomic changes along malignancy continuum.log2FC in expression of this searched gene in stem-like cells from each diseased tissue sample relative to stem-like cells in normal samples in each tissue plotted against the malignancy continuum. Samples are colored based on if they are from different disease stage.
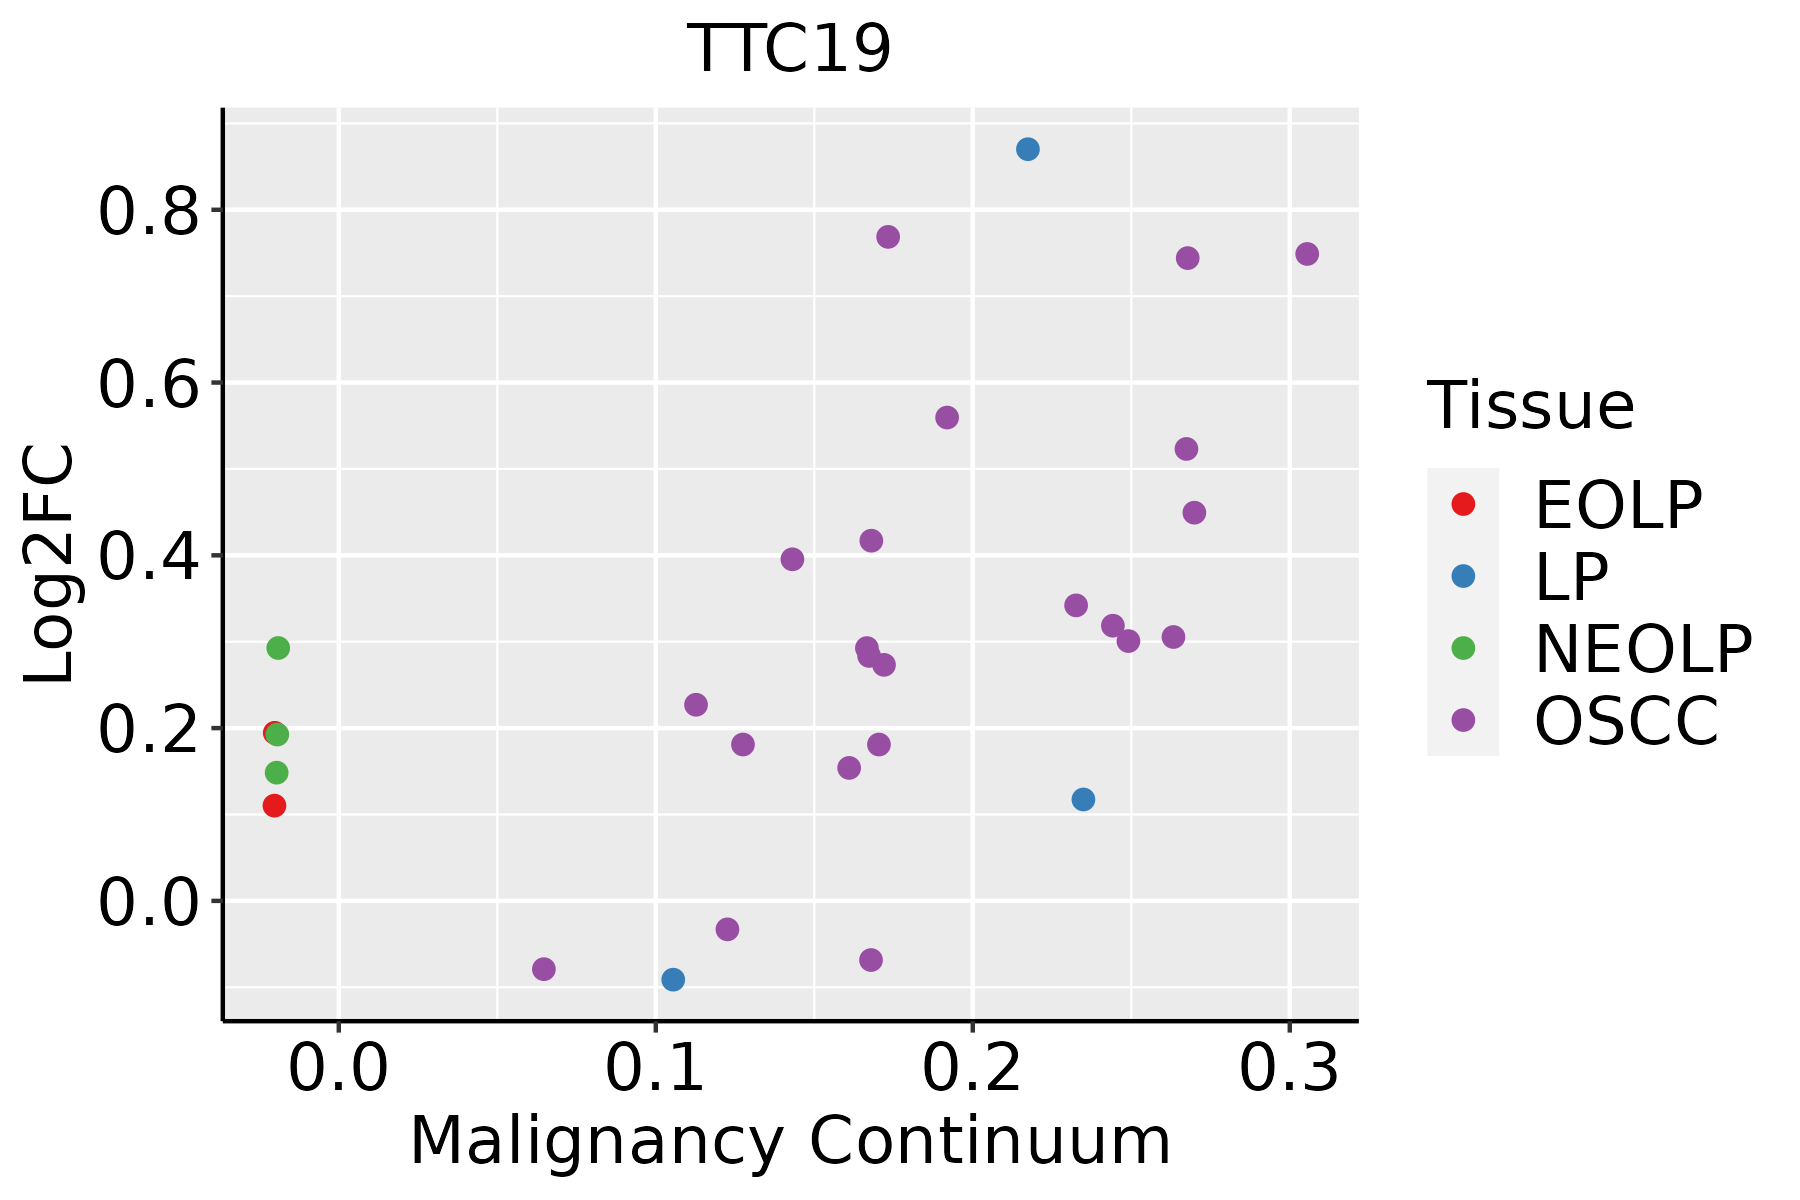
EOLP: Erosive Oral lichen planus
LP: leukoplakia
NEOLP: Non-erosive oral lichen planus
OSCC: Oral squamous cell carcinoma
ProstateThe image shows the transcriptomic changes along malignancy continuum.log2FC in expression of this searched gene in stem-like cells from each diseased tissue sample relative to stem-like cells in normal samples in each tissue plotted against the malignancy continuum. Samples are colored based on if they are from different disease stage.BPH: Benign Prostatic Hyperplasia
SkinThe image shows the transcriptomic changes along malignancy continuum.log2FC in expression of this searched gene in stem-like cells from each diseased tissue sample relative to stem-like cells in normal samples in each tissue plotted against the malignancy continuum. Samples are colored based on if they are from different disease stage.AK: Actinic keratosis
cSCC: Cutaneous squamous cell carcinoma
SCCIS:squamous cell carcinoma in situ
ThyroidThe image shows the transcriptomic changes along malignancy continuum.log2FC in expression of this searched gene in stem-like cells from each diseased tissue sample relative to stem-like cells in normal samples in each tissue plotted against the malignancy continuum. Samples are colored based on if they are from different disease stage.
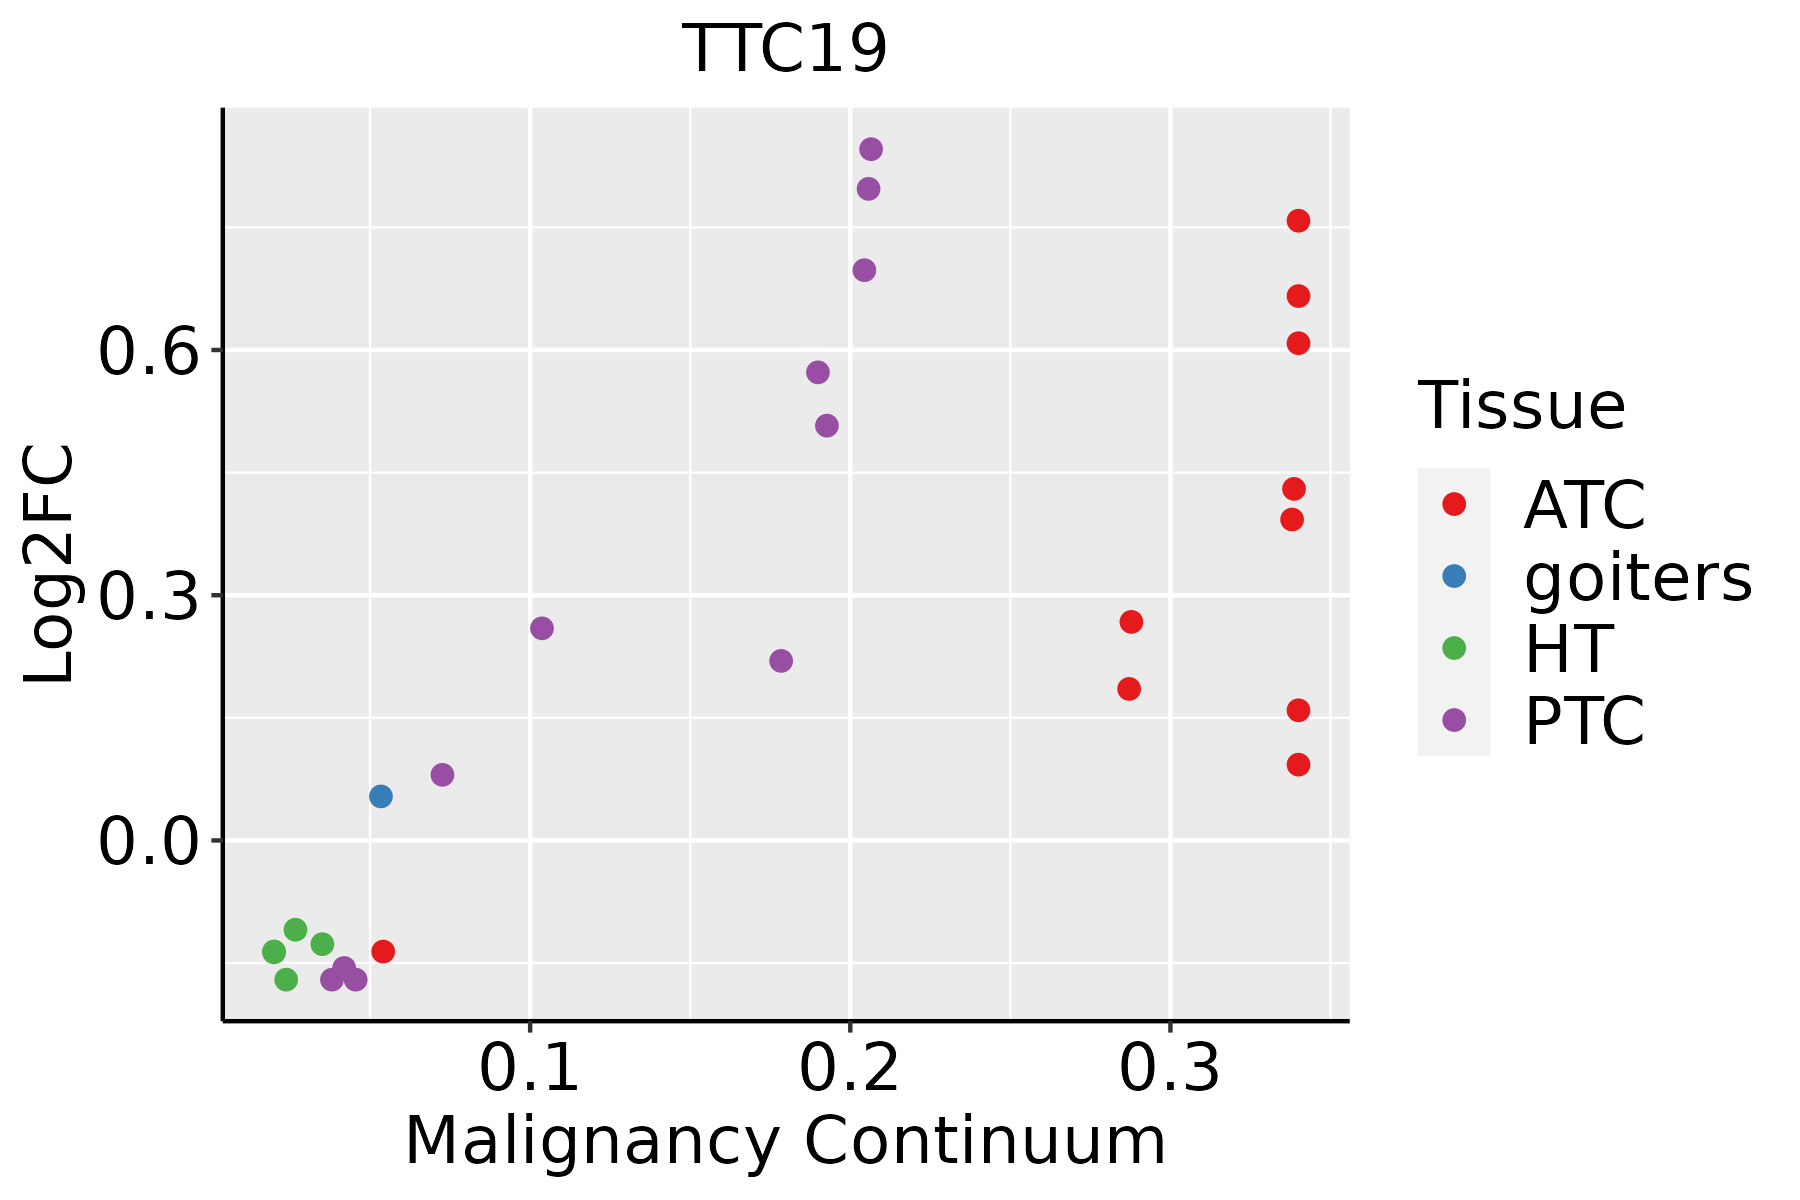
ATC: Anaplastic thyroid cancer
HT: Hashimoto's thyroiditis
PTC: Papillary thyroid cancer
∗log2FC in expression of this searched gene in stem-like cells from each diseased tissue sample relative to stem-like cells in normal samples in each tissue plotted against the malignancy continuum. Samples are colored based on if they are from different disease stage.

Top

Malignant transformation related pathway analysis

check buttonFind out the enriched GO biological processes and KEGG pathways involved in transition from healthy to precancer to cancer
check button Figure of enriched GO biological processes.
TissueDisease StageEnriched GO biological Processes
ColorectumADGO analysis - Figure of enriched GO biological processes: Top 15 enriched GO BP terms are showed in the bar plot of each disease state in each tissue. Each row represents a significant GO biological process which is colored according to the -log10(p.adjust).
ColorectumSERGO analysis - Figure of enriched GO biological processes: Top 15 enriched GO BP terms are showed in the bar plot of each disease state in each tissue. Each row represents a significant GO biological process which is colored according to the -log10(p.adjust).
ColorectumMSSGO analysis - Figure of enriched GO biological processes: Top 15 enriched GO BP terms are showed in the bar plot of each disease state in each tissue. Each row represents a significant GO biological process which is colored according to the -log10(p.adjust).
ColorectumMSI-HGO analysis - Figure of enriched GO biological processes: Top 15 enriched GO BP terms are showed in the bar plot of each disease state in each tissue. Each row represents a significant GO biological process which is colored according to the -log10(p.adjust).
ColorectumFAPGO analysis - Figure of enriched GO biological processes: Top 15 enriched GO BP terms are showed in the bar plot of each disease state in each tissue. Each row represents a significant GO biological process which is colored according to the -log10(p.adjust).
∗Top 15 enriched GO BP terms are showed in the bar plot of each disease state in each tissue. Each row represents a significant GO biological process which is colored according to the -log10(p.adjust).
Page: 1 2 3 4 5 6 7 8 9 

check button Enriched GO biological processes.
GO IDTissueDisease StageDescriptionGene RatioBg Ratiopvaluep.adjustCount
GO:0033108ColorectumADmitochondrial respiratory chain complex assembly46/391893/187238.95e-106.91e-0846
GO:0000910ColorectumADcytokinesis59/3918173/187233.74e-056.75e-0459
GO:0061640ColorectumADcytoskeleton-dependent cytokinesis37/3918100/187231.58e-042.20e-0337
GO:0000281ColorectumADmitotic cytokinesis25/391871/187233.77e-032.65e-0225
GO:00331082ColorectumMSSmitochondrial respiratory chain complex assembly44/346793/187232.17e-102.09e-0844
GO:00009102ColorectumMSScytokinesis49/3467173/187231.02e-031.02e-0249
GO:00002811ColorectumMSSmitotic cytokinesis23/346771/187233.55e-032.63e-0223
GO:00009103ColorectumFAPcytokinesis37/2622173/187235.10e-033.37e-0237
GO:00009104ColorectumCRCcytokinesis34/2078173/187236.47e-048.55e-0334
GO:0033108110EsophagusESCCmitochondrial respiratory chain complex assembly83/855293/187239.56e-191.05e-1683
GO:000028115EsophagusESCCmitotic cytokinesis58/855271/187234.34e-101.15e-0858
GO:001700413EsophagusESCCcytochrome complex assembly34/855236/187235.08e-101.31e-0834
GO:000091016EsophagusESCCcytokinesis115/8552173/187232.48e-084.68e-07115
GO:006164015EsophagusESCCcytoskeleton-dependent cytokinesis72/8552100/187238.10e-081.39e-0672
GO:00009106LungIACcytokinesis31/2061173/187234.28e-033.41e-0231
GO:003310818Oral cavityOSCCmitochondrial respiratory chain complex assembly75/730593/187232.17e-161.68e-1475
GO:00170043Oral cavityOSCCcytochrome complex assembly31/730536/187237.28e-091.53e-0731
GO:00002815Oral cavityOSCCmitotic cytokinesis51/730571/187232.01e-083.95e-0751
GO:000091010Oral cavityOSCCcytokinesis97/7305173/187233.82e-064.51e-0597
GO:00616405Oral cavityOSCCcytoskeleton-dependent cytokinesis60/7305100/187231.69e-051.67e-0460
Page: 1 2 3 

check button Enriched KEGG pathways.
Pathway IDTissueDisease StageDescriptionGene RatioBg Ratiopvaluep.adjustqvalueCount
Page: 1 

Top

Cell-cell communication analysis

check buttonIdentification of potential cell-cell interactions between two cell types and their ligand-receptor pairs for different disease states
LigandReceptorLRpairPathwayTissueDisease Stage
Page: 1 

Top

Single-cell gene regulatory network inference analysis

check buttonFind out the significant the regulons (TFs) and the target genes of each regulon across cell types for different disease states
TFCell TypeTissueDisease StageTarget GeneRSSRegulon Activity
∗The dot plots of a searched regulon are shown for all cell subpopulations in each disease state of each tissue based on the regulon specific score inferred using pySCENIC and by calculating the average expression.
Page: 1 

Top

Somatic mutation of malignant transformation related genes

check buttonAnnotation of somatic variants for genes involved in malignant transformation
Hugo SymbolVariant ClassVariant ClassificationdbSNP RSHGVScHGVSpHGVSp ShortSWISSPROTBIOTYPESIFTPolyPhenTumor Sample BarcodeTissueHistologySexAgeStageTherapy TypesDrugsOutcome
TTC19SNVMissense_Mutationrs762239880c.724N>Ap.Ala242Thrp.A242TQ6DKK2protein_codingtolerated(0.21)benign(0.019)TCGA-AN-A046-01Breastbreast invasive carcinomaFemale>=65I/IIUnknownUnknownSD
TTC19insertionIn_Frame_Insnovelc.743_744insATTGATGTGCGGACTCTTAATCTACTTAAAATGTGGp.Leu248_Phe249insLeuMetCysGlyLeuLeuIleTyrLeuLysCysGlyp.L248_F249insLMCGLLIYLKCGQ6DKK2protein_codingTCGA-A8-A08H-01Breastbreast invasive carcinomaFemale>=65I/IIUnknownUnknownSD
TTC19SNVMissense_Mutationnovelc.628N>Cp.Glu210Glnp.E210QQ6DKK2protein_codingdeleterious(0)possibly_damaging(0.845)TCGA-EA-A97N-01Cervixcervical & endocervical cancerFemale<65I/IIUnknownUnknownSD
TTC19SNVMissense_Mutationc.445C>Tp.Arg149Trpp.R149WQ6DKK2protein_codingdeleterious(0)possibly_damaging(0.875)TCGA-AU-6004-01Colorectumcolon adenocarcinomaFemale>=65I/IIUnknownUnknownSD
TTC19SNVMissense_Mutationrs749090956c.370N>Tp.Arg124Cysp.R124CQ6DKK2protein_codingtolerated(0.11)possibly_damaging(0.735)TCGA-F5-6814-01Colorectumrectum adenocarcinomaMale<65I/IIUnknownUnknownSD
TTC19SNVMissense_Mutationnovelc.673N>Cp.Ser225Prop.S225PQ6DKK2protein_codingtolerated(0.38)benign(0.006)TCGA-A5-A1OF-01Endometriumuterine corpus endometrioid carcinomaFemale<65I/IIUnknownUnknownSD
TTC19SNVMissense_Mutationc.1107N>Tp.Lys369Asnp.K369NQ6DKK2protein_codingtolerated(0.19)benign(0.03)TCGA-A5-A2K5-01Endometriumuterine corpus endometrioid carcinomaFemale>=65I/IIUnknownUnknownSD
TTC19SNVMissense_Mutationrs759404597c.376N>Ap.Ala126Thrp.A126TQ6DKK2protein_codingdeleterious(0)possibly_damaging(0.836)TCGA-AJ-A3EL-01Endometriumuterine corpus endometrioid carcinomaFemale<65I/IIUnknownUnknownSD
TTC19SNVMissense_Mutationrs797046058c.478N>Cp.Lys160Glnp.K160QQ6DKK2protein_codingdeleterious(0)probably_damaging(0.959)TCGA-AP-A1E0-01Endometriumuterine corpus endometrioid carcinomaFemale<65III/IVChemotherapypaclitaxelSD
TTC19SNVMissense_Mutationrs749090956c.370N>Tp.Arg124Cysp.R124CQ6DKK2protein_codingtolerated(0.11)possibly_damaging(0.735)TCGA-B5-A1MR-01Endometriumuterine corpus endometrioid carcinomaFemale>=65III/IVUnknownUnknownSD
Page: 1 2 3 

Top

Related drugs of malignant transformation related genes

check buttonIdentification of chemicals and drugs interact with genes involved in malignant transfromation
(DGIdb 4.0)
Entrez IDSymbolCategoryInteraction TypesDrug Claim NameDrug NamePMIDs
Page: 1