
|
|||||
|
 | |
| |
| |
| |
| |
| |
|
Gene: TTC14 |
Gene summary for TTC14 |
| Gene information | Species | Human | Gene symbol | TTC14 | Gene ID | 151613 |
| Gene name | tetratricopeptide repeat domain 14 | |
| Gene Alias | DRDL5813 | |
| Cytomap | 3q26.33 | |
| Gene Type | protein-coding | GO ID | GO:0003674 | UniProtAcc | Q69YS0 |
Top |
Malignant transformation analysis |
| Identification of the aberrant gene expression in precancerous and cancerous lesions by comparing the gene expression of stem-like cells in diseased tissues with normal stem cells |
| Entrez ID | Symbol | Replicates | Species | Organ | Tissue | Adj P-value | Log2FC | Malignancy |
| 151613 | TTC14 | LZE2D | Human | Esophagus | HGIN | 7.87e-03 | 7.22e-01 | 0.0642 |
| 151613 | TTC14 | LZE2T | Human | Esophagus | ESCC | 8.84e-10 | 8.86e-01 | 0.082 |
| 151613 | TTC14 | LZE4T | Human | Esophagus | ESCC | 7.02e-08 | 2.27e-01 | 0.0811 |
| 151613 | TTC14 | LZE5T | Human | Esophagus | ESCC | 2.24e-04 | 2.37e-01 | 0.0514 |
| 151613 | TTC14 | LZE7T | Human | Esophagus | ESCC | 6.14e-11 | 5.06e-01 | 0.0667 |
| 151613 | TTC14 | LZE8T | Human | Esophagus | ESCC | 3.88e-06 | 2.32e-01 | 0.067 |
| 151613 | TTC14 | LZE20T | Human | Esophagus | ESCC | 3.21e-06 | 2.89e-01 | 0.0662 |
| 151613 | TTC14 | LZE22D1 | Human | Esophagus | HGIN | 6.13e-05 | 3.17e-01 | 0.0595 |
| 151613 | TTC14 | LZE22T | Human | Esophagus | ESCC | 2.47e-02 | 1.79e-01 | 0.068 |
| 151613 | TTC14 | LZE24T | Human | Esophagus | ESCC | 4.16e-26 | 5.81e-01 | 0.0596 |
| 151613 | TTC14 | LZE21T | Human | Esophagus | ESCC | 8.83e-08 | 5.04e-01 | 0.0655 |
| 151613 | TTC14 | LZE6T | Human | Esophagus | ESCC | 2.55e-10 | 3.67e-01 | 0.0845 |
| 151613 | TTC14 | P1T-E | Human | Esophagus | ESCC | 2.53e-13 | 5.85e-01 | 0.0875 |
| 151613 | TTC14 | P2T-E | Human | Esophagus | ESCC | 4.60e-27 | 5.95e-01 | 0.1177 |
| 151613 | TTC14 | P4T-E | Human | Esophagus | ESCC | 8.06e-33 | 7.16e-01 | 0.1323 |
| 151613 | TTC14 | P5T-E | Human | Esophagus | ESCC | 8.28e-24 | 5.41e-01 | 0.1327 |
| 151613 | TTC14 | P8T-E | Human | Esophagus | ESCC | 7.80e-33 | 7.25e-01 | 0.0889 |
| 151613 | TTC14 | P9T-E | Human | Esophagus | ESCC | 2.55e-20 | 5.14e-01 | 0.1131 |
| 151613 | TTC14 | P10T-E | Human | Esophagus | ESCC | 1.20e-48 | 8.60e-01 | 0.116 |
| 151613 | TTC14 | P11T-E | Human | Esophagus | ESCC | 1.94e-17 | 7.84e-01 | 0.1426 |
| Page: 1 2 3 4 5 6 |
| Tissue | Expression Dynamics | Abbreviation |
| Esophagus | 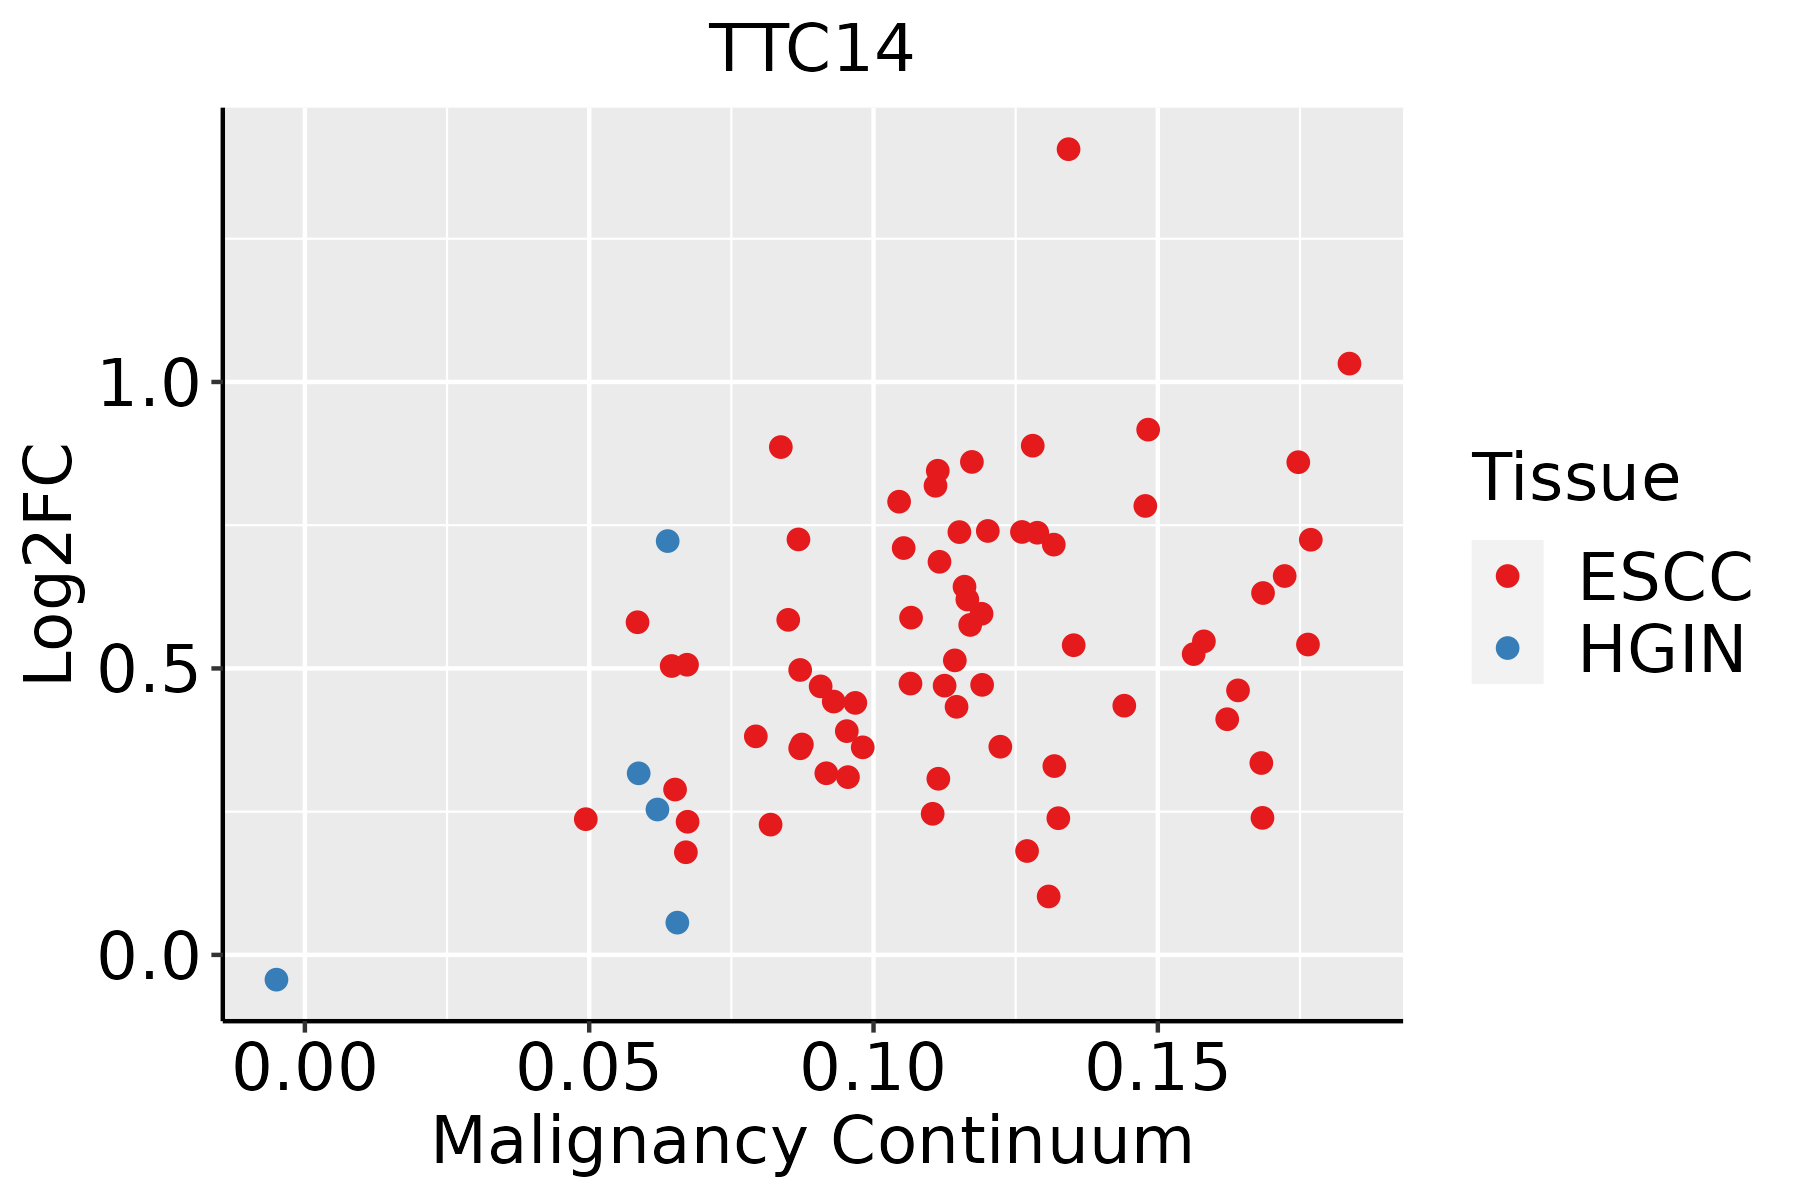 | ESCC: Esophageal squamous cell carcinoma |
| HGIN: High-grade intraepithelial neoplasias | ||
| LGIN: Low-grade intraepithelial neoplasias | ||
| Liver |  | HCC: Hepatocellular carcinoma |
| NAFLD: Non-alcoholic fatty liver disease | ||
| Lung |  | AAH: Atypical adenomatous hyperplasia |
| AIS: Adenocarcinoma in situ | ||
| IAC: Invasive lung adenocarcinoma | ||
| MIA: Minimally invasive adenocarcinoma | ||
| Oral Cavity | 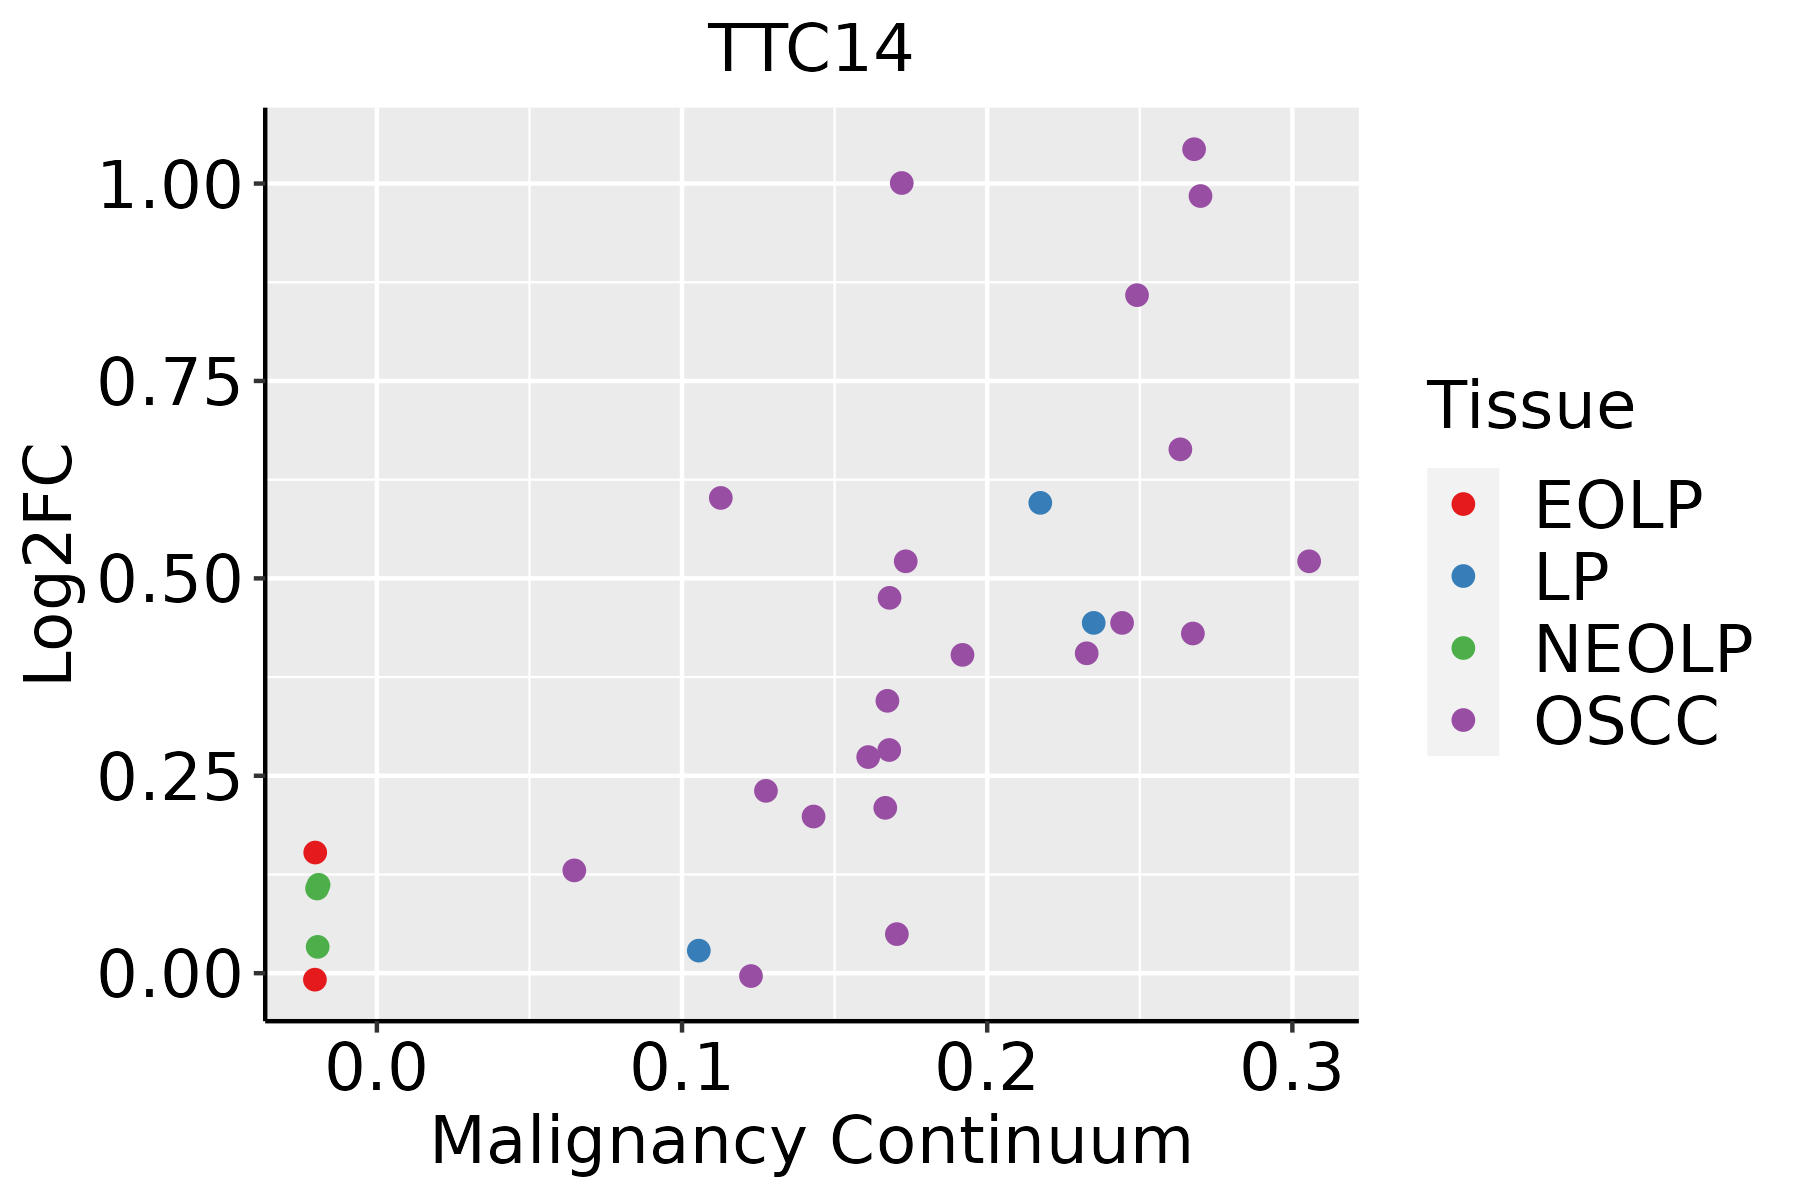 | EOLP: Erosive Oral lichen planus |
| LP: leukoplakia | ||
| NEOLP: Non-erosive oral lichen planus | ||
| OSCC: Oral squamous cell carcinoma | ||
| Prostate | 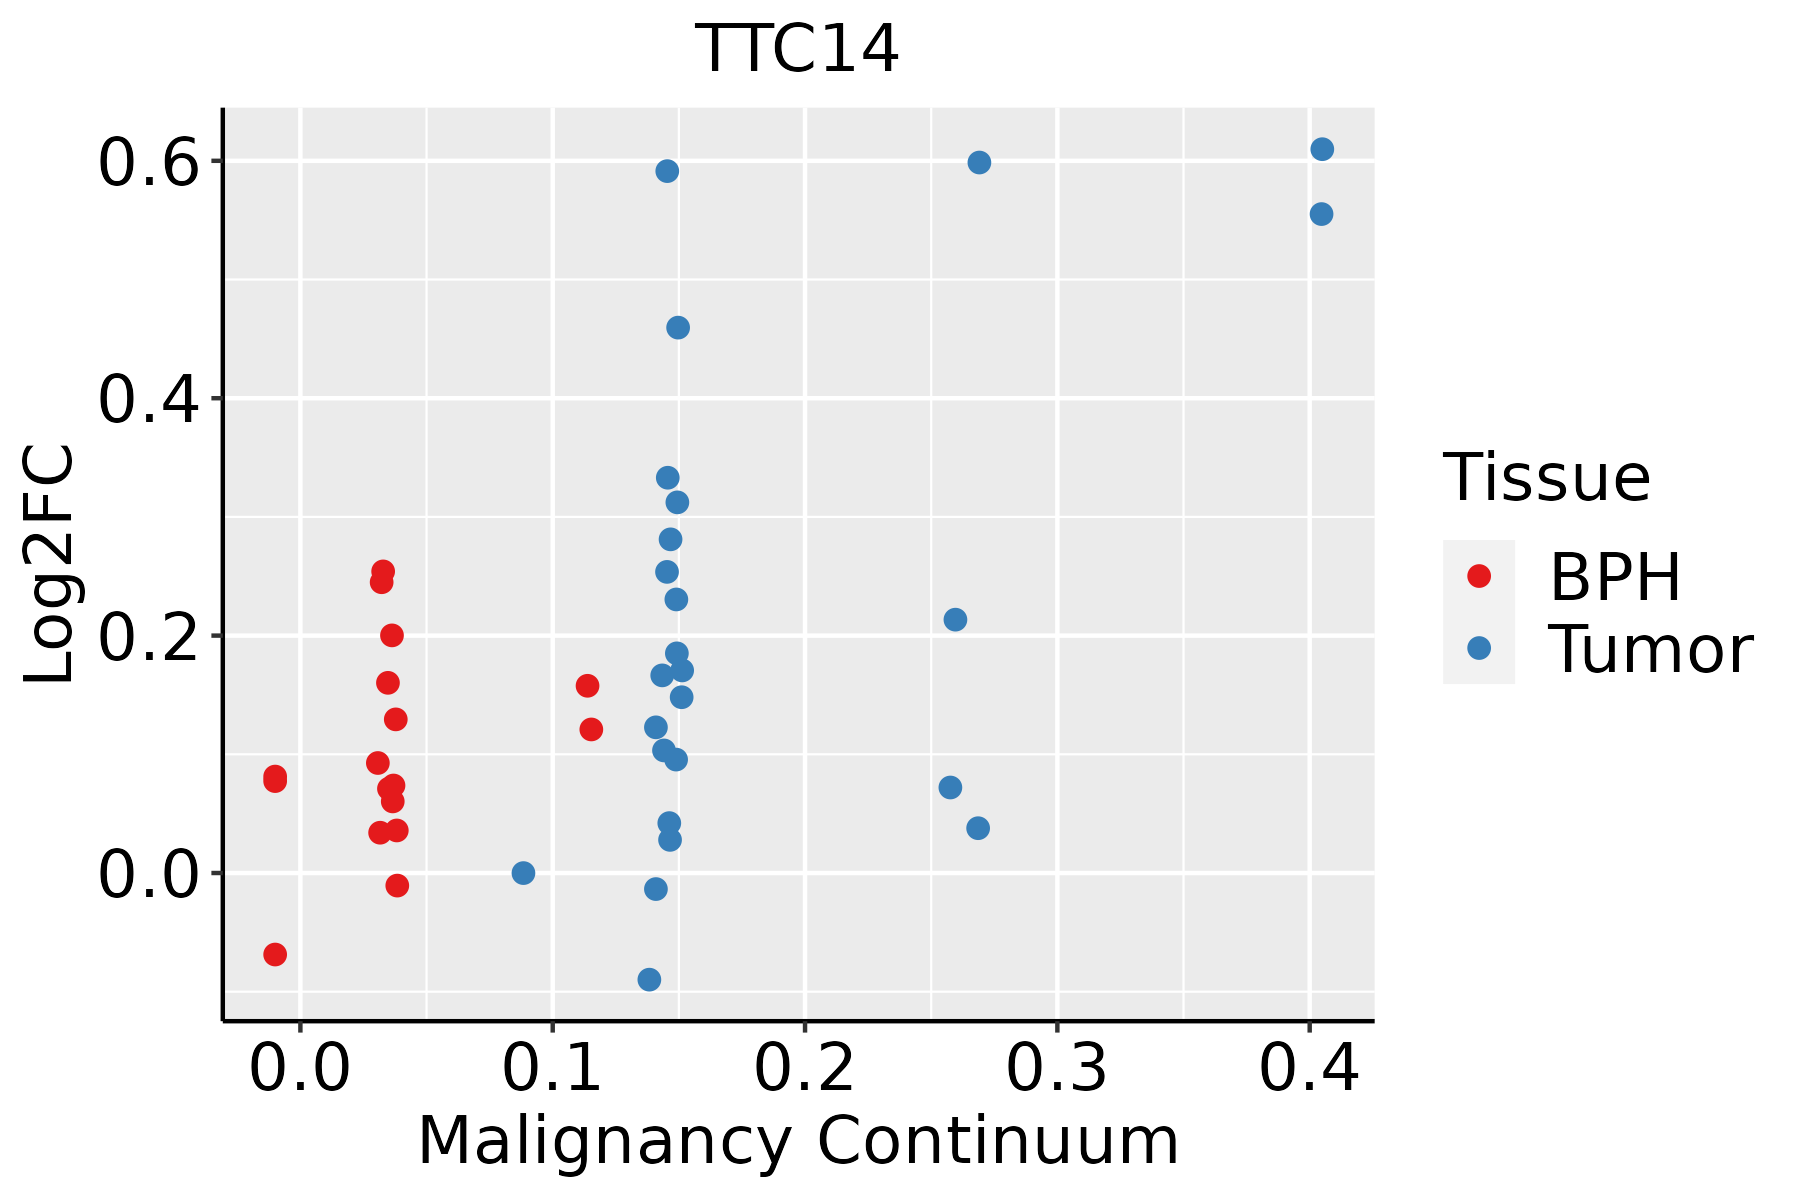 | BPH: Benign Prostatic Hyperplasia |
| Thyroid | 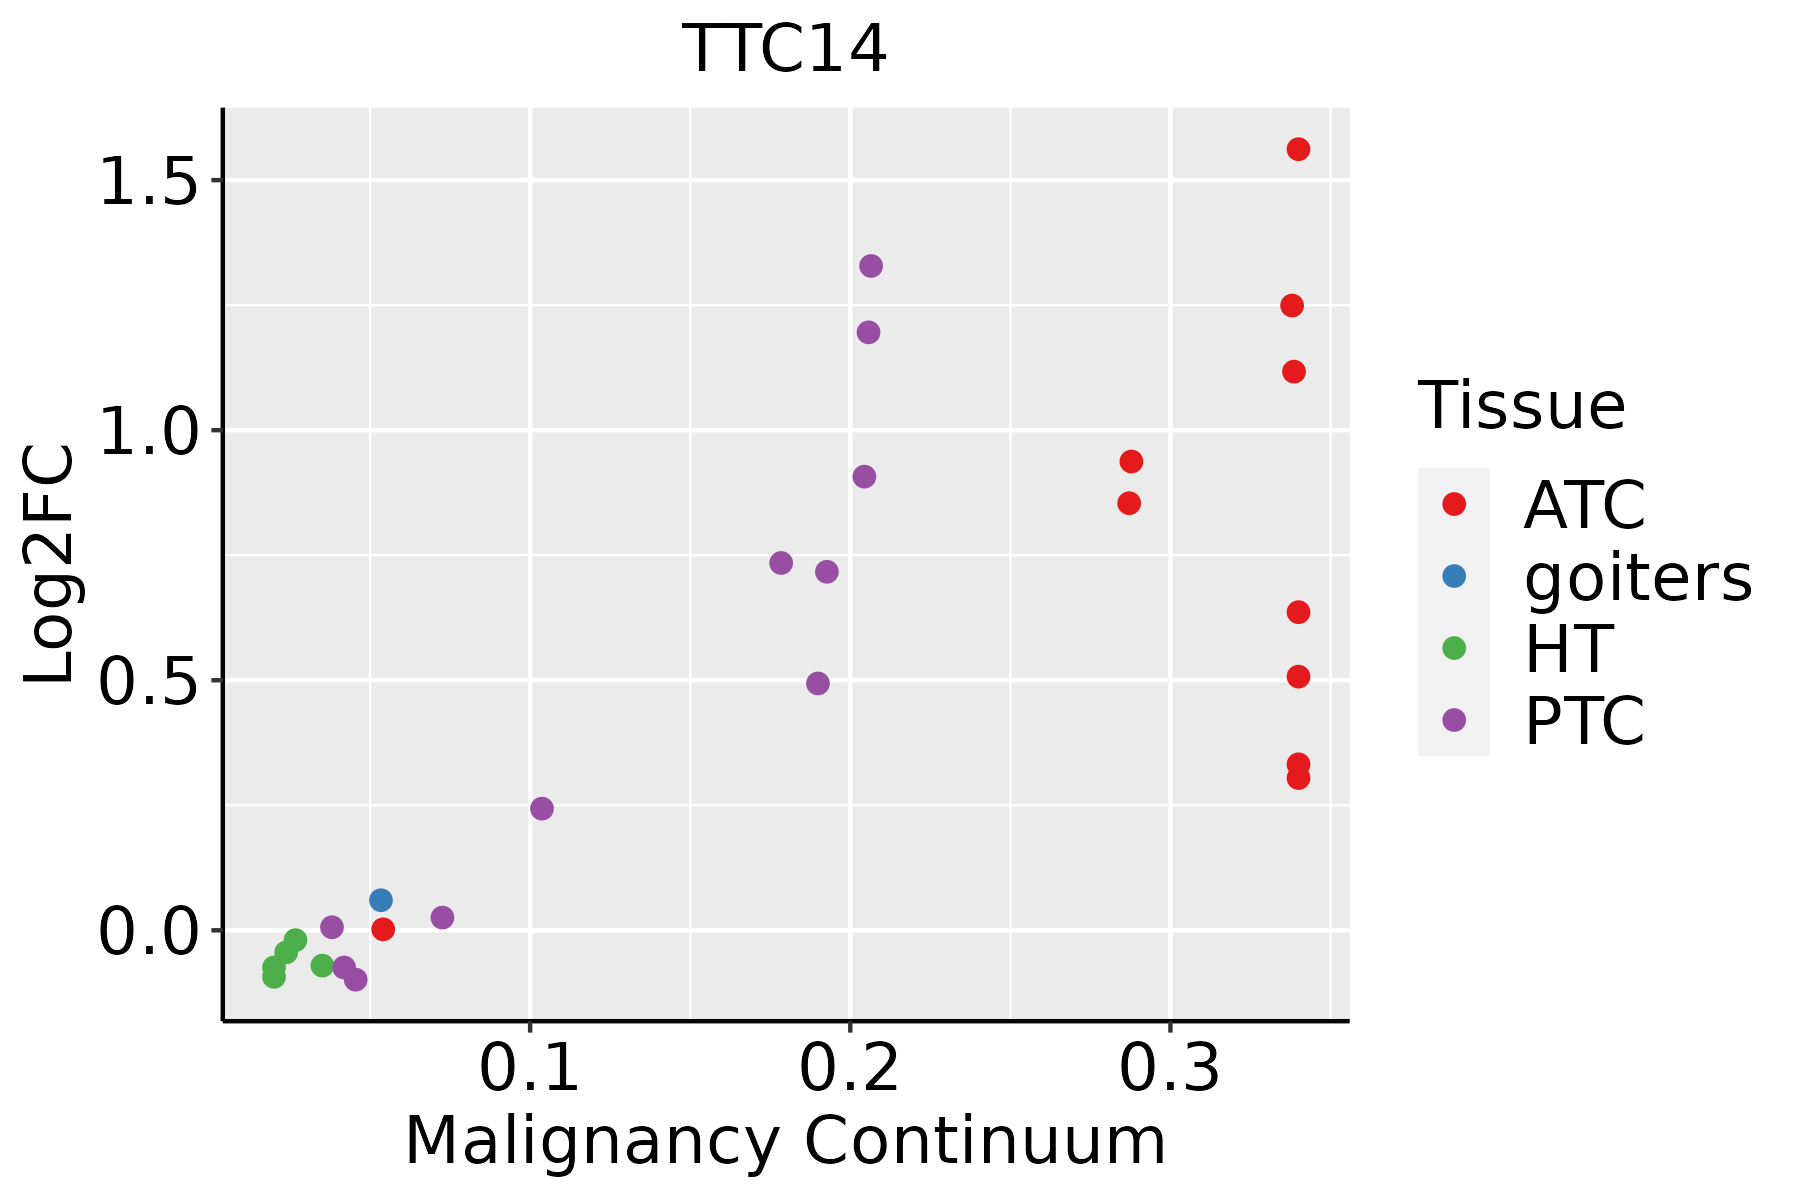 | ATC: Anaplastic thyroid cancer |
| HT: Hashimoto's thyroiditis | ||
| PTC: Papillary thyroid cancer |
| ∗log2FC in expression of this searched gene in stem-like cells from each diseased tissue sample relative to stem-like cells in normal samples in each tissue plotted against the malignancy continuum. Samples are colored based on if they are from different disease stage. |
Top |
Malignant transformation related pathway analysis |
| Find out the enriched GO biological processes and KEGG pathways involved in transition from healthy to precancer to cancer |
| Tissue | Disease Stage | Enriched GO biological Processes |
| Colorectum | AD |  |
| Colorectum | SER |  |
| Colorectum | MSS |  |
| Colorectum | MSI-H |  |
| Colorectum | FAP |  |
| ∗Top 15 enriched GO BP terms are showed in the bar plot of each disease state in each tissue. Each row represents a significant GO biological process which is colored according to the -log10(p.adjust). |
| Page: 1 2 3 4 5 6 7 8 9 |
| GO ID | Tissue | Disease Stage | Description | Gene Ratio | Bg Ratio | pvalue | p.adjust | Count |
| Page: 1 |
| Pathway ID | Tissue | Disease Stage | Description | Gene Ratio | Bg Ratio | pvalue | p.adjust | qvalue | Count |
| Page: 1 |
Top |
Cell-cell communication analysis |
| Identification of potential cell-cell interactions between two cell types and their ligand-receptor pairs for different disease states |
| Ligand | Receptor | LRpair | Pathway | Tissue | Disease Stage |
| Page: 1 |
Top |
Single-cell gene regulatory network inference analysis |
| Find out the significant the regulons (TFs) and the target genes of each regulon across cell types for different disease states |
| TF | Cell Type | Tissue | Disease Stage | Target Gene | RSS | Regulon Activity |
| ∗The dot plots of a searched regulon are shown for all cell subpopulations in each disease state of each tissue based on the regulon specific score inferred using pySCENIC and by calculating the average expression. |
| Page: 1 |
Top |
Somatic mutation of malignant transformation related genes |
| Annotation of somatic variants for genes involved in malignant transformation |
| Hugo Symbol | Variant Class | Variant Classification | dbSNP RS | HGVSc | HGVSp | HGVSp Short | SWISSPROT | BIOTYPE | SIFT | PolyPhen | Tumor Sample Barcode | Tissue | Histology | Sex | Age | Stage | Therapy Types | Drugs | Outcome |
| TTC14 | SNV | Missense_Mutation | c.419G>T | p.Gly140Val | p.G140V | Q96N46 | protein_coding | deleterious(0) | probably_damaging(0.999) | TCGA-A8-A09B-01 | Breast | breast invasive carcinoma | Female | <65 | III/IV | Chemotherapy | 5-fluorouracil | SD | |
| TTC14 | SNV | Missense_Mutation | c.1829N>A | p.Ser610Asn | p.S610N | Q96N46 | protein_coding | deleterious_low_confidence(0.02) | possibly_damaging(0.866) | TCGA-AN-A0AJ-01 | Breast | breast invasive carcinoma | Female | >=65 | I/II | Unknown | Unknown | SD | |
| TTC14 | SNV | Missense_Mutation | c.704G>A | p.Arg235Lys | p.R235K | Q96N46 | protein_coding | tolerated(0.18) | benign(0.007) | TCGA-AN-A0FT-01 | Breast | breast invasive carcinoma | Female | <65 | I/II | Unknown | Unknown | SD | |
| TTC14 | SNV | Missense_Mutation | c.2166N>G | p.Ile722Met | p.I722M | Q96N46 | protein_coding | tolerated_low_confidence(0.26) | possibly_damaging(0.713) | TCGA-E2-A1IH-01 | Breast | breast invasive carcinoma | Female | >=65 | I/II | Hormone Therapy | aromasin | SD | |
| TTC14 | SNV | Missense_Mutation | c.944N>C | p.Val315Ala | p.V315A | Q96N46 | protein_coding | deleterious(0) | possibly_damaging(0.847) | TCGA-EW-A1P7-01 | Breast | breast invasive carcinoma | Female | <65 | I/II | Chemotherapy | carboplatin | PD | |
| TTC14 | SNV | Missense_Mutation | novel | c.13N>T | p.Leu5Phe | p.L5F | Q96N46 | protein_coding | deleterious(0.01) | probably_damaging(0.996) | TCGA-S3-AA17-01 | Breast | breast invasive carcinoma | Female | <65 | I/II | Hormone Therapy | anastrozole | SD |
| TTC14 | SNV | Missense_Mutation | c.1262N>G | p.Ala421Gly | p.A421G | Q96N46 | protein_coding | deleterious(0.04) | possibly_damaging(0.505) | TCGA-A6-6138-01 | Colorectum | colon adenocarcinoma | Male | <65 | I/II | Unknown | Unknown | SD | |
| TTC14 | SNV | Missense_Mutation | c.170N>T | p.Lys57Met | p.K57M | Q96N46 | protein_coding | deleterious(0.02) | benign(0.015) | TCGA-AA-3833-01 | Colorectum | colon adenocarcinoma | Female | <65 | I/II | Unknown | Unknown | SD | |
| TTC14 | SNV | Missense_Mutation | novel | c.1751T>A | p.Leu584His | p.L584H | Q96N46 | protein_coding | tolerated_low_confidence(0.21) | possibly_damaging(0.845) | TCGA-AA-3950-01 | Colorectum | colon adenocarcinoma | Female | >=65 | I/II | Unknown | Unknown | SD |
| TTC14 | SNV | Missense_Mutation | rs150698778 | c.2065G>A | p.Ala689Thr | p.A689T | Q96N46 | protein_coding | tolerated_low_confidence(0.72) | benign(0.022) | TCGA-AA-3976-01 | Colorectum | colon adenocarcinoma | Male | >=65 | III/IV | Chemotherapy | folinic | CR |
| Page: 1 2 3 4 5 6 7 8 9 10 11 12 |
Top |
Related drugs of malignant transformation related genes |
| Identification of chemicals and drugs interact with genes involved in malignant transfromation |
| (DGIdb 4.0) |
| Entrez ID | Symbol | Category | Interaction Types | Drug Claim Name | Drug Name | PMIDs |
| Page: 1 |

Copyright 2023-Present -The University of Texas Health Science Center at Houston |