Schematic overview of the cellular and molecular mechanisms involved in the cancer progression, including the proposed cellular and molecular mechanisms in cancer cells trajectory. AT1: alveolar type 1 cells; AT2: alveolar type 2 cells; AAH: atypical adenomatous hyperplasia; AIS: adenocarcinoma in situ; MIA: minimally invasive adenocarcinoma; IA: invasive adenocarcinoma; EMT: epithelial-mesenchymal transition

Home

Download

Statistics

Help

Contact

Center for Computational Systems Medicine
leaf

Gene summary

leaf

Malignant transformation analysis

leaf

Malignant transformation related pathway analysis

leaf

Cell-cell communication analysis

leaf

Single-cell gene regulatory network inference analysis

leaf

Somatic mutation of malignant transformation related genes

leaf

Related drugs of malignant transformation related genes

Gene: TTC1

Gene summary for TTC1

check button Gene summary.

Gene informationSpeciesHuman
Gene symbol

TTC1

Gene ID

7265

Gene nametetratricopeptide repeat domain 1
Gene AliasTPR1
Cytomap5q33.3
Gene Typeprotein-coding
GO ID

GO:0006457

UniProtAcc

Q99614


Top

Malignant transformation analysis

check button Identification of the aberrant gene expression in precancerous and cancerous lesions by comparing the gene expression of stem-like cells in diseased tissues with normal stem cells
check button Malignant transformation involving gene list.
Entrez IDSymbolReplicatesSpeciesOrganTissueAdj P-valueLog2FCMalignancy
7265TTC1HTA11_1938_2000001011HumanColorectumAD3.11e-024.16e-01-0.0811
7265TTC1HTA11_347_2000001011HumanColorectumAD1.71e-135.78e-01-0.1954
7265TTC1A002-C-010HumanColorectumFAP3.82e-02-1.37e-010.242
7265TTC1A015-C-203HumanColorectumFAP2.31e-08-2.41e-01-0.1294
7265TTC1A002-C-201HumanColorectumFAP2.86e-04-2.06e-010.0324
7265TTC1A001-C-108HumanColorectumFAP4.78e-03-1.69e-01-0.0272
7265TTC1A002-C-205HumanColorectumFAP4.40e-08-1.98e-01-0.1236
7265TTC1A015-C-006HumanColorectumFAP3.76e-04-2.41e-01-0.0994
7265TTC1A015-C-106HumanColorectumFAP8.34e-06-1.65e-01-0.0511
7265TTC1A002-C-114HumanColorectumFAP1.26e-06-2.62e-01-0.1561
7265TTC1A015-C-104HumanColorectumFAP3.76e-07-2.47e-01-0.1899
7265TTC1A001-C-014HumanColorectumFAP3.32e-05-1.95e-010.0135
7265TTC1A002-C-016HumanColorectumFAP7.98e-13-2.42e-010.0521
7265TTC1A015-C-002HumanColorectumFAP1.31e-04-2.65e-01-0.0763
7265TTC1A001-C-203HumanColorectumFAP6.81e-05-1.23e-01-0.0481
7265TTC1A002-C-116HumanColorectumFAP5.82e-13-2.46e-01-0.0452
7265TTC1A014-C-008HumanColorectumFAP3.30e-04-2.46e-01-0.191
7265TTC1A018-E-020HumanColorectumFAP1.28e-06-1.92e-01-0.2034
7265TTC1F034HumanColorectumFAP2.99e-07-1.86e-01-0.0665
7265TTC1F072BHumanColorectumFAP2.20e-02-1.50e-010.257
Page: 1 2 3 4 5 6 7 8 

check button Transcriptomic changes along malignancy continuum.
TissueExpression DynamicsAbbreviation
Colorectum (GSE201348)The image shows the transcriptomic changes along malignancy continuum.log2FC in expression of this searched gene in stem-like cells from each diseased tissue sample relative to stem-like cells in normal samples in each tissue plotted against the malignancy continuum. Samples are colored based on if they are from different disease stage.FAP: Familial adenomatous polyposis
CRC: Colorectal cancer
Colorectum (HTA11)The image shows the transcriptomic changes along malignancy continuum.log2FC in expression of this searched gene in stem-like cells from each diseased tissue sample relative to stem-like cells in normal samples in each tissue plotted against the malignancy continuum. Samples are colored based on if they are from different disease stage.AD: Adenomas
SER: Sessile serrated lesions
MSI-H: Microsatellite-high colorectal cancer
MSS: Microsatellite stable colorectal cancer
EsophagusThe image shows the transcriptomic changes along malignancy continuum.log2FC in expression of this searched gene in stem-like cells from each diseased tissue sample relative to stem-like cells in normal samples in each tissue plotted against the malignancy continuum. Samples are colored based on if they are from different disease stage.
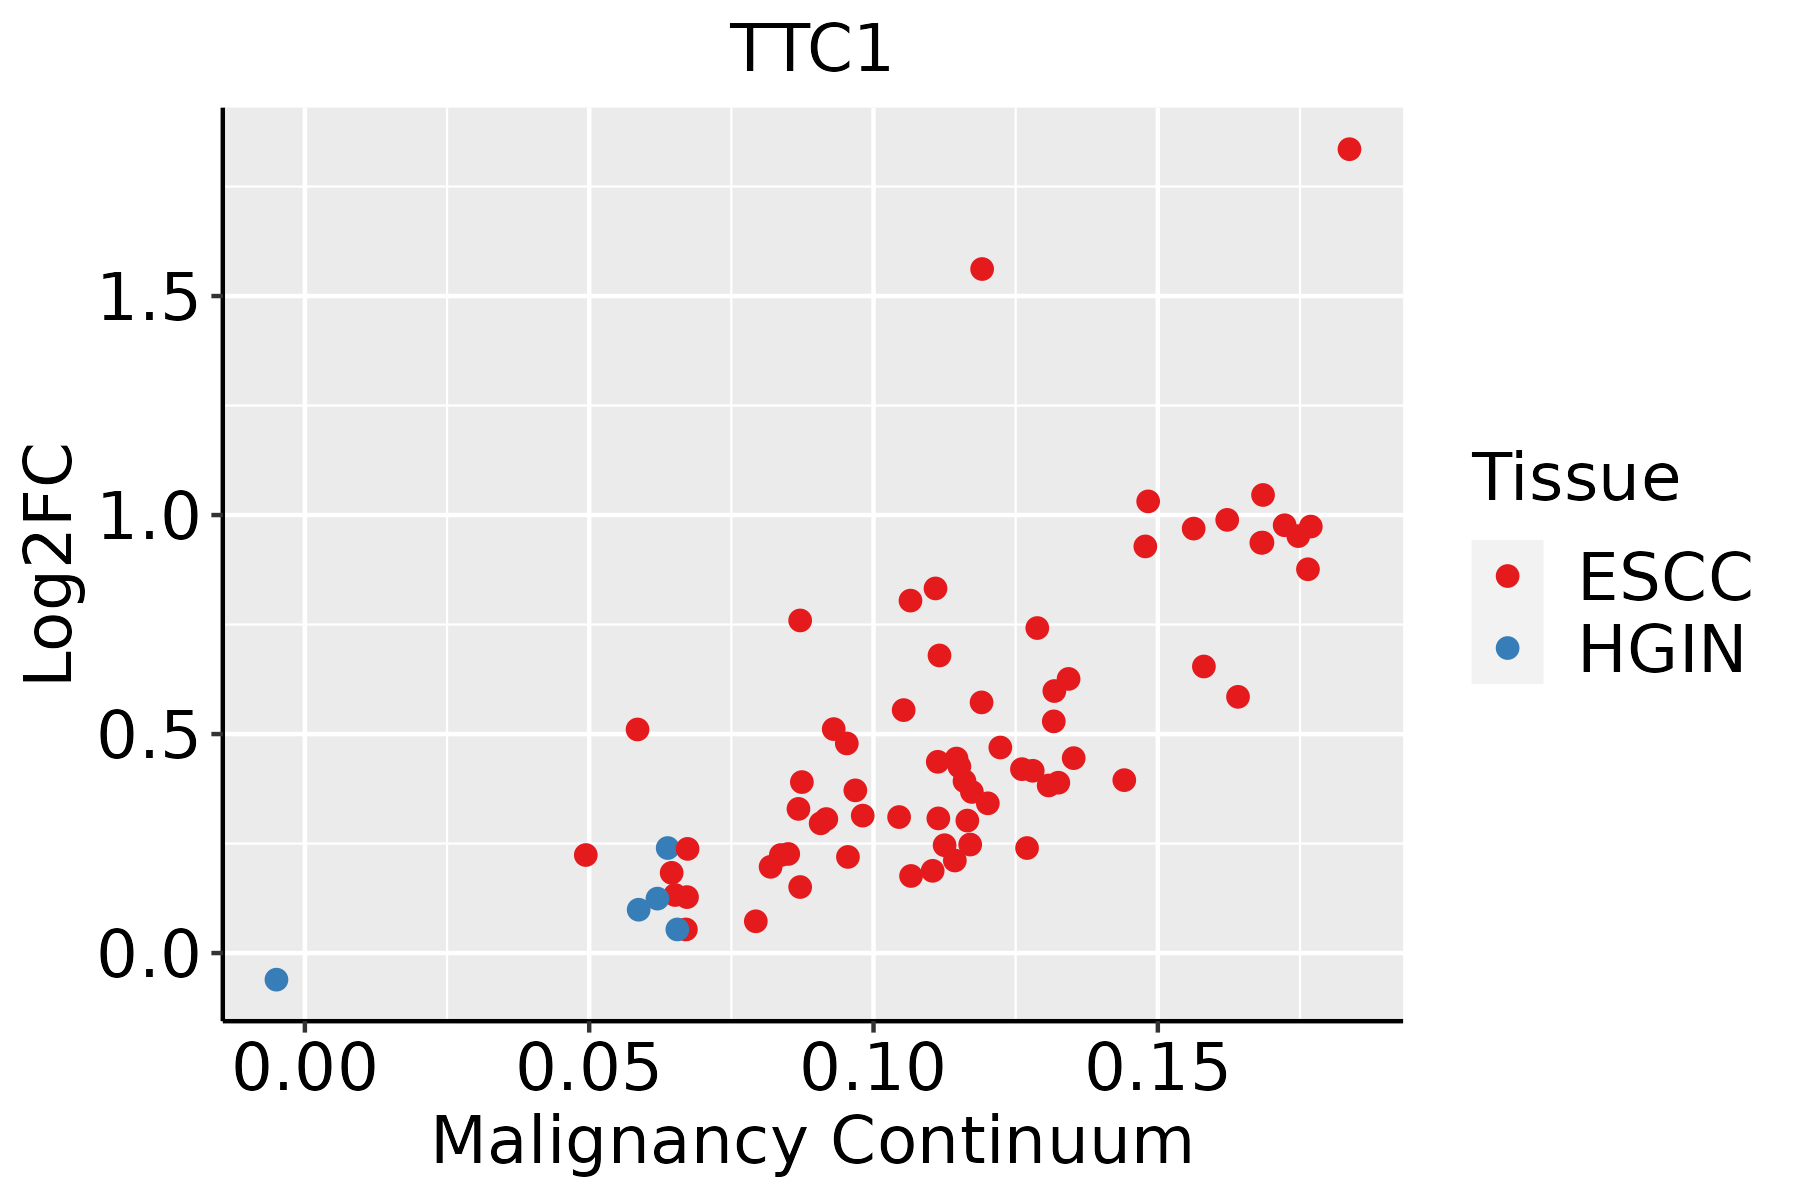
ESCC: Esophageal squamous cell carcinoma
HGIN: High-grade intraepithelial neoplasias
LGIN: Low-grade intraepithelial neoplasias
LiverThe image shows the transcriptomic changes along malignancy continuum.log2FC in expression of this searched gene in stem-like cells from each diseased tissue sample relative to stem-like cells in normal samples in each tissue plotted against the malignancy continuum. Samples are colored based on if they are from different disease stage.
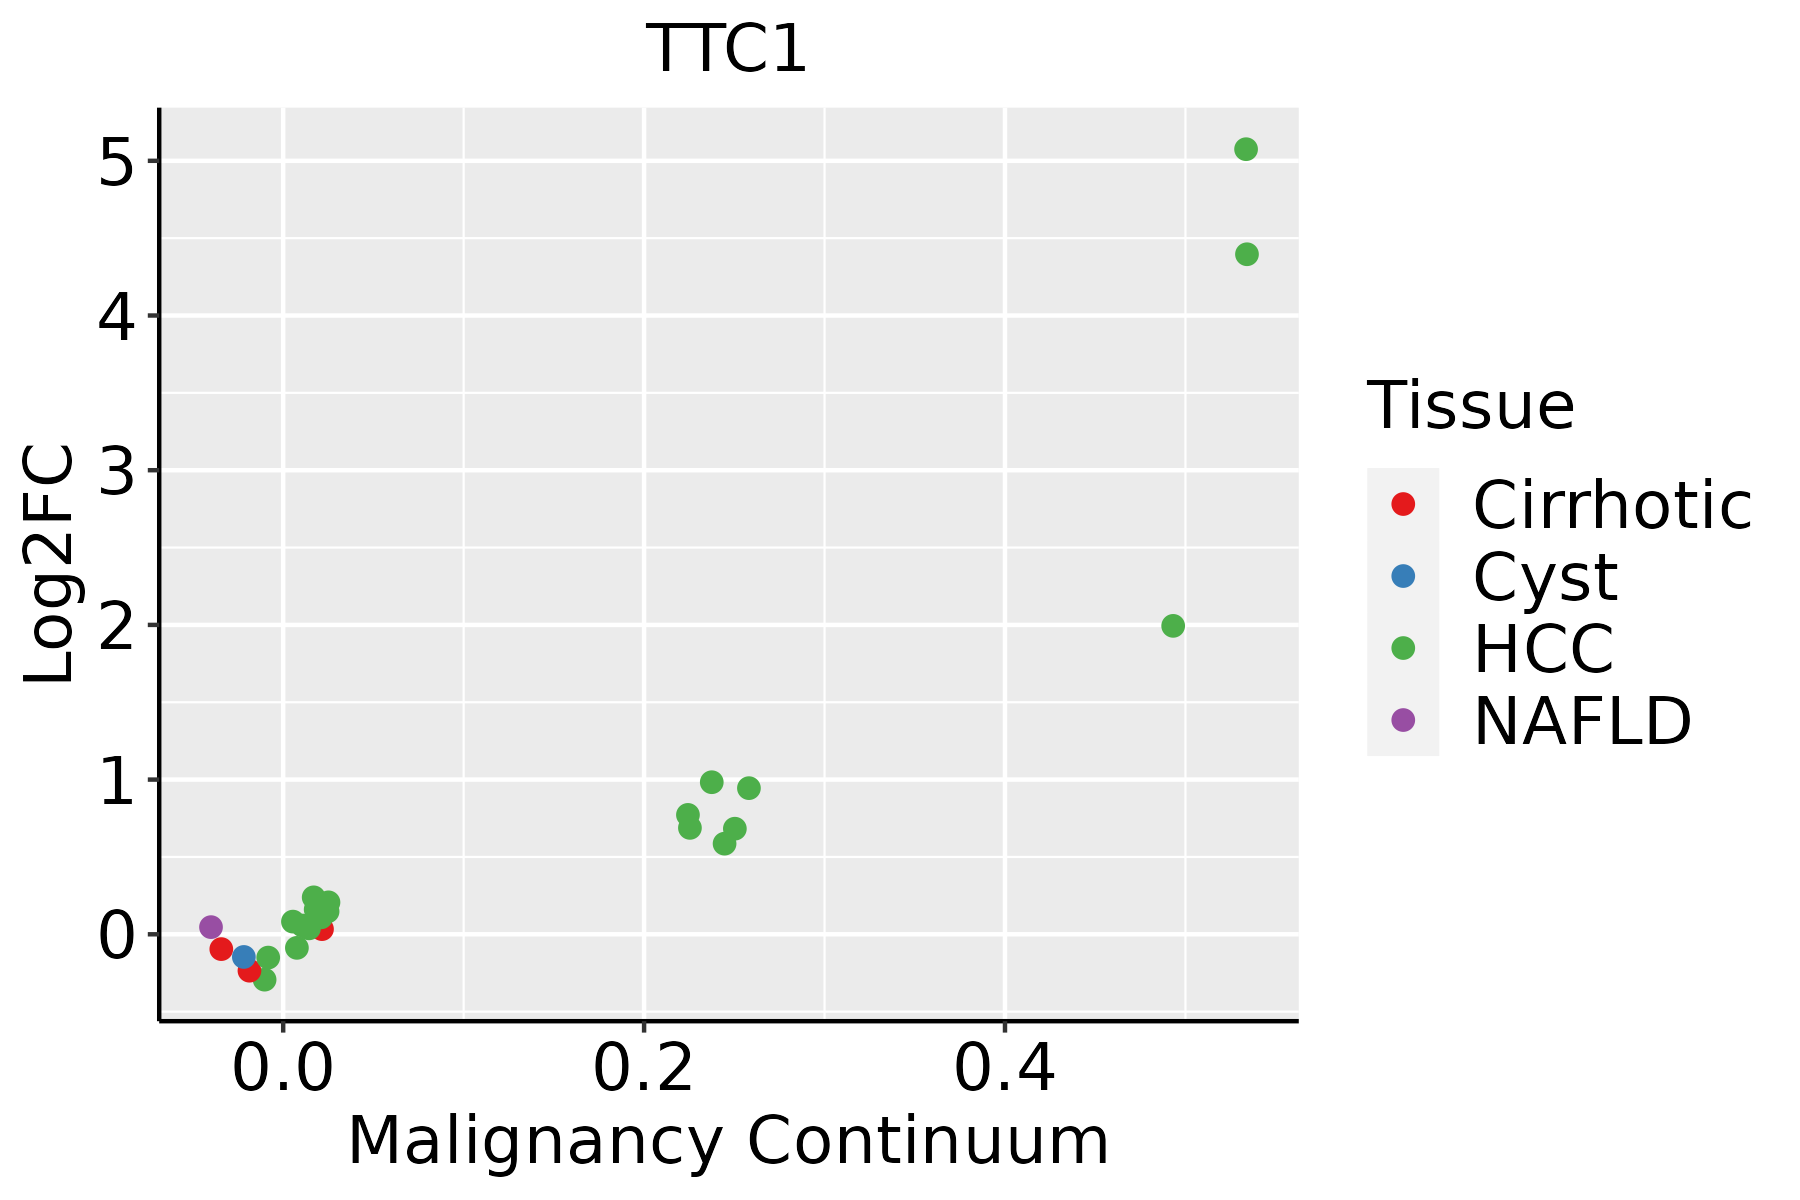
HCC: Hepatocellular carcinoma
NAFLD: Non-alcoholic fatty liver disease
Oral CavityThe image shows the transcriptomic changes along malignancy continuum.log2FC in expression of this searched gene in stem-like cells from each diseased tissue sample relative to stem-like cells in normal samples in each tissue plotted against the malignancy continuum. Samples are colored based on if they are from different disease stage.EOLP: Erosive Oral lichen planus
LP: leukoplakia
NEOLP: Non-erosive oral lichen planus
OSCC: Oral squamous cell carcinoma
SkinThe image shows the transcriptomic changes along malignancy continuum.log2FC in expression of this searched gene in stem-like cells from each diseased tissue sample relative to stem-like cells in normal samples in each tissue plotted against the malignancy continuum. Samples are colored based on if they are from different disease stage.
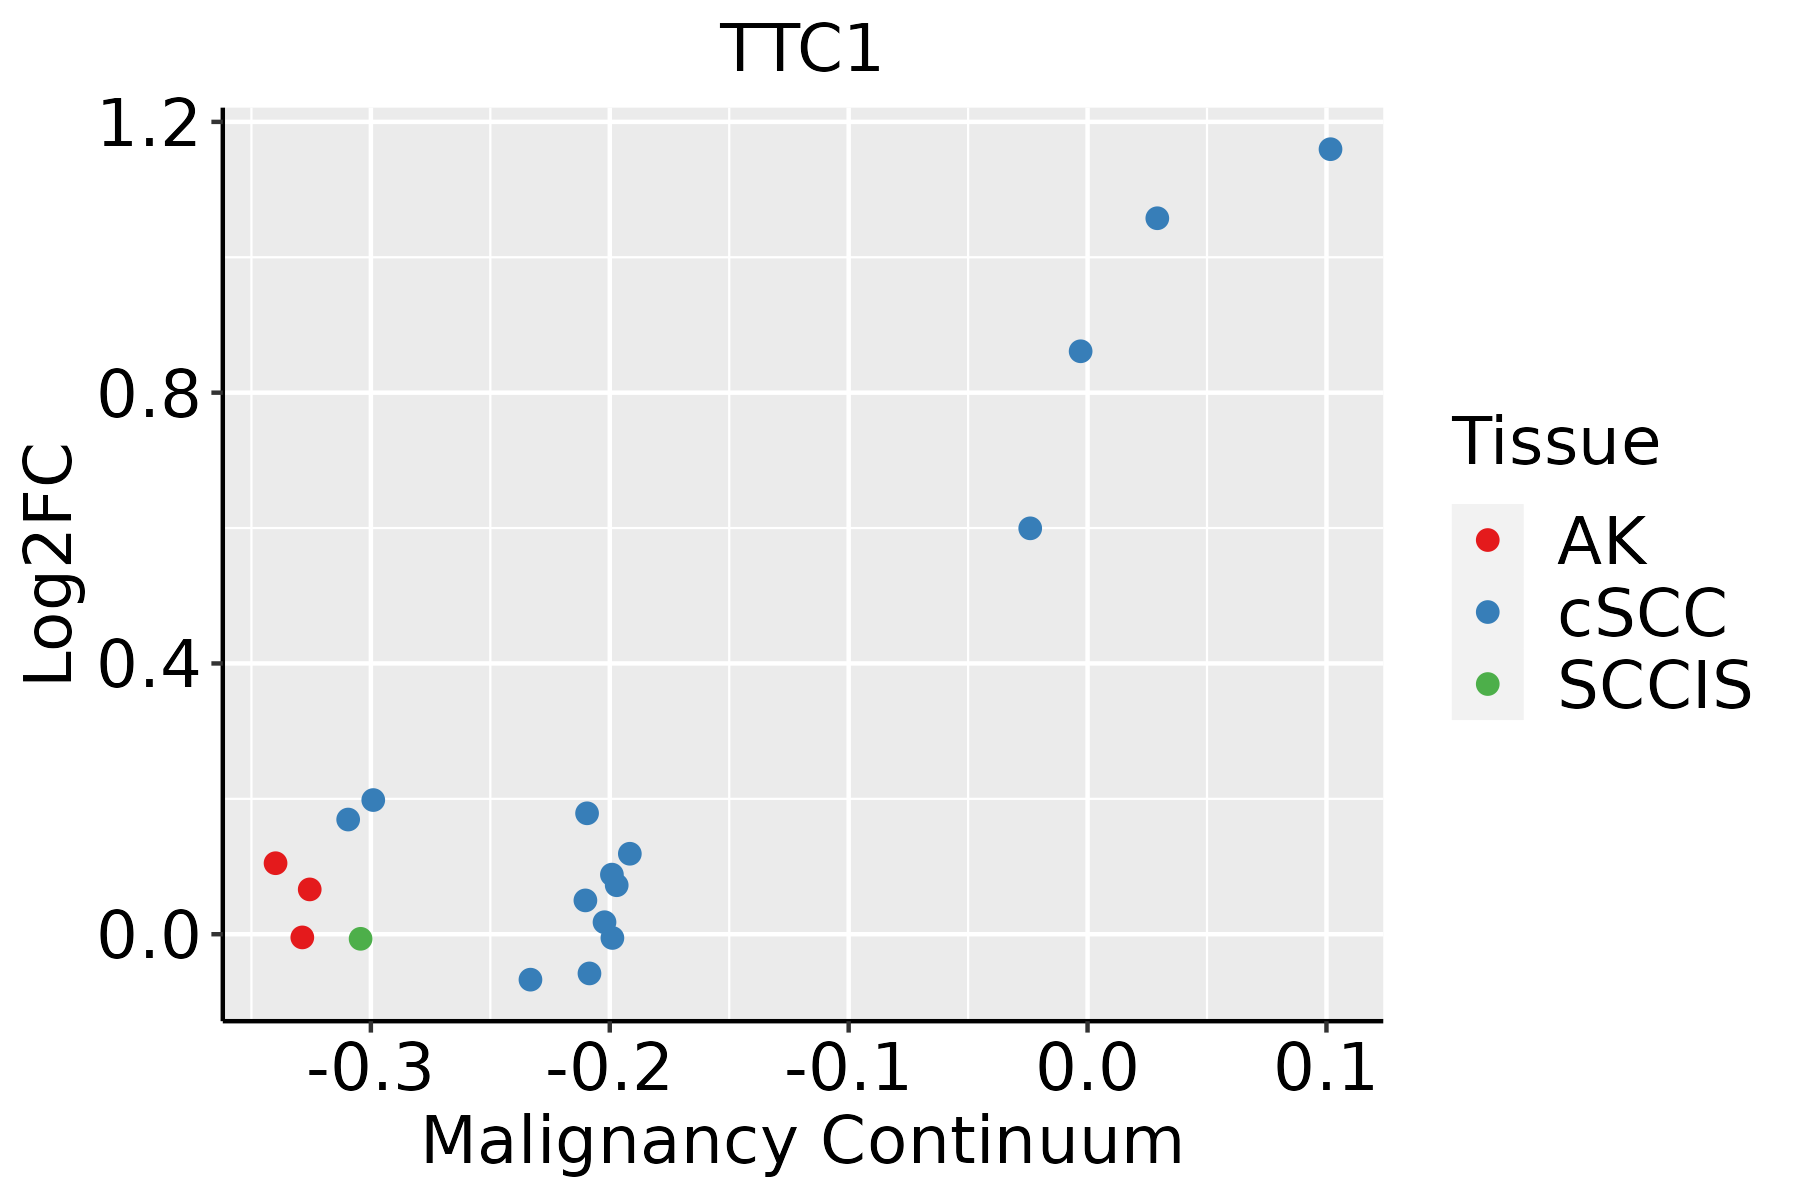
AK: Actinic keratosis
cSCC: Cutaneous squamous cell carcinoma
SCCIS:squamous cell carcinoma in situ
ThyroidThe image shows the transcriptomic changes along malignancy continuum.log2FC in expression of this searched gene in stem-like cells from each diseased tissue sample relative to stem-like cells in normal samples in each tissue plotted against the malignancy continuum. Samples are colored based on if they are from different disease stage.ATC: Anaplastic thyroid cancer
HT: Hashimoto's thyroiditis
PTC: Papillary thyroid cancer
∗log2FC in expression of this searched gene in stem-like cells from each diseased tissue sample relative to stem-like cells in normal samples in each tissue plotted against the malignancy continuum. Samples are colored based on if they are from different disease stage.

Top

Malignant transformation related pathway analysis

check buttonFind out the enriched GO biological processes and KEGG pathways involved in transition from healthy to precancer to cancer
check button Figure of enriched GO biological processes.
TissueDisease StageEnriched GO biological Processes
ColorectumADGO analysis - Figure of enriched GO biological processes: Top 15 enriched GO BP terms are showed in the bar plot of each disease state in each tissue. Each row represents a significant GO biological process which is colored according to the -log10(p.adjust).
ColorectumSERGO analysis - Figure of enriched GO biological processes: Top 15 enriched GO BP terms are showed in the bar plot of each disease state in each tissue. Each row represents a significant GO biological process which is colored according to the -log10(p.adjust).
ColorectumMSSGO analysis - Figure of enriched GO biological processes: Top 15 enriched GO BP terms are showed in the bar plot of each disease state in each tissue. Each row represents a significant GO biological process which is colored according to the -log10(p.adjust).
ColorectumMSI-HGO analysis - Figure of enriched GO biological processes: Top 15 enriched GO BP terms are showed in the bar plot of each disease state in each tissue. Each row represents a significant GO biological process which is colored according to the -log10(p.adjust).
ColorectumFAPGO analysis - Figure of enriched GO biological processes: Top 15 enriched GO BP terms are showed in the bar plot of each disease state in each tissue. Each row represents a significant GO biological process which is colored according to the -log10(p.adjust).
∗Top 15 enriched GO BP terms are showed in the bar plot of each disease state in each tissue. Each row represents a significant GO biological process which is colored according to the -log10(p.adjust).
Page: 1 2 3 4 5 6 7 8 9 

check button Enriched GO biological processes.
GO IDTissueDisease StageDescriptionGene RatioBg Ratiopvaluep.adjustCount
GO:000701510CervixCCactin filament organization109/2311442/187234.92e-132.45e-10109
GO:005125810CervixCCprotein polymerization70/2311297/187235.20e-083.11e-0670
GO:00081549CervixCCactin polymerization or depolymerization51/2311218/187234.05e-061.05e-0451
GO:00300419CervixCCactin filament polymerization45/2311191/187231.20e-052.54e-0445
GO:0007015ColorectumADactin filament organization167/3918442/187231.65e-167.94e-14167
GO:0008154ColorectumADactin polymerization or depolymerization90/3918218/187236.14e-128.23e-1090
GO:0030041ColorectumADactin filament polymerization81/3918191/187231.35e-111.69e-0981
GO:0051258ColorectumADprotein polymerization112/3918297/187231.85e-112.27e-09112
GO:0033108ColorectumADmitochondrial respiratory chain complex assembly46/391893/187238.95e-106.91e-0846
GO:0006457ColorectumADprotein folding73/3918212/187233.24e-069.10e-0573
GO:0000910ColorectumADcytokinesis59/3918173/187233.74e-056.75e-0459
GO:0061640ColorectumADcytoskeleton-dependent cytokinesis37/3918100/187231.58e-042.20e-0337
GO:0000281ColorectumADmitotic cytokinesis25/391871/187233.77e-032.65e-0225
GO:00070151ColorectumSERactin filament organization134/2897442/187231.39e-155.70e-13134
GO:00081541ColorectumSERactin polymerization or depolymerization77/2897218/187233.50e-131.19e-1077
GO:00300411ColorectumSERactin filament polymerization70/2897191/187235.39e-131.65e-1070
GO:00512581ColorectumSERprotein polymerization91/2897297/187232.72e-115.06e-0991
GO:00070152ColorectumMSSactin filament organization146/3467442/187231.16e-132.67e-11146
GO:00331082ColorectumMSSmitochondrial respiratory chain complex assembly44/346793/187232.17e-102.09e-0844
GO:00081542ColorectumMSSactin polymerization or depolymerization79/3467218/187234.14e-103.49e-0879
Page: 1 2 3 4 5 6 7 8 

check button Enriched KEGG pathways.
Pathway IDTissueDisease StageDescriptionGene RatioBg Ratiopvaluep.adjustqvalueCount
Page: 1 

Top

Cell-cell communication analysis

check buttonIdentification of potential cell-cell interactions between two cell types and their ligand-receptor pairs for different disease states
LigandReceptorLRpairPathwayTissueDisease Stage
Page: 1 

Top

Single-cell gene regulatory network inference analysis

check buttonFind out the significant the regulons (TFs) and the target genes of each regulon across cell types for different disease states
TFCell TypeTissueDisease StageTarget GeneRSSRegulon Activity
∗The dot plots of a searched regulon are shown for all cell subpopulations in each disease state of each tissue based on the regulon specific score inferred using pySCENIC and by calculating the average expression.
Page: 1 

Top

Somatic mutation of malignant transformation related genes

check buttonAnnotation of somatic variants for genes involved in malignant transformation
Hugo SymbolVariant ClassVariant ClassificationdbSNP RSHGVScHGVSpHGVSp ShortSWISSPROTBIOTYPESIFTPolyPhenTumor Sample BarcodeTissueHistologySexAgeStageTherapy TypesDrugsOutcome
TTC1SNVMissense_Mutationrs368905325c.430N>Ap.Glu144Lysp.E144KQ99614protein_codingtolerated(0.38)benign(0.006)TCGA-AN-A046-01Breastbreast invasive carcinomaFemale>=65I/IIUnknownUnknownSD
TTC1SNVMissense_Mutationc.852C>Ap.Phe284Leup.F284LQ99614protein_codingdeleterious(0)probably_damaging(0.952)TCGA-AG-A002-01Colorectumrectum adenocarcinomaMale<65I/IIUnknownUnknownSD
TTC1SNVMissense_Mutationnovelc.137T>Cp.Leu46Prop.L46PQ99614protein_codingtolerated_low_confidence(0.16)benign(0)TCGA-A5-A1OF-01Endometriumuterine corpus endometrioid carcinomaFemale<65I/IIUnknownUnknownSD
TTC1SNVMissense_Mutationnovelc.824C>Ap.Ser275Tyrp.S275YQ99614protein_codingdeleterious(0)possibly_damaging(0.854)TCGA-A5-A1OF-01Endometriumuterine corpus endometrioid carcinomaFemale<65I/IIUnknownUnknownSD
TTC1SNVMissense_Mutationrs535766239c.464C>Tp.Ser155Leup.S155LQ99614protein_codingdeleterious(0.03)possibly_damaging(0.821)TCGA-AP-A0LM-01Endometriumuterine corpus endometrioid carcinomaFemale<65III/IVChemotherapycisplatinSD
TTC1SNVMissense_Mutationnovelc.101N>Ap.Pro34Hisp.P34HQ99614protein_codingtolerated_low_confidence(0.1)benign(0.319)TCGA-AX-A1CE-01Endometriumuterine corpus endometrioid carcinomaFemale<65I/IIUnspecificPaclitaxelSD
TTC1SNVMissense_Mutationc.658N>Ap.Pro220Thrp.P220TQ99614protein_codingdeleterious(0)probably_damaging(0.996)TCGA-AX-A1CE-01Endometriumuterine corpus endometrioid carcinomaFemale<65I/IIUnspecificPaclitaxelSD
TTC1SNVMissense_Mutationnovelc.569N>Tp.Arg190Metp.R190MQ99614protein_codingdeleterious(0)probably_damaging(0.994)TCGA-B5-A1MX-01Endometriumuterine corpus endometrioid carcinomaFemale<65I/IIHormone TherapymegaceSD
TTC1SNVMissense_Mutationrs751310634c.422G>Ap.Arg141Glnp.R141QQ99614protein_codingtolerated(0.95)benign(0.003)TCGA-B5-A3FA-01Endometriumuterine corpus endometrioid carcinomaFemale>=65I/IIUnknownUnknownSD
TTC1SNVMissense_Mutationnovelc.324N>Tp.Glu108Aspp.E108DQ99614protein_codingdeleterious(0.05)benign(0.346)TCGA-E6-A1LX-01Endometriumuterine corpus endometrioid carcinomaFemale<65I/IIUnknownUnknownSD
Page: 1 2 3 

Top

Related drugs of malignant transformation related genes

check buttonIdentification of chemicals and drugs interact with genes involved in malignant transfromation
(DGIdb 4.0)
Entrez IDSymbolCategoryInteraction TypesDrug Claim NameDrug NamePMIDs
Page: 1