
|
|||||
|
 | |
| |
| |
| |
| |
| |
|
Gene: TTBK2 |
Gene summary for TTBK2 |
| Gene information | Species | Human | Gene symbol | TTBK2 | Gene ID | 146057 |
| Gene name | tau tubulin kinase 2 | |
| Gene Alias | SCA11 | |
| Cytomap | 15q15.2 | |
| Gene Type | protein-coding | GO ID | GO:0000226 | UniProtAcc | Q6IQ55 |
Top |
Malignant transformation analysis |
| Identification of the aberrant gene expression in precancerous and cancerous lesions by comparing the gene expression of stem-like cells in diseased tissues with normal stem cells |
| Entrez ID | Symbol | Replicates | Species | Organ | Tissue | Adj P-value | Log2FC | Malignancy |
| 146057 | TTBK2 | LZE4T | Human | Esophagus | ESCC | 5.96e-09 | 3.10e-01 | 0.0811 |
| 146057 | TTBK2 | LZE24T | Human | Esophagus | ESCC | 1.29e-07 | 1.73e-01 | 0.0596 |
| 146057 | TTBK2 | P1T-E | Human | Esophagus | ESCC | 1.91e-02 | 1.32e-01 | 0.0875 |
| 146057 | TTBK2 | P2T-E | Human | Esophagus | ESCC | 4.35e-13 | 1.69e-01 | 0.1177 |
| 146057 | TTBK2 | P4T-E | Human | Esophagus | ESCC | 2.41e-11 | 2.75e-01 | 0.1323 |
| 146057 | TTBK2 | P5T-E | Human | Esophagus | ESCC | 1.15e-15 | 3.23e-01 | 0.1327 |
| 146057 | TTBK2 | P8T-E | Human | Esophagus | ESCC | 2.62e-16 | 1.81e-01 | 0.0889 |
| 146057 | TTBK2 | P9T-E | Human | Esophagus | ESCC | 1.18e-08 | 2.07e-01 | 0.1131 |
| 146057 | TTBK2 | P10T-E | Human | Esophagus | ESCC | 5.93e-20 | 2.45e-01 | 0.116 |
| 146057 | TTBK2 | P11T-E | Human | Esophagus | ESCC | 9.53e-07 | 2.41e-01 | 0.1426 |
| 146057 | TTBK2 | P12T-E | Human | Esophagus | ESCC | 1.26e-11 | 3.09e-01 | 0.1122 |
| 146057 | TTBK2 | P15T-E | Human | Esophagus | ESCC | 1.67e-11 | 2.37e-01 | 0.1149 |
| 146057 | TTBK2 | P16T-E | Human | Esophagus | ESCC | 1.06e-09 | 1.21e-01 | 0.1153 |
| 146057 | TTBK2 | P20T-E | Human | Esophagus | ESCC | 4.87e-03 | 8.73e-02 | 0.1124 |
| 146057 | TTBK2 | P21T-E | Human | Esophagus | ESCC | 3.10e-10 | 1.35e-01 | 0.1617 |
| 146057 | TTBK2 | P22T-E | Human | Esophagus | ESCC | 6.69e-16 | 2.19e-01 | 0.1236 |
| 146057 | TTBK2 | P23T-E | Human | Esophagus | ESCC | 6.93e-08 | 1.47e-01 | 0.108 |
| 146057 | TTBK2 | P24T-E | Human | Esophagus | ESCC | 6.07e-07 | 7.68e-02 | 0.1287 |
| 146057 | TTBK2 | P26T-E | Human | Esophagus | ESCC | 2.14e-23 | 4.30e-01 | 0.1276 |
| 146057 | TTBK2 | P27T-E | Human | Esophagus | ESCC | 7.16e-15 | 2.24e-01 | 0.1055 |
| Page: 1 2 3 |
| Tissue | Expression Dynamics | Abbreviation |
| Esophagus | 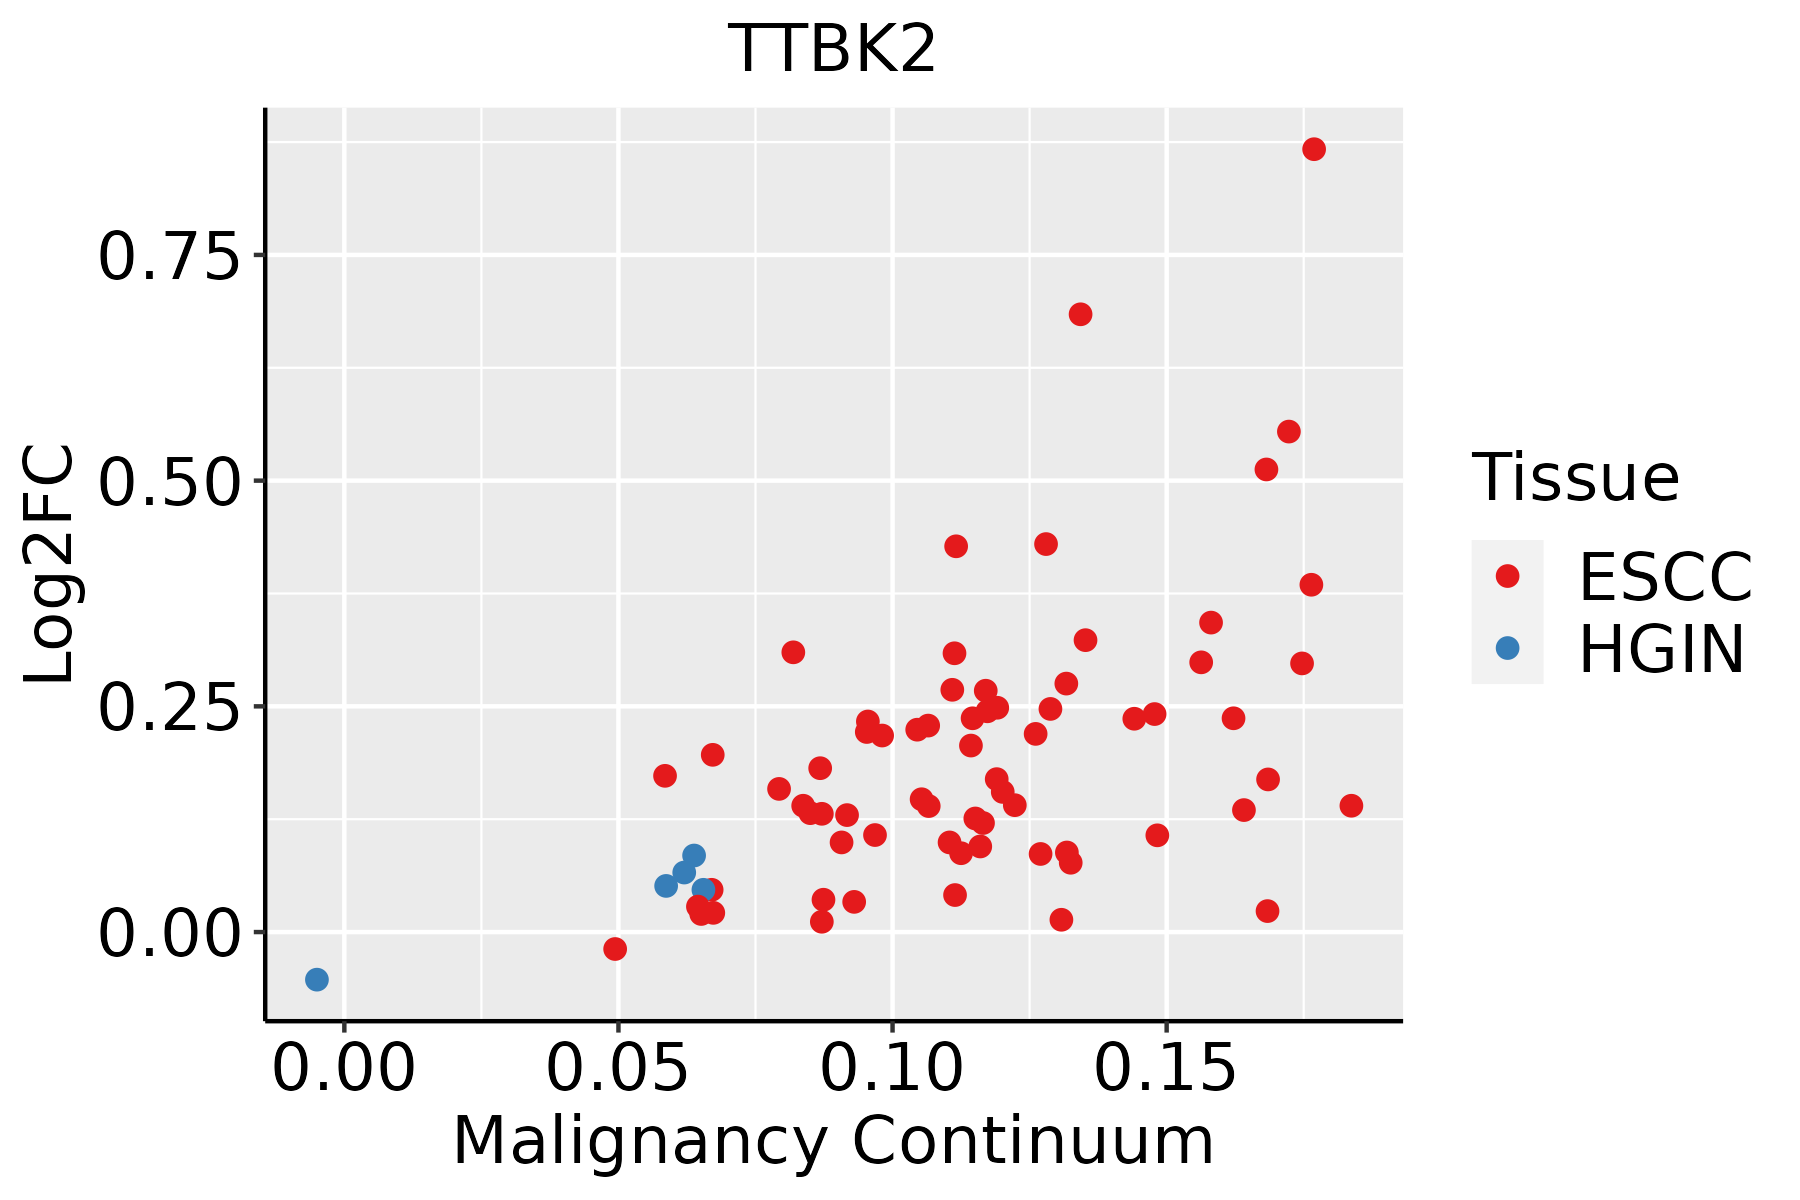 | ESCC: Esophageal squamous cell carcinoma |
| HGIN: High-grade intraepithelial neoplasias | ||
| LGIN: Low-grade intraepithelial neoplasias |
| ∗log2FC in expression of this searched gene in stem-like cells from each diseased tissue sample relative to stem-like cells in normal samples in each tissue plotted against the malignancy continuum. Samples are colored based on if they are from different disease stage. |
Top |
Malignant transformation related pathway analysis |
| Find out the enriched GO biological processes and KEGG pathways involved in transition from healthy to precancer to cancer |
| Tissue | Disease Stage | Enriched GO biological Processes |
| Colorectum | AD |  |
| Colorectum | SER |  |
| Colorectum | MSS |  |
| Colorectum | MSI-H |  |
| Colorectum | FAP |  |
| ∗Top 15 enriched GO BP terms are showed in the bar plot of each disease state in each tissue. Each row represents a significant GO biological process which is colored according to the -log10(p.adjust). |
| Page: 1 2 3 4 5 6 7 8 9 |
| GO ID | Tissue | Disease Stage | Description | Gene Ratio | Bg Ratio | pvalue | p.adjust | Count |
| GO:0022411111 | Esophagus | ESCC | cellular component disassembly | 305/8552 | 443/18723 | 1.94e-23 | 4.57e-21 | 305 |
| GO:0051098111 | Esophagus | ESCC | regulation of binding | 251/8552 | 363/18723 | 6.73e-20 | 8.46e-18 | 251 |
| GO:003298416 | Esophagus | ESCC | protein-containing complex disassembly | 151/8552 | 224/18723 | 3.45e-11 | 1.15e-09 | 151 |
| GO:004339320 | Esophagus | ESCC | regulation of protein binding | 135/8552 | 196/18723 | 3.69e-11 | 1.22e-09 | 135 |
| GO:1902903111 | Esophagus | ESCC | regulation of supramolecular fiber organization | 237/8552 | 383/18723 | 9.06e-11 | 2.75e-09 | 237 |
| GO:0010639110 | Esophagus | ESCC | negative regulation of organelle organization | 215/8552 | 348/18723 | 8.20e-10 | 2.01e-08 | 215 |
| GO:0051100111 | Esophagus | ESCC | negative regulation of binding | 109/8552 | 162/18723 | 2.10e-08 | 4.03e-07 | 109 |
| GO:00705078 | Esophagus | ESCC | regulation of microtubule cytoskeleton organization | 99/8552 | 148/18723 | 1.43e-07 | 2.29e-06 | 99 |
| GO:00726985 | Esophagus | ESCC | protein localization to microtubule cytoskeleton | 43/8552 | 54/18723 | 3.28e-07 | 4.61e-06 | 43 |
| GO:00443804 | Esophagus | ESCC | protein localization to cytoskeleton | 45/8552 | 58/18723 | 6.89e-07 | 8.99e-06 | 45 |
| GO:00182099 | Esophagus | ESCC | peptidyl-serine modification | 196/8552 | 338/18723 | 3.07e-06 | 3.47e-05 | 196 |
| GO:001810515 | Esophagus | ESCC | peptidyl-serine phosphorylation | 184/8552 | 315/18723 | 3.22e-06 | 3.61e-05 | 184 |
| GO:003209116 | Esophagus | ESCC | negative regulation of protein binding | 65/8552 | 94/18723 | 3.46e-06 | 3.82e-05 | 65 |
| GO:19038289 | Esophagus | ESCC | negative regulation of cellular protein localization | 76/8552 | 117/18723 | 1.97e-05 | 1.72e-04 | 76 |
| GO:00311094 | Esophagus | ESCC | microtubule polymerization or depolymerization | 77/8552 | 122/18723 | 7.60e-05 | 5.68e-04 | 77 |
| GO:00432446 | Esophagus | ESCC | regulation of protein-containing complex disassembly | 75/8552 | 121/18723 | 2.17e-04 | 1.36e-03 | 75 |
| GO:00311104 | Esophagus | ESCC | regulation of microtubule polymerization or depolymerization | 57/8552 | 88/18723 | 2.32e-04 | 1.44e-03 | 57 |
| GO:00328864 | Esophagus | ESCC | regulation of microtubule-based process | 134/8552 | 240/18723 | 9.44e-04 | 4.80e-03 | 134 |
| GO:0035372 | Esophagus | ESCC | protein localization to microtubule | 15/8552 | 18/18723 | 1.20e-03 | 5.88e-03 | 15 |
| GO:00436245 | Esophagus | ESCC | cellular protein complex disassembly | 78/8552 | 136/18723 | 4.00e-03 | 1.62e-02 | 78 |
| Page: 1 |
| Pathway ID | Tissue | Disease Stage | Description | Gene Ratio | Bg Ratio | pvalue | p.adjust | qvalue | Count |
| Page: 1 |
Top |
Cell-cell communication analysis |
| Identification of potential cell-cell interactions between two cell types and their ligand-receptor pairs for different disease states |
| Ligand | Receptor | LRpair | Pathway | Tissue | Disease Stage |
| Page: 1 |
Top |
Single-cell gene regulatory network inference analysis |
| Find out the significant the regulons (TFs) and the target genes of each regulon across cell types for different disease states |
| TF | Cell Type | Tissue | Disease Stage | Target Gene | RSS | Regulon Activity |
| ∗The dot plots of a searched regulon are shown for all cell subpopulations in each disease state of each tissue based on the regulon specific score inferred using pySCENIC and by calculating the average expression. |
| Page: 1 |
Top |
Somatic mutation of malignant transformation related genes |
| Annotation of somatic variants for genes involved in malignant transformation |
| Hugo Symbol | Variant Class | Variant Classification | dbSNP RS | HGVSc | HGVSp | HGVSp Short | SWISSPROT | BIOTYPE | SIFT | PolyPhen | Tumor Sample Barcode | Tissue | Histology | Sex | Age | Stage | Therapy Types | Drugs | Outcome |
| TTBK2 | SNV | Missense_Mutation | rs200437800 | c.3484N>T | p.Arg1162Cys | p.R1162C | Q6IQ55 | protein_coding | deleterious_low_confidence(0) | probably_damaging(0.925) | TCGA-5L-AAT0-01 | Breast | breast invasive carcinoma | Female | <65 | I/II | Hormone Therapy | tamoxiphen | SD |
| TTBK2 | SNV | Missense_Mutation | rs375008079 | c.3209C>T | p.Ser1070Leu | p.S1070L | Q6IQ55 | protein_coding | deleterious(0) | benign(0.023) | TCGA-AN-A046-01 | Breast | breast invasive carcinoma | Female | >=65 | I/II | Unknown | Unknown | SD |
| TTBK2 | SNV | Missense_Mutation | novel | c.3529G>C | p.Asp1177His | p.D1177H | Q6IQ55 | protein_coding | deleterious_low_confidence(0) | possibly_damaging(0.671) | TCGA-C8-A8HQ-01 | Breast | breast invasive carcinoma | Female | <65 | I/II | Unknown | Unknown | SD |
| TTBK2 | SNV | Missense_Mutation | c.760N>A | p.Glu254Lys | p.E254K | Q6IQ55 | protein_coding | deleterious(0) | probably_damaging(0.982) | TCGA-D8-A1J8-01 | Breast | breast invasive carcinoma | Female | >=65 | I/II | Hormone Therapy | nolvadex | SD | |
| TTBK2 | SNV | Missense_Mutation | c.431C>T | p.Pro144Leu | p.P144L | Q6IQ55 | protein_coding | deleterious(0.01) | probably_damaging(1) | TCGA-E2-A155-01 | Breast | breast invasive carcinoma | Female | <65 | I/II | Chemotherapy | cytoxan | SD | |
| TTBK2 | insertion | Frame_Shift_Ins | novel | c.2292_2293insGTCCTTCCTT | p.Leu765ValfsTer10 | p.L765Vfs*10 | Q6IQ55 | protein_coding | TCGA-A8-A07J-01 | Breast | breast invasive carcinoma | Female | <65 | I/II | Chemotherapy | 5-fluorouracil | CR | ||
| TTBK2 | insertion | In_Frame_Ins | novel | c.2291_2292insTCAAGCTTCTGGTGGAAAAAAGACAATTCA | p.Arg764delinsSerGlnAlaSerGlyGlyLysLysThrIleGln | p.R764delinsSQASGGKKTIQ | Q6IQ55 | protein_coding | TCGA-A8-A07J-01 | Breast | breast invasive carcinoma | Female | <65 | I/II | Chemotherapy | 5-fluorouracil | CR | ||
| TTBK2 | insertion | Nonsense_Mutation | novel | c.2399_2400insGGAGTGACTCAATCTCAGCTCACTGCAACCTCTGC | p.Ile800MetfsTer3 | p.I800Mfs*3 | Q6IQ55 | protein_coding | TCGA-A8-A07Z-01 | Breast | breast invasive carcinoma | Female | >=65 | I/II | Unspecific | Exemestane | SD | ||
| TTBK2 | insertion | Frame_Shift_Ins | novel | c.295_296insCAGATTCCGACCCTAT | p.Arg99ProfsTer14 | p.R99Pfs*14 | Q6IQ55 | protein_coding | TCGA-AQ-A04J-01 | Breast | breast invasive carcinoma | Female | <65 | I/II | Chemotherapy | cytoxan | SD | ||
| TTBK2 | insertion | Nonsense_Mutation | novel | c.3537_3538insTGTGTTTATTTCGTGTATTGAGAATGAACACCTTTACTTTGCCTC | p.Arg1179_Ser1180insCysValTyrPheValTyrTerGluTerThrProLeuLeuCysLeu | p.R1179_S1180insCVYFVY*E*TPLLCL | Q6IQ55 | protein_coding | TCGA-B6-A0RE-01 | Breast | breast invasive carcinoma | Female | <65 | I/II | Unknown | Unknown | SD |
| Page: 1 2 3 4 5 6 7 8 9 10 11 12 13 |
Top |
Related drugs of malignant transformation related genes |
| Identification of chemicals and drugs interact with genes involved in malignant transfromation |
| (DGIdb 4.0) |
| Entrez ID | Symbol | Category | Interaction Types | Drug Claim Name | Drug Name | PMIDs |
| Page: 1 |

Copyright 2023-Present -The University of Texas Health Science Center at Houston |