
|
|||||
|
 | |
| |
| |
| |
| |
| |
|
Gene: TSTD1 |
Gene summary for TSTD1 |
| Gene information | Species | Human | Gene symbol | TSTD1 | Gene ID | 100131187 |
| Gene name | thiosulfate sulfurtransferase like domain containing 1 | |
| Gene Alias | KAT | |
| Cytomap | 1q23.3 | |
| Gene Type | protein-coding | GO ID | GO:0006790 | UniProtAcc | Q8NFU3 |
Top |
Malignant transformation analysis |
| Identification of the aberrant gene expression in precancerous and cancerous lesions by comparing the gene expression of stem-like cells in diseased tissues with normal stem cells |
| Entrez ID | Symbol | Replicates | Species | Organ | Tissue | Adj P-value | Log2FC | Malignancy |
| 100131187 | TSTD1 | GSM4909280 | Human | Breast | Precancer | 2.03e-02 | -5.76e-01 | 0.0305 |
| 100131187 | TSTD1 | GSM4909282 | Human | Breast | IDC | 9.08e-27 | 5.32e-01 | -0.0288 |
| 100131187 | TSTD1 | GSM4909288 | Human | Breast | IDC | 5.21e-04 | -6.39e-02 | 0.0988 |
| 100131187 | TSTD1 | GSM4909291 | Human | Breast | IDC | 7.93e-07 | 3.93e-01 | 0.1753 |
| 100131187 | TSTD1 | GSM4909294 | Human | Breast | IDC | 9.26e-25 | 3.38e-01 | 0.2022 |
| 100131187 | TSTD1 | GSM4909296 | Human | Breast | IDC | 6.95e-15 | 1.82e-01 | 0.1524 |
| 100131187 | TSTD1 | GSM4909297 | Human | Breast | IDC | 1.07e-21 | -6.19e-02 | 0.1517 |
| 100131187 | TSTD1 | GSM4909298 | Human | Breast | IDC | 2.03e-24 | 5.26e-01 | 0.1551 |
| 100131187 | TSTD1 | GSM4909299 | Human | Breast | IDC | 1.28e-08 | 3.88e-01 | 0.035 |
| 100131187 | TSTD1 | GSM4909302 | Human | Breast | IDC | 2.03e-23 | 4.51e-01 | 0.1545 |
| 100131187 | TSTD1 | GSM4909306 | Human | Breast | IDC | 8.24e-50 | 7.11e-01 | 0.1564 |
| 100131187 | TSTD1 | GSM4909307 | Human | Breast | IDC | 3.27e-29 | 5.90e-01 | 0.1569 |
| 100131187 | TSTD1 | GSM4909308 | Human | Breast | IDC | 2.74e-41 | 6.75e-01 | 0.158 |
| 100131187 | TSTD1 | GSM4909309 | Human | Breast | IDC | 6.43e-12 | 3.00e-01 | 0.0483 |
| 100131187 | TSTD1 | GSM4909311 | Human | Breast | IDC | 4.59e-43 | -1.68e-01 | 0.1534 |
| 100131187 | TSTD1 | GSM4909312 | Human | Breast | IDC | 2.34e-13 | 3.41e-02 | 0.1552 |
| 100131187 | TSTD1 | GSM4909313 | Human | Breast | IDC | 7.21e-23 | 4.94e-01 | 0.0391 |
| 100131187 | TSTD1 | GSM4909315 | Human | Breast | IDC | 9.63e-08 | 2.43e-01 | 0.21 |
| 100131187 | TSTD1 | GSM4909316 | Human | Breast | IDC | 3.22e-09 | 3.60e-01 | 0.21 |
| 100131187 | TSTD1 | GSM4909317 | Human | Breast | IDC | 6.99e-14 | 4.49e-01 | 0.1355 |
| Page: 1 2 3 4 5 6 7 8 9 10 11 12 13 14 |
| Tissue | Expression Dynamics | Abbreviation |
| Breast | 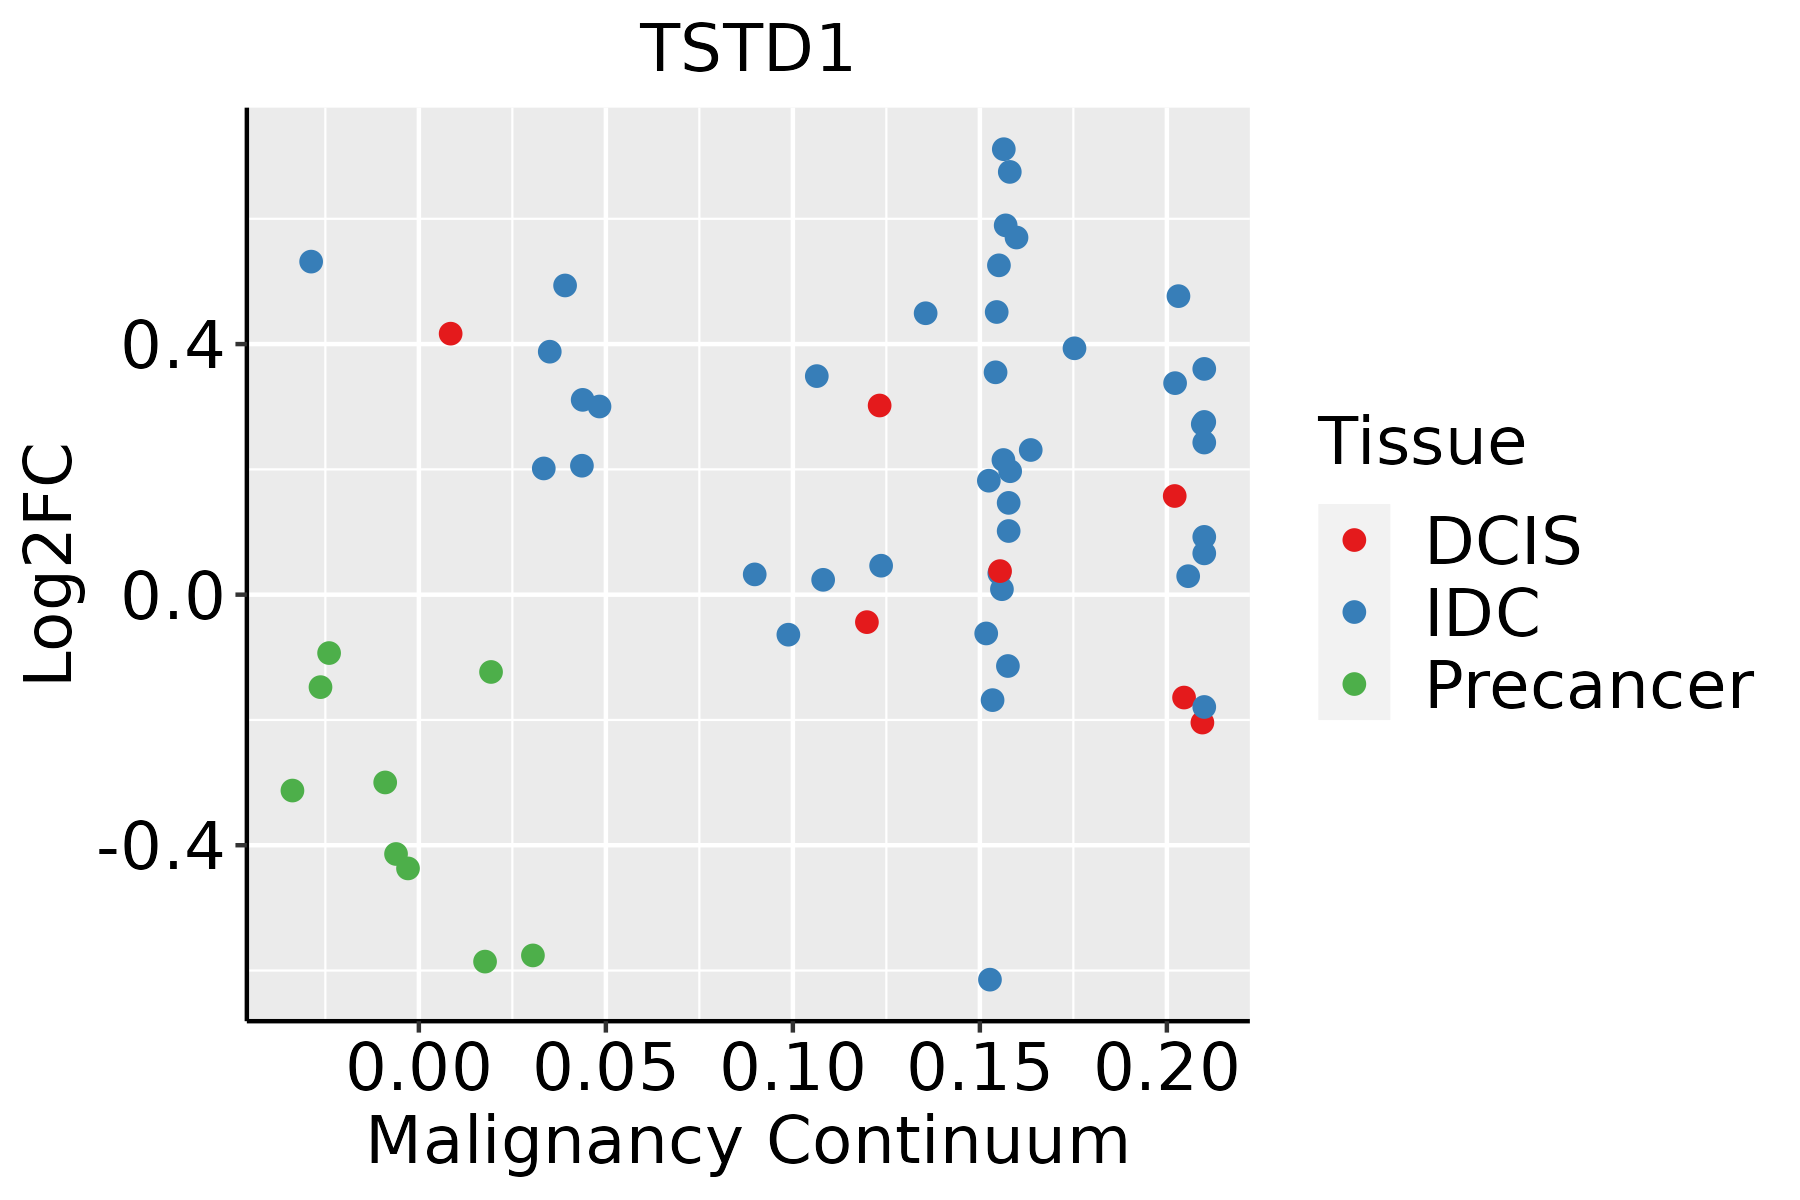 | IDC: Invasive ductal carcinoma |
| DCIS: Ductal carcinoma in situ | ||
| Precancer(BRCA1-mut): Precancerous lesion from BRCA1 mutation carriers | ||
| Cervix |  | CC: Cervix cancer |
| HSIL_HPV: HPV-infected high-grade squamous intraepithelial lesions | ||
| N_HPV: HPV-infected normal cervix | ||
| Colorectum (GSE201348) |  | FAP: Familial adenomatous polyposis |
| CRC: Colorectal cancer | ||
| Colorectum (HTA11) |  | AD: Adenomas |
| SER: Sessile serrated lesions | ||
| MSI-H: Microsatellite-high colorectal cancer | ||
| MSS: Microsatellite stable colorectal cancer | ||
| Esophagus |  | ESCC: Esophageal squamous cell carcinoma |
| HGIN: High-grade intraepithelial neoplasias | ||
| LGIN: Low-grade intraepithelial neoplasias | ||
| GC | 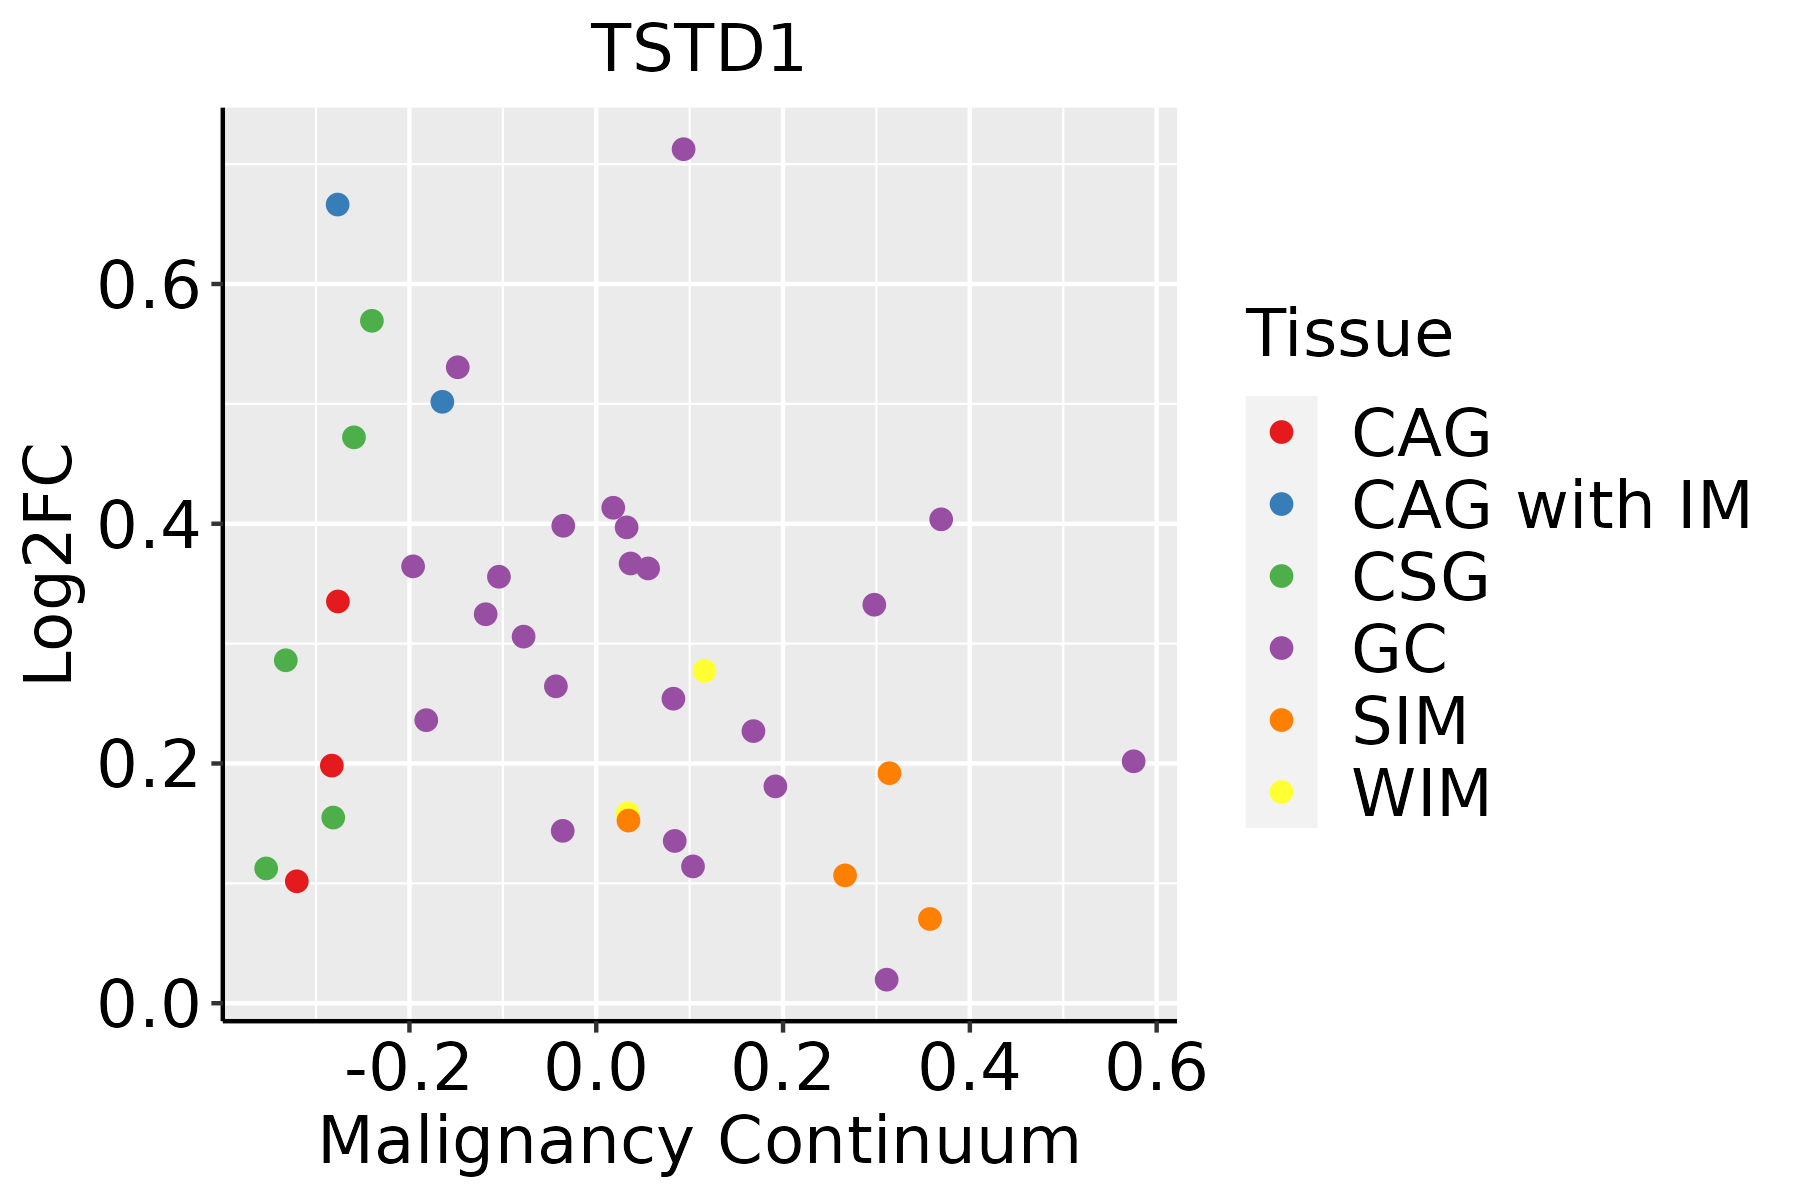 | CAG: Chronic atrophic gastritis |
| CAG with IM: Chronic atrophic gastritis with intestinal metaplasia | ||
| CSG: Chronic superficial gastritis | ||
| GC: Gastric cancer | ||
| SIM: Severe intestinal metaplasia | ||
| WIM: Wild intestinal metaplasia | ||
| Liver | 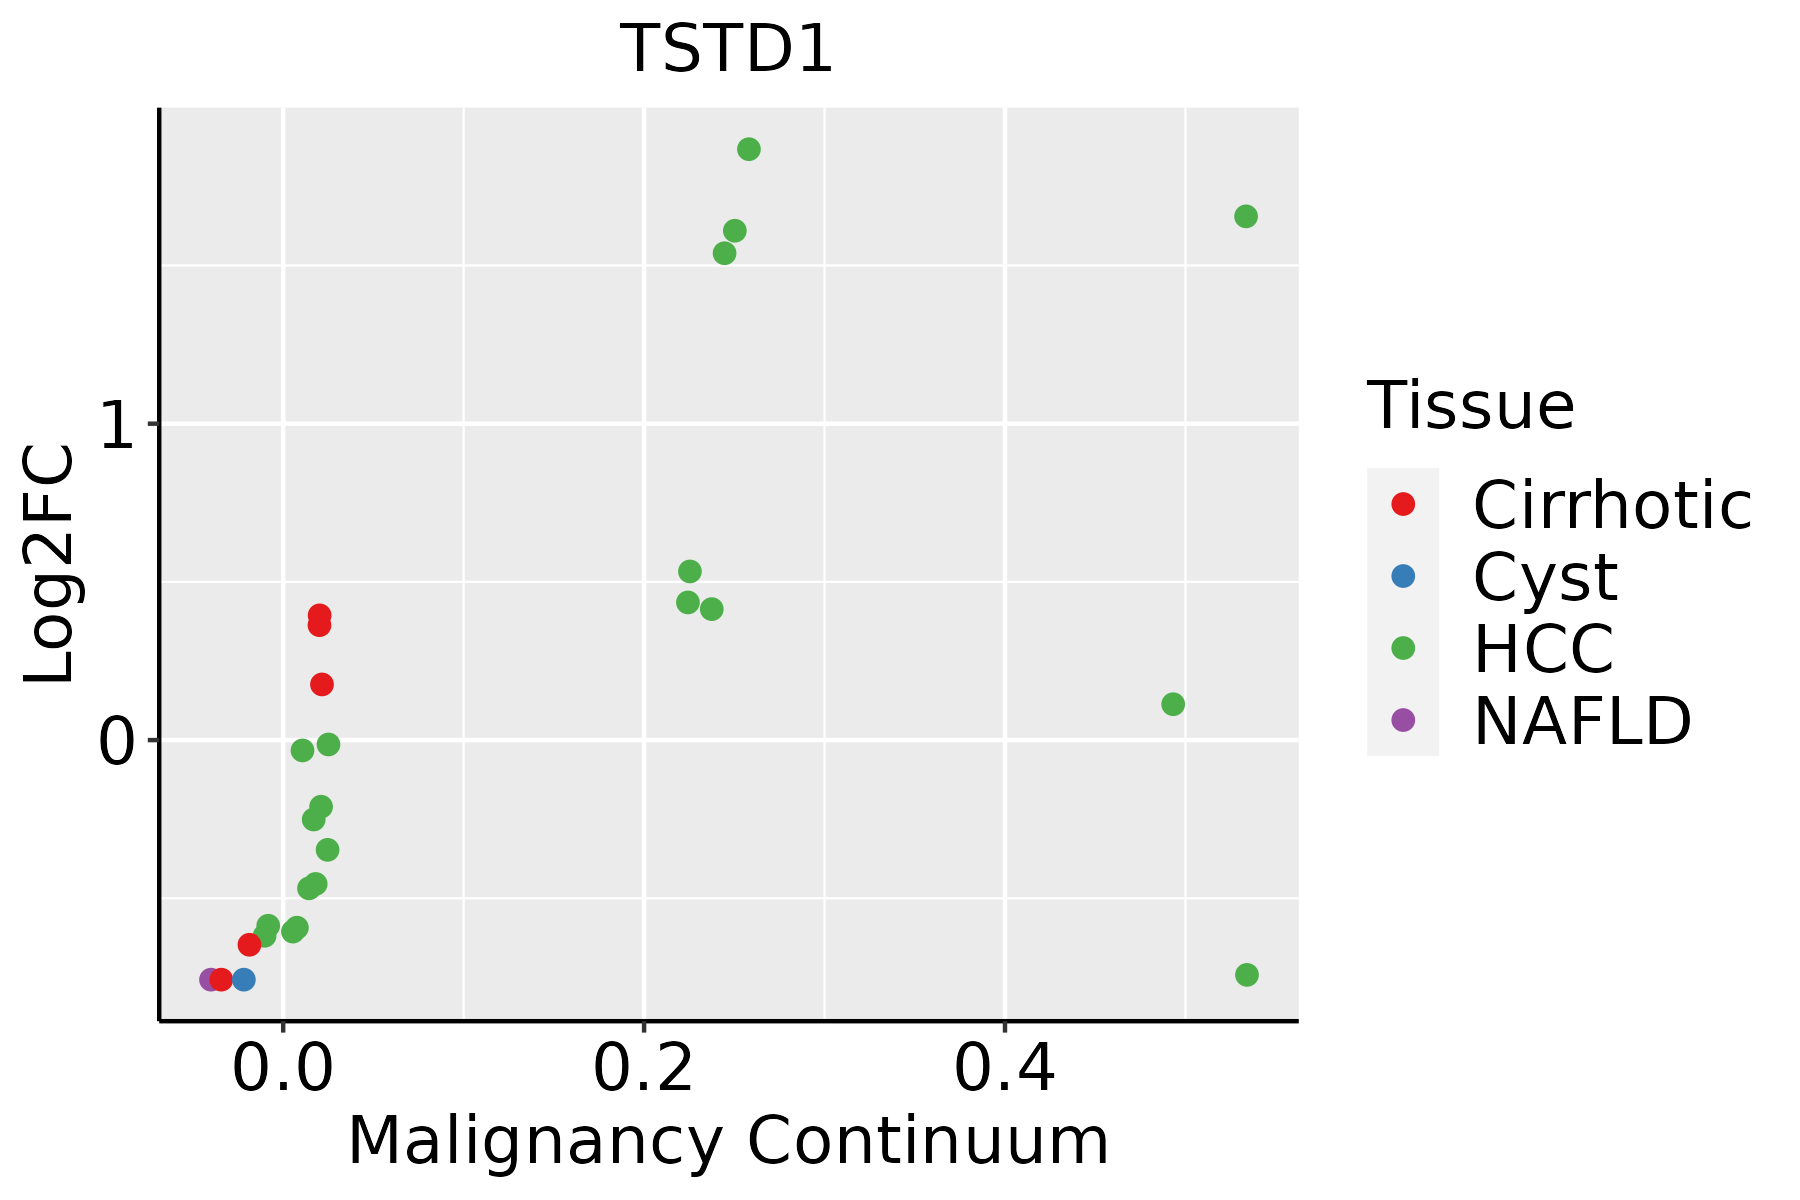 | HCC: Hepatocellular carcinoma |
| NAFLD: Non-alcoholic fatty liver disease | ||
| Oral Cavity |  | EOLP: Erosive Oral lichen planus |
| LP: leukoplakia | ||
| NEOLP: Non-erosive oral lichen planus | ||
| OSCC: Oral squamous cell carcinoma | ||
| Prostate | 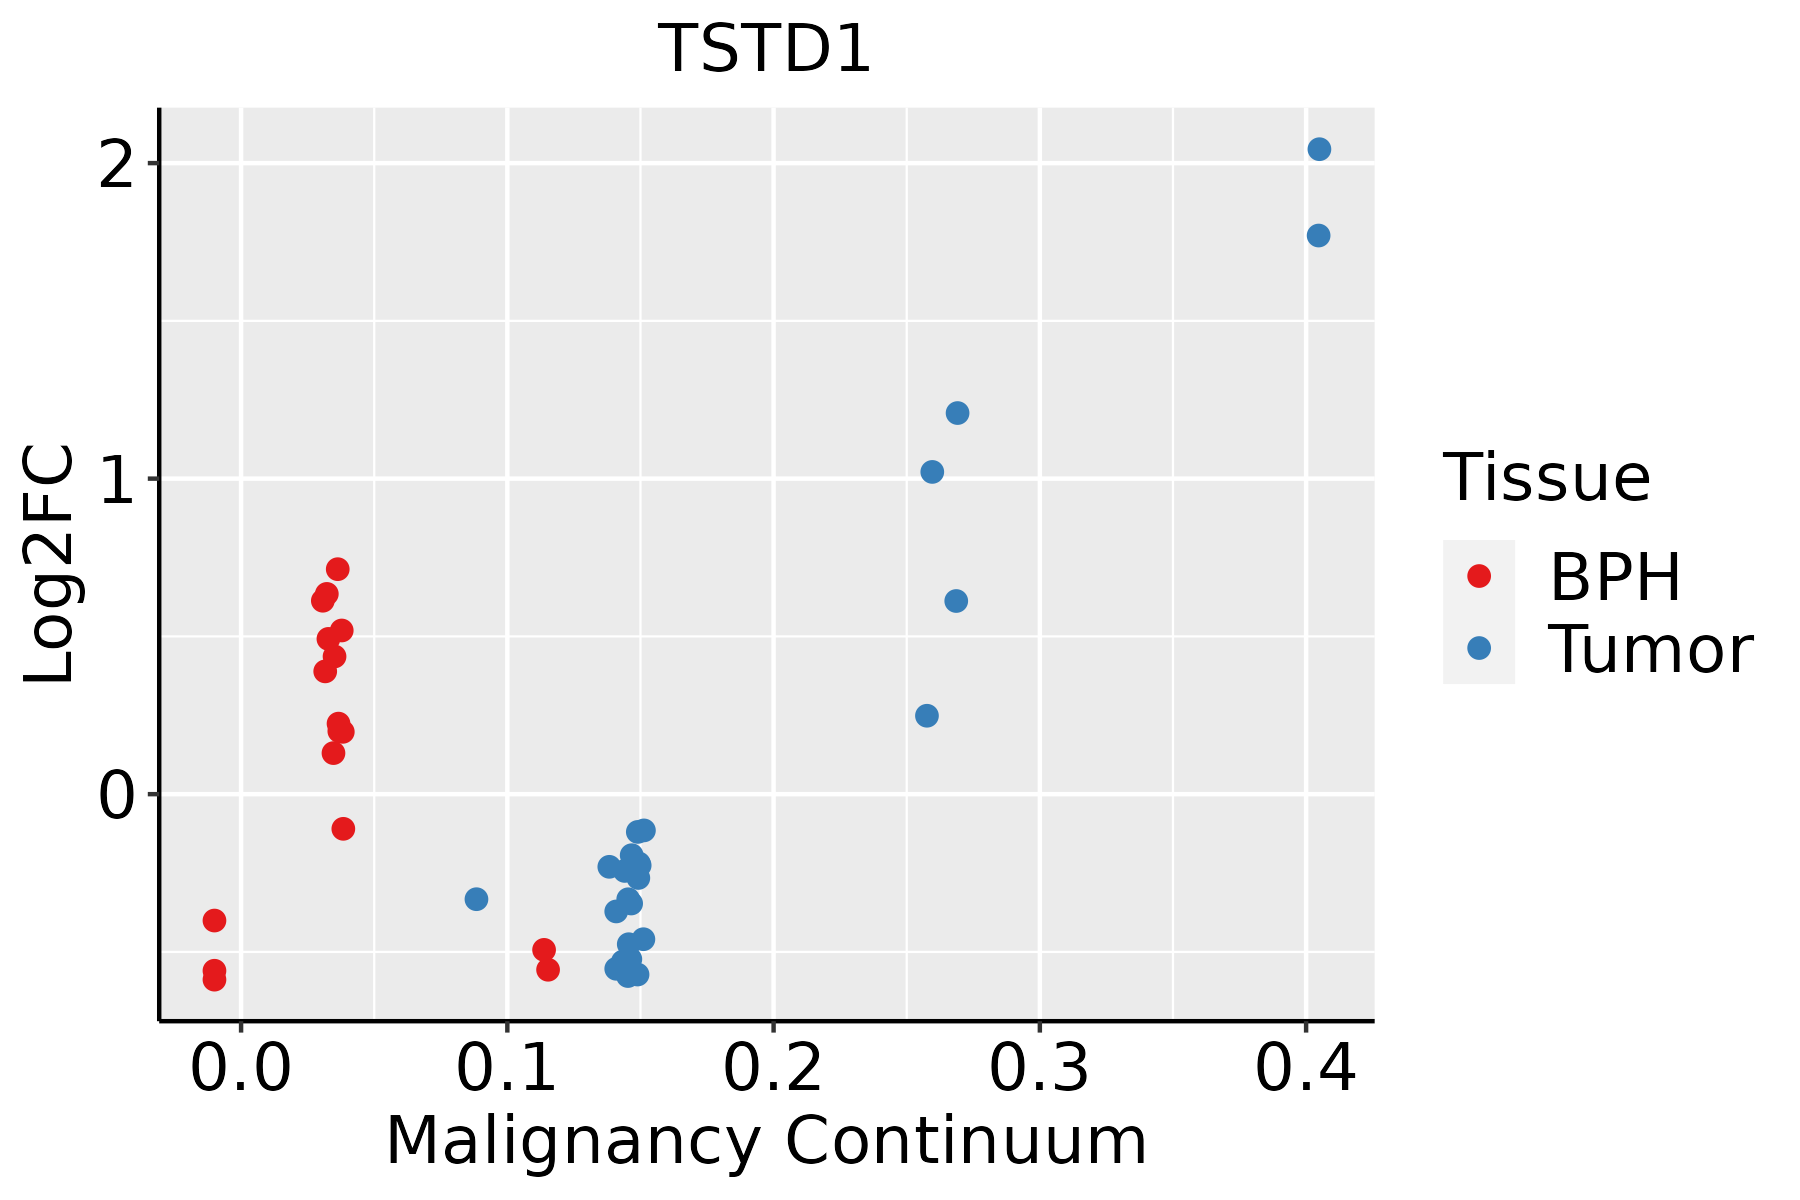 | BPH: Benign Prostatic Hyperplasia |
| Skin | 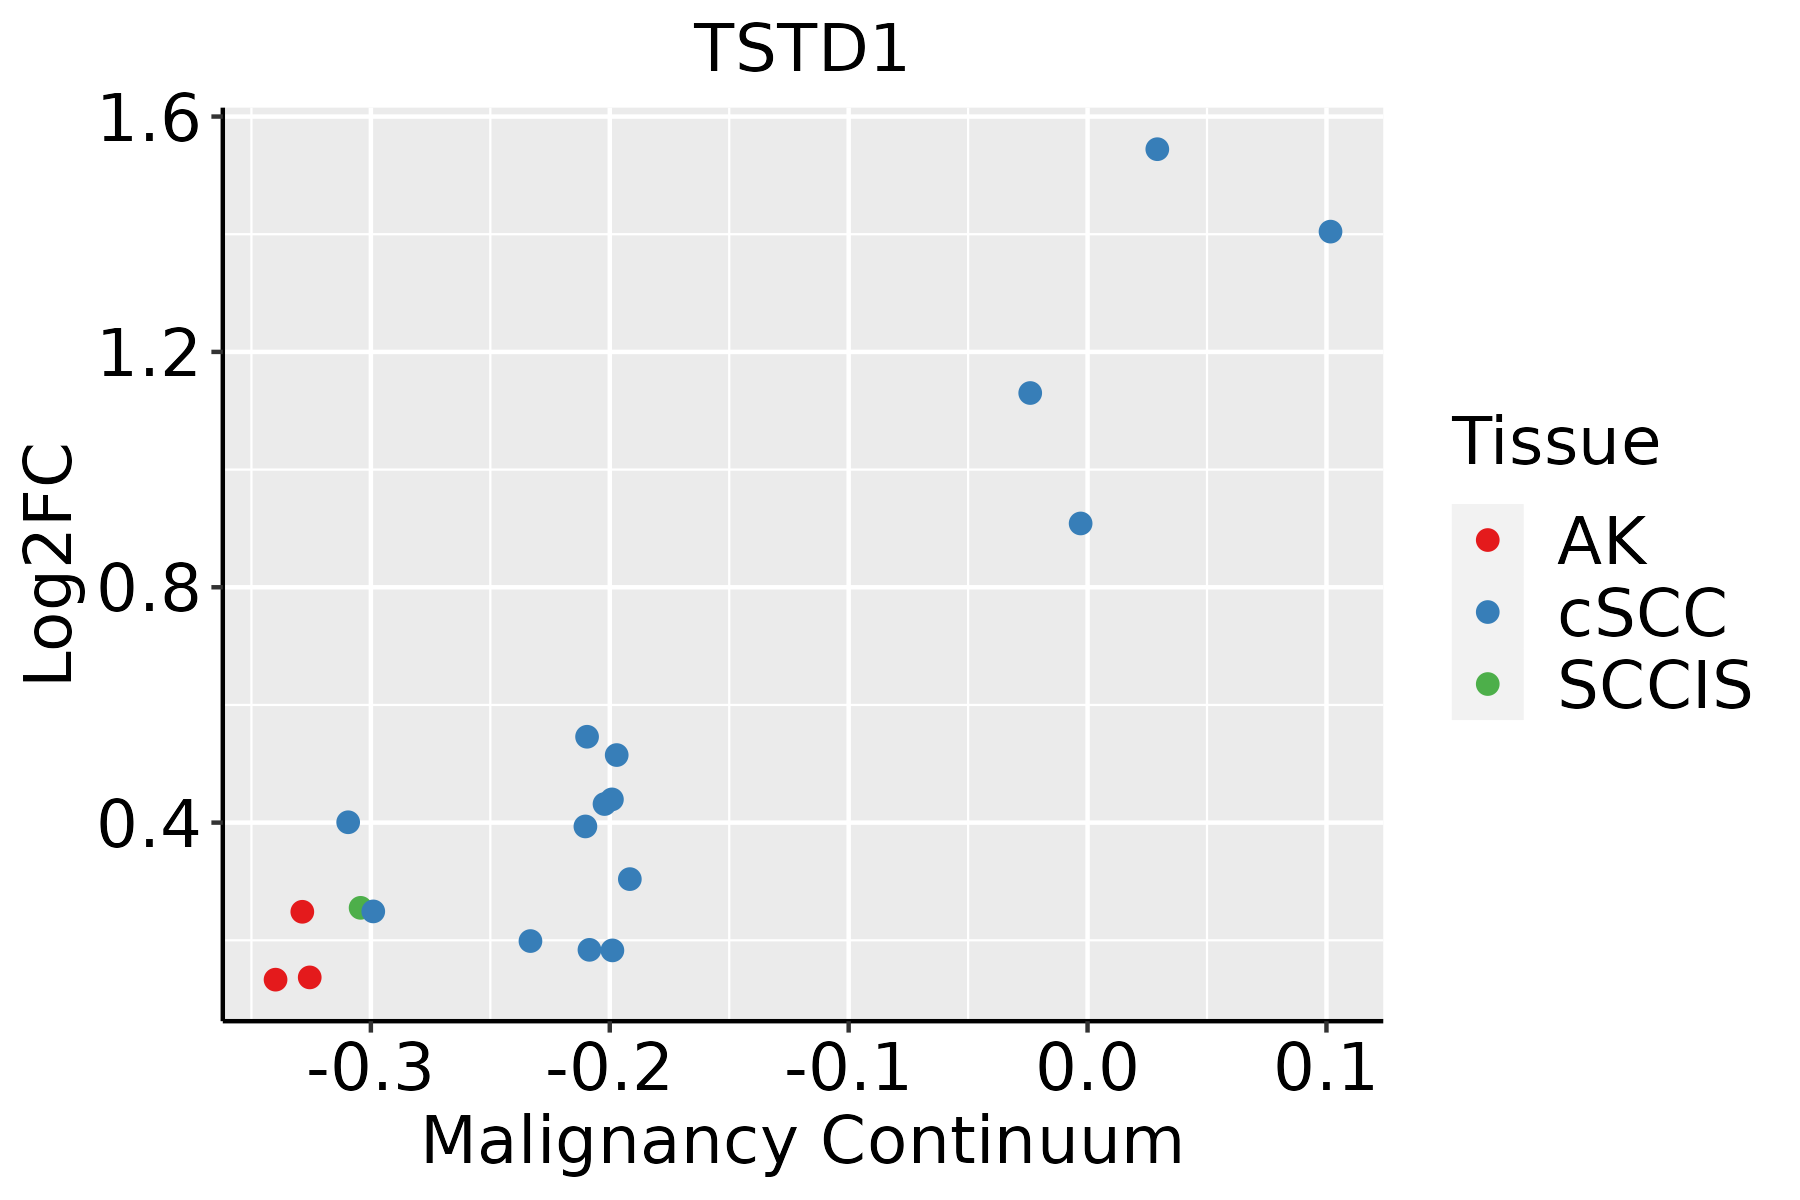 | AK: Actinic keratosis |
| cSCC: Cutaneous squamous cell carcinoma | ||
| SCCIS:squamous cell carcinoma in situ | ||
| Thyroid |  | ATC: Anaplastic thyroid cancer |
| HT: Hashimoto's thyroiditis | ||
| PTC: Papillary thyroid cancer |
| ∗log2FC in expression of this searched gene in stem-like cells from each diseased tissue sample relative to stem-like cells in normal samples in each tissue plotted against the malignancy continuum. Samples are colored based on if they are from different disease stage. |
Top |
Malignant transformation related pathway analysis |
| Find out the enriched GO biological processes and KEGG pathways involved in transition from healthy to precancer to cancer |
| Tissue | Disease Stage | Enriched GO biological Processes |
| Colorectum | AD |  |
| Colorectum | SER |  |
| Colorectum | MSS |  |
| Colorectum | MSI-H |  |
| Colorectum | FAP |  |
| ∗Top 15 enriched GO BP terms are showed in the bar plot of each disease state in each tissue. Each row represents a significant GO biological process which is colored according to the -log10(p.adjust). |
| Page: 1 2 3 4 5 6 7 8 9 |
| GO ID | Tissue | Disease Stage | Description | Gene Ratio | Bg Ratio | pvalue | p.adjust | Count |
| GO:0006790 | Colorectum | AD | sulfur compound metabolic process | 101/3918 | 339/18723 | 6.46e-05 | 1.07e-03 | 101 |
| GO:00067901 | Colorectum | SER | sulfur compound metabolic process | 73/2897 | 339/18723 | 1.75e-03 | 1.81e-02 | 73 |
| GO:00067902 | Colorectum | MSS | sulfur compound metabolic process | 85/3467 | 339/18723 | 1.52e-03 | 1.39e-02 | 85 |
| GO:00067906 | Esophagus | ESCC | sulfur compound metabolic process | 201/8552 | 339/18723 | 2.64e-07 | 3.94e-06 | 201 |
| GO:000679011 | Liver | Cirrhotic | sulfur compound metabolic process | 129/4634 | 339/18723 | 3.06e-08 | 1.04e-06 | 129 |
| GO:000679021 | Liver | HCC | sulfur compound metabolic process | 212/7958 | 339/18723 | 5.60e-14 | 3.39e-12 | 212 |
| GO:00067905 | Oral cavity | OSCC | sulfur compound metabolic process | 168/7305 | 339/18723 | 4.50e-05 | 3.84e-04 | 168 |
| GO:000679012 | Oral cavity | LP | sulfur compound metabolic process | 106/4623 | 339/18723 | 3.36e-03 | 2.25e-02 | 106 |
| GO:00067903 | Stomach | GC | sulfur compound metabolic process | 35/1159 | 339/18723 | 2.10e-03 | 2.10e-02 | 35 |
| Page: 1 |
| Pathway ID | Tissue | Disease Stage | Description | Gene Ratio | Bg Ratio | pvalue | p.adjust | qvalue | Count |
| Page: 1 |
Top |
Cell-cell communication analysis |
| Identification of potential cell-cell interactions between two cell types and their ligand-receptor pairs for different disease states |
| Ligand | Receptor | LRpair | Pathway | Tissue | Disease Stage |
| Page: 1 |
Top |
Single-cell gene regulatory network inference analysis |
| Find out the significant the regulons (TFs) and the target genes of each regulon across cell types for different disease states |
| TF | Cell Type | Tissue | Disease Stage | Target Gene | RSS | Regulon Activity |
| ∗The dot plots of a searched regulon are shown for all cell subpopulations in each disease state of each tissue based on the regulon specific score inferred using pySCENIC and by calculating the average expression. |
| Page: 1 |
Top |
Somatic mutation of malignant transformation related genes |
| Annotation of somatic variants for genes involved in malignant transformation |
| Hugo Symbol | Variant Class | Variant Classification | dbSNP RS | HGVSc | HGVSp | HGVSp Short | SWISSPROT | BIOTYPE | SIFT | PolyPhen | Tumor Sample Barcode | Tissue | Histology | Sex | Age | Stage | Therapy Types | Drugs | Outcome |
| TSTD1 | insertion | In_Frame_Ins | novel | c.150_151insAGAGAC | p.Ser50_Ala51insArgAsp | p.S50_A51insRD | Q8NFU3 | protein_coding | TCGA-A8-A07U-01 | Breast | breast invasive carcinoma | Female | >=65 | III/IV | Chemotherapy | 5-fluorouracil | SD | ||
| TSTD1 | insertion | Frame_Shift_Ins | novel | c.148_149insATTTTTTGTATTTTTTTTTA | p.Ser50AsnfsTer80 | p.S50Nfs*80 | Q8NFU3 | protein_coding | TCGA-A8-A07U-01 | Breast | breast invasive carcinoma | Female | >=65 | III/IV | Chemotherapy | 5-fluorouracil | SD | ||
| TSTD1 | SNV | Missense_Mutation | c.310G>A | p.Ala104Thr | p.A104T | Q8NFU3 | protein_coding | tolerated(0.15) | benign(0.007) | TCGA-AA-3510-01 | Colorectum | colon adenocarcinoma | Male | >=65 | I/II | Unknown | Unknown | SD | |
| TSTD1 | SNV | Missense_Mutation | c.197A>G | p.Glu66Gly | p.E66G | Q8NFU3 | protein_coding | tolerated(0.17) | benign(0.007) | TCGA-B5-A0JY-01 | Endometrium | uterine corpus endometrioid carcinoma | Female | <65 | III/IV | Chemotherapy | doxorubicin | SD | |
| TSTD1 | SNV | Missense_Mutation | novel | c.314N>T | p.Gly105Val | p.G105V | Q8NFU3 | protein_coding | deleterious(0) | probably_damaging(0.962) | TCGA-DF-A2KU-01 | Endometrium | uterine corpus endometrioid carcinoma | Female | Unknown | I/II | Unknown | Unknown | SD |
| TSTD1 | SNV | Missense_Mutation | novel | c.130C>T | p.Pro44Ser | p.P44S | Q8NFU3 | protein_coding | deleterious(0.01) | probably_damaging(1) | TCGA-G3-AAV7-01 | Liver | liver hepatocellular carcinoma | Male | <65 | I/II | Unknown | Unknown | SD |
| Page: 1 |
Top |
Related drugs of malignant transformation related genes |
| Identification of chemicals and drugs interact with genes involved in malignant transfromation |
| (DGIdb 4.0) |
| Entrez ID | Symbol | Category | Interaction Types | Drug Claim Name | Drug Name | PMIDs |
| Page: 1 |

Copyright 2023-Present -The University of Texas Health Science Center at Houston |