Schematic overview of the cellular and molecular mechanisms involved in the cancer progression, including the proposed cellular and molecular mechanisms in cancer cells trajectory. AT1: alveolar type 1 cells; AT2: alveolar type 2 cells; AAH: atypical adenomatous hyperplasia; AIS: adenocarcinoma in situ; MIA: minimally invasive adenocarcinoma; IA: invasive adenocarcinoma; EMT: epithelial-mesenchymal transition

Home

Download

Statistics

Help

Contact

Center for Computational Systems Medicine
leaf

Gene summary

leaf

Malignant transformation analysis

leaf

Malignant transformation related pathway analysis

leaf

Cell-cell communication analysis

leaf

Single-cell gene regulatory network inference analysis

leaf

Somatic mutation of malignant transformation related genes

leaf

Related drugs of malignant transformation related genes

Gene: TSPYL2

Gene summary for TSPYL2

check button Gene summary.

Gene informationSpeciesHuman
Gene symbol

TSPYL2

Gene ID

64061

Gene nameTSPY like 2
Gene AliasCDA1
CytomapXp11.22
Gene Typeprotein-coding
GO ID

GO:0001558

UniProtAcc

Q9H2G4


Top

Malignant transformation analysis

check button Identification of the aberrant gene expression in precancerous and cancerous lesions by comparing the gene expression of stem-like cells in diseased tissues with normal stem cells
check button Malignant transformation involving gene list.
Entrez IDSymbolReplicatesSpeciesOrganTissueAdj P-valueLog2FCMalignancy
64061TSPYL2GSM4909277HumanBreastPrecancer3.67e-057.34e-010.0177
64061TSPYL2GSM4909280HumanBreastPrecancer1.08e-045.93e-010.0305
64061TSPYL2GSM4909296HumanBreastIDC5.10e-04-1.73e-010.1524
64061TSPYL2GSM4909311HumanBreastIDC1.91e-05-1.94e-010.1534
64061TSPYL2GSM4909312HumanBreastIDC7.95e-05-2.03e-010.1552
64061TSPYL2GSM4909319HumanBreastIDC1.24e-08-1.19e-010.1563
64061TSPYL2NCCBC14HumanBreastDCIS1.81e-05-2.19e-010.2021
64061TSPYL2NCCBC5HumanBreastDCIS1.04e-02-2.00e-010.2046
64061TSPYL2P1HumanBreastIDC1.86e-04-1.14e-010.1527
64061TSPYL2DCIS2HumanBreastDCIS1.51e-401.66e-010.0085
64061TSPYL2LZE4THumanEsophagusESCC1.08e-074.50e-010.0811
64061TSPYL2LZE7THumanEsophagusESCC2.30e-054.33e-010.0667
64061TSPYL2LZE24THumanEsophagusESCC2.73e-237.75e-010.0596
64061TSPYL2LZE21THumanEsophagusESCC2.09e-055.86e-010.0655
64061TSPYL2LZE6THumanEsophagusESCC4.88e-032.52e-010.0845
64061TSPYL2P1T-EHumanEsophagusESCC1.46e-087.37e-010.0875
64061TSPYL2P2T-EHumanEsophagusESCC6.55e-286.20e-010.1177
64061TSPYL2P4T-EHumanEsophagusESCC1.96e-359.32e-010.1323
64061TSPYL2P5T-EHumanEsophagusESCC1.74e-112.89e-010.1327
64061TSPYL2P8T-EHumanEsophagusESCC3.96e-101.54e-010.0889
Page: 1 2 3 4 5 6 

check button Transcriptomic changes along malignancy continuum.
TissueExpression DynamicsAbbreviation
BreastThe image shows the transcriptomic changes along malignancy continuum.log2FC in expression of this searched gene in stem-like cells from each diseased tissue sample relative to stem-like cells in normal samples in each tissue plotted against the malignancy continuum. Samples are colored based on if they are from different disease stage.
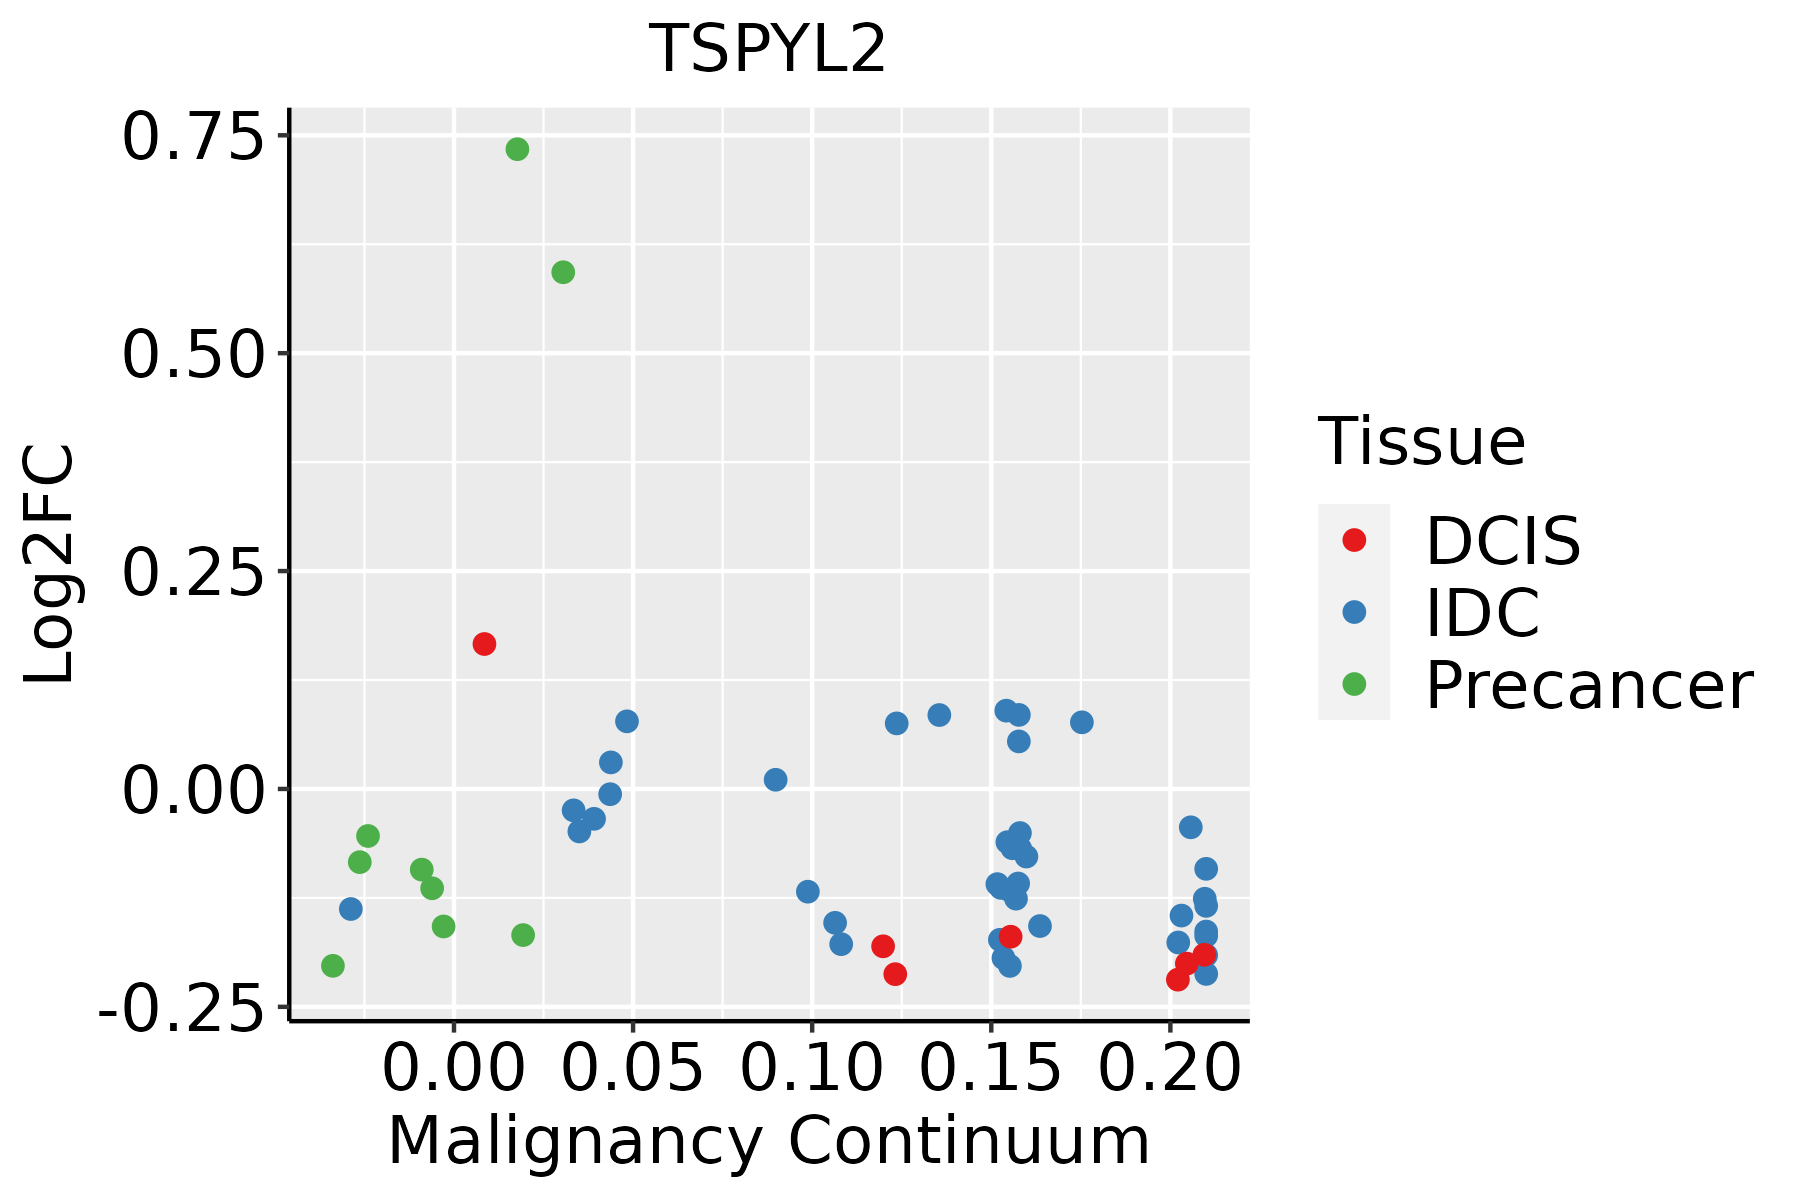
IDC: Invasive ductal carcinoma
DCIS: Ductal carcinoma in situ
Precancer(BRCA1-mut): Precancerous lesion from BRCA1 mutation carriers
EsophagusThe image shows the transcriptomic changes along malignancy continuum.log2FC in expression of this searched gene in stem-like cells from each diseased tissue sample relative to stem-like cells in normal samples in each tissue plotted against the malignancy continuum. Samples are colored based on if they are from different disease stage.ESCC: Esophageal squamous cell carcinoma
HGIN: High-grade intraepithelial neoplasias
LGIN: Low-grade intraepithelial neoplasias
LiverThe image shows the transcriptomic changes along malignancy continuum.log2FC in expression of this searched gene in stem-like cells from each diseased tissue sample relative to stem-like cells in normal samples in each tissue plotted against the malignancy continuum. Samples are colored based on if they are from different disease stage.
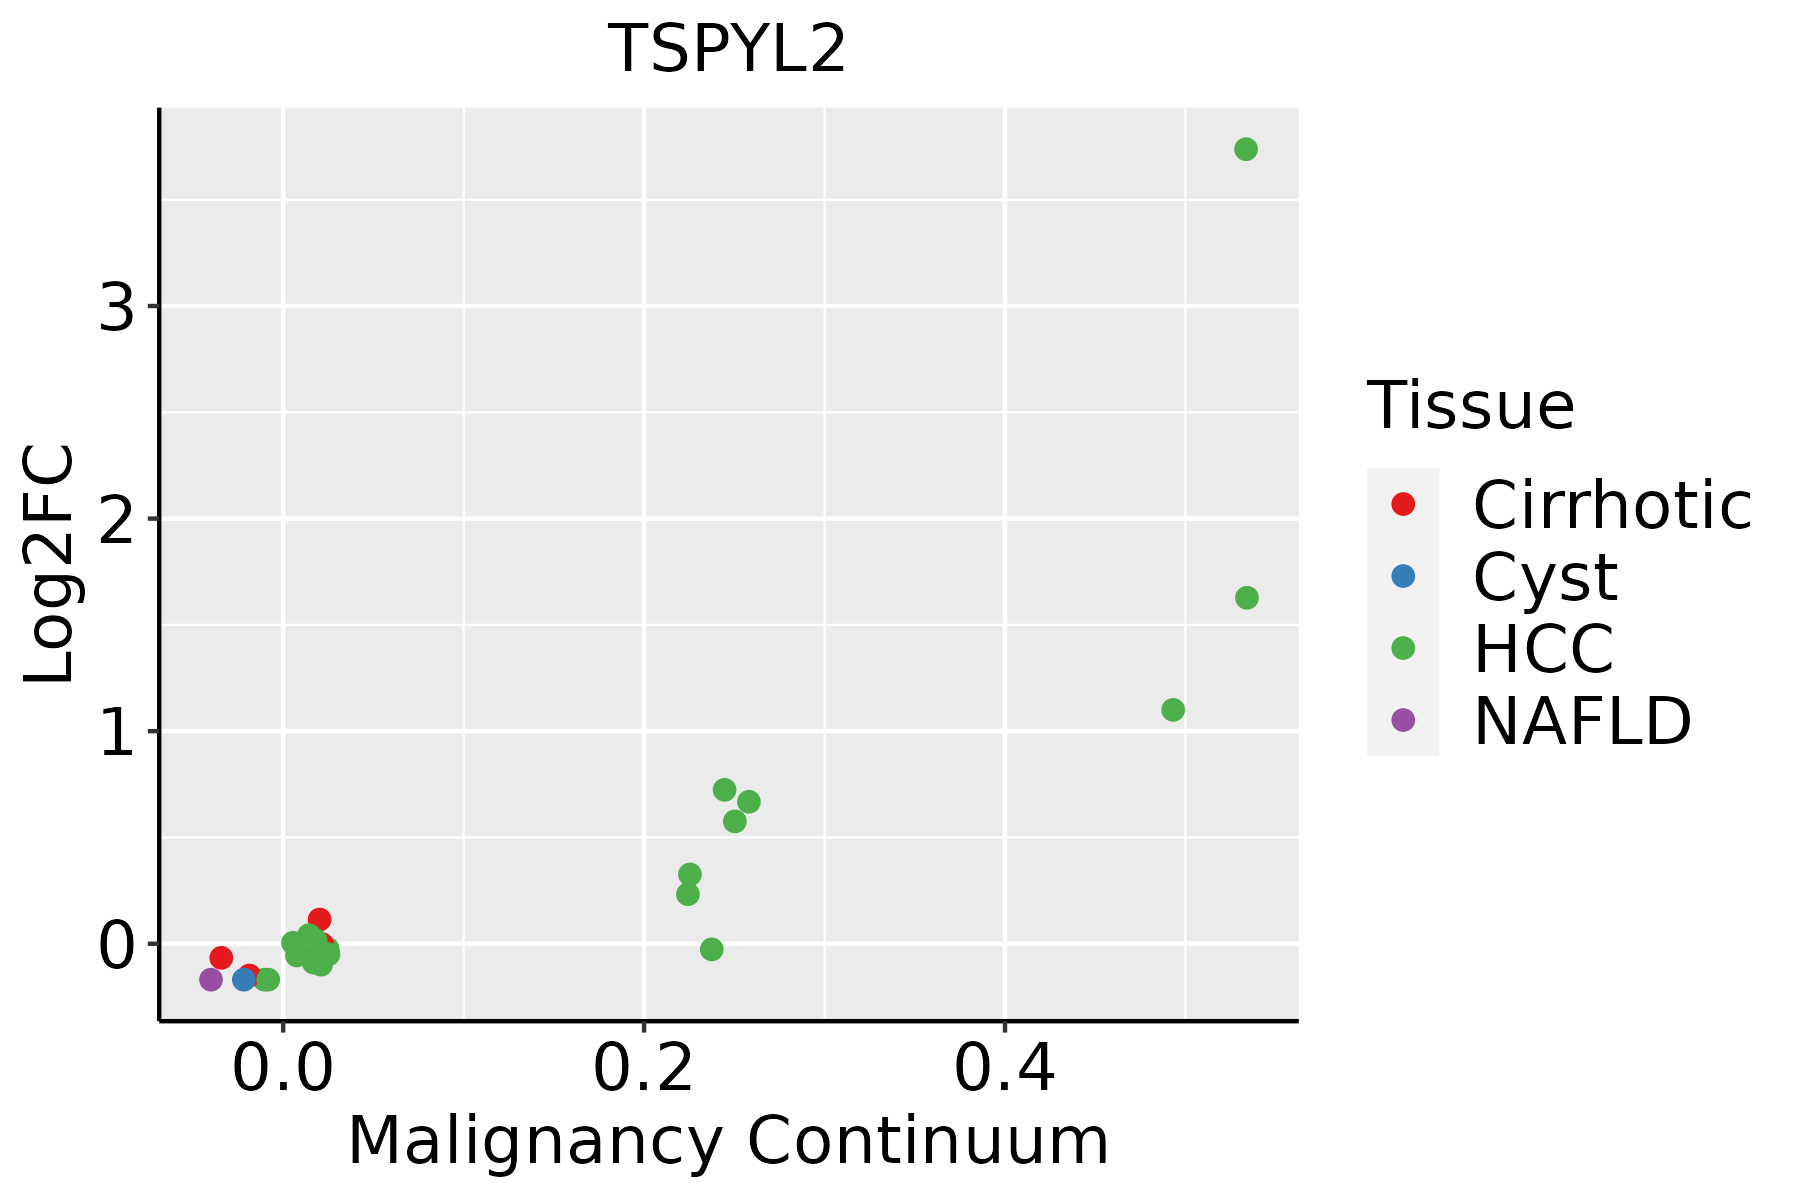
HCC: Hepatocellular carcinoma
NAFLD: Non-alcoholic fatty liver disease
LungThe image shows the transcriptomic changes along malignancy continuum.log2FC in expression of this searched gene in stem-like cells from each diseased tissue sample relative to stem-like cells in normal samples in each tissue plotted against the malignancy continuum. Samples are colored based on if they are from different disease stage.AAH: Atypical adenomatous hyperplasia
AIS: Adenocarcinoma in situ
IAC: Invasive lung adenocarcinoma
MIA: Minimally invasive adenocarcinoma
Oral CavityThe image shows the transcriptomic changes along malignancy continuum.log2FC in expression of this searched gene in stem-like cells from each diseased tissue sample relative to stem-like cells in normal samples in each tissue plotted against the malignancy continuum. Samples are colored based on if they are from different disease stage.EOLP: Erosive Oral lichen planus
LP: leukoplakia
NEOLP: Non-erosive oral lichen planus
OSCC: Oral squamous cell carcinoma
ProstateThe image shows the transcriptomic changes along malignancy continuum.log2FC in expression of this searched gene in stem-like cells from each diseased tissue sample relative to stem-like cells in normal samples in each tissue plotted against the malignancy continuum. Samples are colored based on if they are from different disease stage.
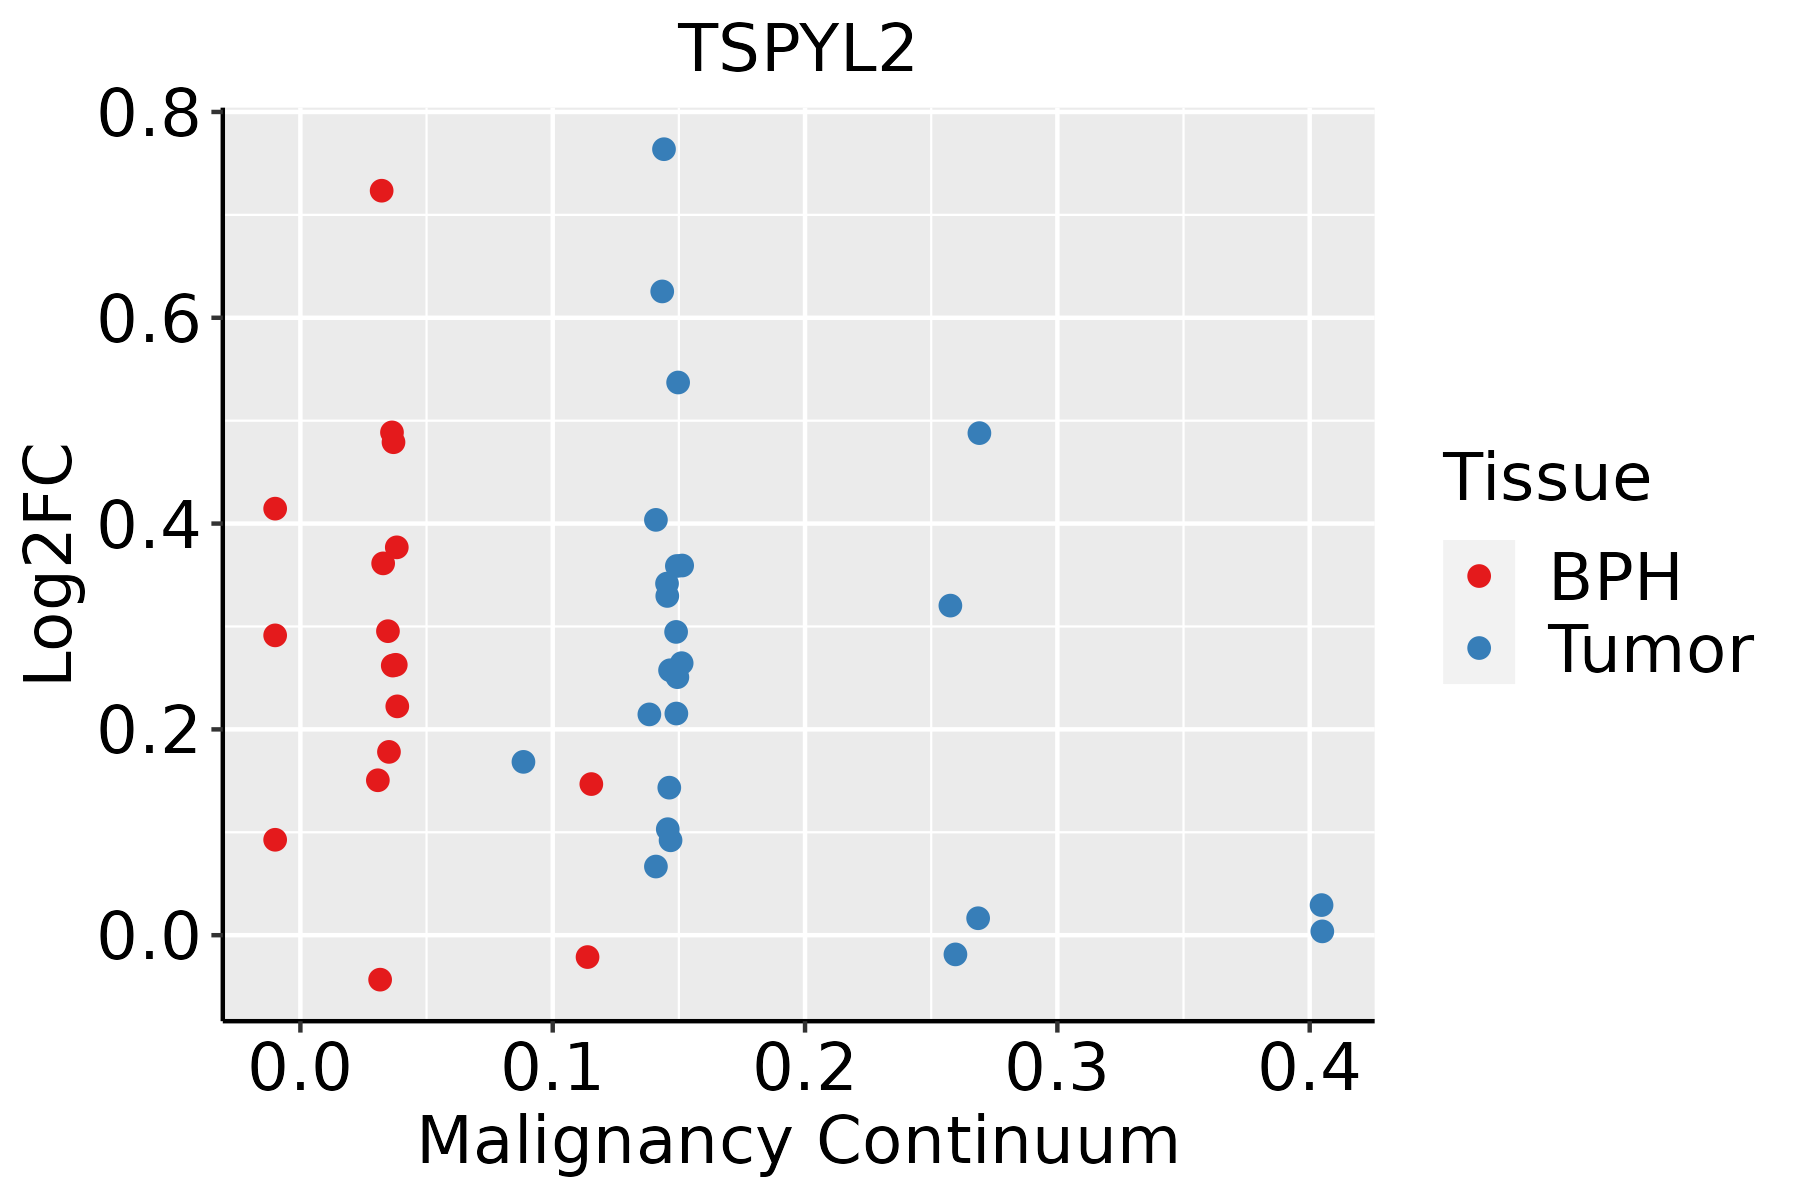
BPH: Benign Prostatic Hyperplasia
ThyroidThe image shows the transcriptomic changes along malignancy continuum.log2FC in expression of this searched gene in stem-like cells from each diseased tissue sample relative to stem-like cells in normal samples in each tissue plotted against the malignancy continuum. Samples are colored based on if they are from different disease stage.
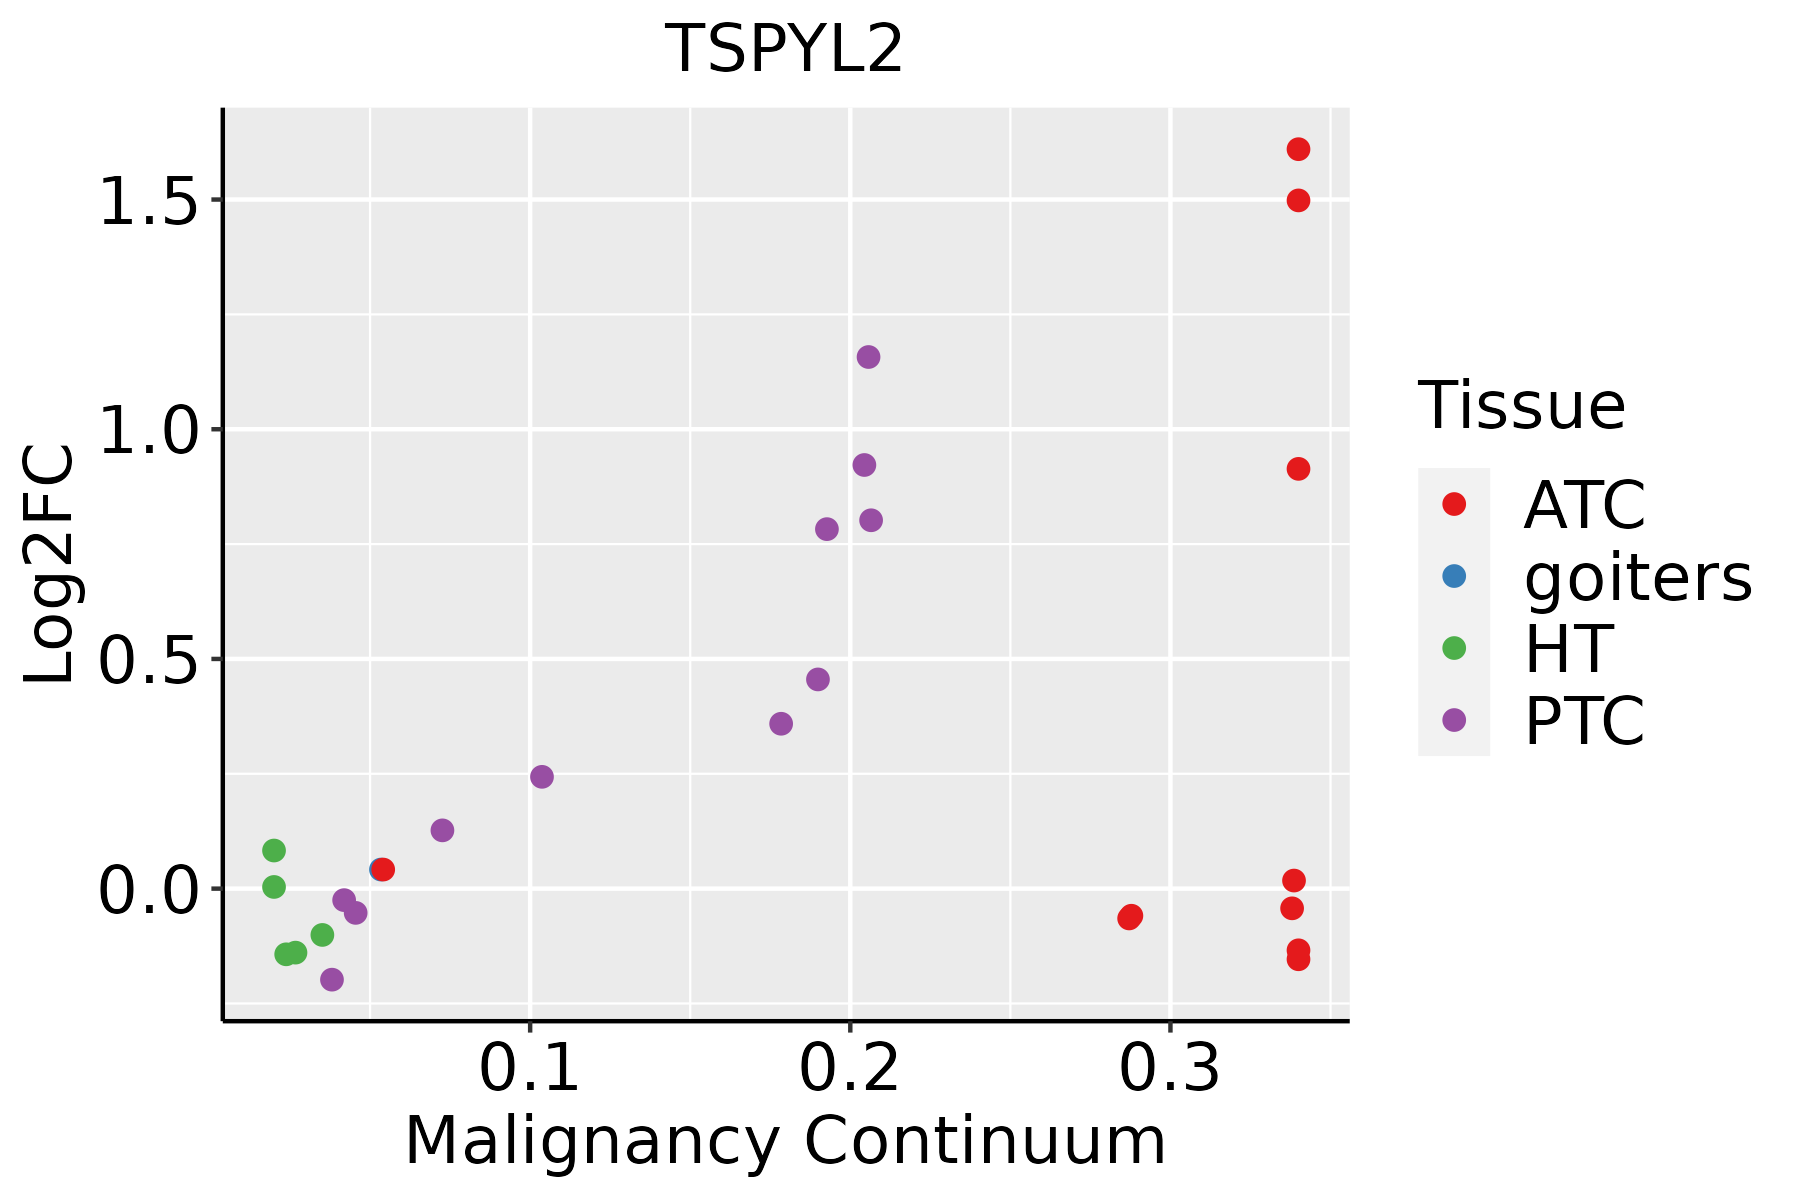
ATC: Anaplastic thyroid cancer
HT: Hashimoto's thyroiditis
PTC: Papillary thyroid cancer
∗log2FC in expression of this searched gene in stem-like cells from each diseased tissue sample relative to stem-like cells in normal samples in each tissue plotted against the malignancy continuum. Samples are colored based on if they are from different disease stage.

Top

Malignant transformation related pathway analysis

check buttonFind out the enriched GO biological processes and KEGG pathways involved in transition from healthy to precancer to cancer
check button Figure of enriched GO biological processes.
TissueDisease StageEnriched GO biological Processes
ColorectumADGO analysis - Figure of enriched GO biological processes: Top 15 enriched GO BP terms are showed in the bar plot of each disease state in each tissue. Each row represents a significant GO biological process which is colored according to the -log10(p.adjust).
ColorectumSERGO analysis - Figure of enriched GO biological processes: Top 15 enriched GO BP terms are showed in the bar plot of each disease state in each tissue. Each row represents a significant GO biological process which is colored according to the -log10(p.adjust).
ColorectumMSSGO analysis - Figure of enriched GO biological processes: Top 15 enriched GO BP terms are showed in the bar plot of each disease state in each tissue. Each row represents a significant GO biological process which is colored according to the -log10(p.adjust).
ColorectumMSI-HGO analysis - Figure of enriched GO biological processes: Top 15 enriched GO BP terms are showed in the bar plot of each disease state in each tissue. Each row represents a significant GO biological process which is colored according to the -log10(p.adjust).
ColorectumFAPGO analysis - Figure of enriched GO biological processes: Top 15 enriched GO BP terms are showed in the bar plot of each disease state in each tissue. Each row represents a significant GO biological process which is colored according to the -log10(p.adjust).
∗Top 15 enriched GO BP terms are showed in the bar plot of each disease state in each tissue. Each row represents a significant GO biological process which is colored according to the -log10(p.adjust).
Page: 1 2 3 4 5 6 7 8 9 

check button Enriched GO biological processes.
GO IDTissueDisease StageDescriptionGene RatioBg Ratiopvaluep.adjustCount
GO:00160497BreastPrecancercell growth46/1080482/187235.63e-047.16e-0346
GO:00015587BreastPrecancerregulation of cell growth39/1080414/187231.81e-031.78e-0239
GO:001604913BreastIDCcell growth56/1434482/187231.16e-031.26e-0256
GO:000155813BreastIDCregulation of cell growth49/1434414/187231.55e-031.55e-0249
GO:001604923BreastDCIScell growth54/1390482/187231.60e-031.59e-0254
GO:000155822BreastDCISregulation of cell growth47/1390414/187232.39e-032.16e-0247
GO:00062604EsophagusESCCDNA replication181/8552260/187233.55e-152.05e-13181
GO:0016049110EsophagusESCCcell growth289/8552482/187231.29e-103.77e-09289
GO:00457865EsophagusESCCnegative regulation of cell cycle236/8552385/187233.62e-109.93e-09236
GO:000155819EsophagusESCCregulation of cell growth248/8552414/187232.97e-096.45e-08248
GO:000632517EsophagusESCCchromatin organization240/8552409/187236.52e-081.14e-06240
GO:00062754EsophagusESCCregulation of DNA replication73/8552107/187231.97e-062.28e-0573
GO:00459267EsophagusESCCnegative regulation of growth148/8552249/187237.88e-067.73e-05148
GO:00303085EsophagusESCCnegative regulation of cell growth108/8552188/187237.46e-043.87e-03108
GO:001604911LiverCirrhoticcell growth160/4634482/187231.50e-052.07e-04160
GO:000155811LiverCirrhoticregulation of cell growth132/4634414/187235.53e-044.36e-03132
GO:001604921LiverHCCcell growth269/7958482/187231.84e-095.35e-08269
GO:000155821LiverHCCregulation of cell growth228/7958414/187231.34e-072.55e-06228
GO:00062601LiverHCCDNA replication146/7958260/187235.68e-067.02e-05146
GO:0045786LiverHCCnegative regulation of cell cycle204/7958385/187231.84e-051.99e-04204
Page: 1 2 3 4 

check button Enriched KEGG pathways.
Pathway IDTissueDisease StageDescriptionGene RatioBg Ratiopvaluep.adjustqvalueCount
Page: 1 

Top

Cell-cell communication analysis

check buttonIdentification of potential cell-cell interactions between two cell types and their ligand-receptor pairs for different disease states
LigandReceptorLRpairPathwayTissueDisease Stage
Page: 1 

Top

Single-cell gene regulatory network inference analysis

check buttonFind out the significant the regulons (TFs) and the target genes of each regulon across cell types for different disease states
TFCell TypeTissueDisease StageTarget GeneRSSRegulon Activity
∗The dot plots of a searched regulon are shown for all cell subpopulations in each disease state of each tissue based on the regulon specific score inferred using pySCENIC and by calculating the average expression.
Page: 1 

Top

Somatic mutation of malignant transformation related genes

check buttonAnnotation of somatic variants for genes involved in malignant transformation
Hugo SymbolVariant ClassVariant ClassificationdbSNP RSHGVScHGVSpHGVSp ShortSWISSPROTBIOTYPESIFTPolyPhenTumor Sample BarcodeTissueHistologySexAgeStageTherapy TypesDrugsOutcome
TSPYL2SNVMissense_Mutationrs782709479c.1036C>Tp.Arg346Trpp.R346WQ9H2G4protein_codingdeleterious(0.05)probably_damaging(0.998)TCGA-A7-A26H-01Breastbreast invasive carcinomaFemale>=65I/IIHormone TherapyanastrozolePD
TSPYL2SNVMissense_Mutationc.1933N>Ap.Glu645Lysp.E645KQ9H2G4protein_codingdeleterious_low_confidence(0.02)probably_damaging(0.956)TCGA-AC-A23H-01Breastbreast invasive carcinomaFemale>=65I/IIUnknownUnknownPD
TSPYL2SNVMissense_Mutationnovelc.1993N>Tp.Gly665Trpp.G665WQ9H2G4protein_codingdeleterious_low_confidence(0.01)possibly_damaging(0.717)TCGA-AC-A8OQ-01Breastbreast invasive carcinomaFemale>=65I/IIUnknownUnknownSD
TSPYL2SNVMissense_Mutationc.963N>Cp.Met321Ilep.M321IQ9H2G4protein_codingtolerated(0.11)possibly_damaging(0.869)TCGA-BH-A18G-01Breastbreast invasive carcinomaFemale>=65I/IIUnknownUnknownSD
TSPYL2SNVMissense_Mutationc.923N>Cp.Met308Thrp.M308TQ9H2G4protein_codingdeleterious(0)possibly_damaging(0.751)TCGA-BH-A18U-01Breastbreast invasive carcinomaFemale>=65III/IVUnknownUnknownSD
TSPYL2SNVMissense_Mutationnovelc.1714G>Ap.Glu572Lysp.E572KQ9H2G4protein_codingdeleterious_low_confidence(0)probably_damaging(0.956)TCGA-C8-A8HQ-01Breastbreast invasive carcinomaFemale<65I/IIUnknownUnknownSD
TSPYL2SNVMissense_Mutationnovelc.1792N>Ap.Asp598Asnp.D598NQ9H2G4protein_codingdeleterious_low_confidence(0)probably_damaging(0.977)TCGA-D8-A1J9-01Breastbreast invasive carcinomaFemale<65I/IIUnknownUnknownSD
TSPYL2SNVMissense_Mutationnovelc.1699G>Ap.Glu567Lysp.E567KQ9H2G4protein_codingdeleterious_low_confidence(0)benign(0.135)TCGA-D8-A1XW-01Breastbreast invasive carcinomaFemale<65I/IIChemotherapyadriamycin+cyclophosphamideSD
TSPYL2SNVMissense_Mutationrs782211234c.1369G>Ap.Glu457Lysp.E457KQ9H2G4protein_codingdeleterious_low_confidence(0)possibly_damaging(0.899)TCGA-EW-A6SD-01Breastbreast invasive carcinomaFemale<65I/IIChemotherapytchSD
TSPYL2insertionFrame_Shift_Insnovelc.1379_1380insCACTGGGTGGGATATAACTGTATTTATATGCp.Tyr461ThrfsTer16p.Y461Tfs*16Q9H2G4protein_codingTCGA-A8-A0A4-01Breastbreast invasive carcinomaFemale>=65I/IIHormone TherapytamoxiphenCR
Page: 1 2 3 4 5 6 7 8 9 10 

Top

Related drugs of malignant transformation related genes

check buttonIdentification of chemicals and drugs interact with genes involved in malignant transfromation
(DGIdb 4.0)
Entrez IDSymbolCategoryInteraction TypesDrug Claim NameDrug NamePMIDs
64061TSPYL2NABROMODEOXYURIDINE11395479
64061TSPYL2NARETINOIC ACID15823505
64061TSPYL2NATGFBETA115823505
64061TSPYL2NASODIUM BUTYRATE12619135
Page: 1