
|
|||||
|
 | |
| |
| |
| |
| |
| |
|
Gene: TSPYL1 |
Gene summary for TSPYL1 |
| Gene information | Species | Human | Gene symbol | TSPYL1 | Gene ID | 7259 |
| Gene name | TSPY like 1 | |
| Gene Alias | TSPYL | |
| Cytomap | 6q22.1 | |
| Gene Type | protein-coding | GO ID | GO:0006323 | UniProtAcc | Q9H0U9 |
Top |
Malignant transformation analysis |
| Identification of the aberrant gene expression in precancerous and cancerous lesions by comparing the gene expression of stem-like cells in diseased tissues with normal stem cells |
| Entrez ID | Symbol | Replicates | Species | Organ | Tissue | Adj P-value | Log2FC | Malignancy |
| 7259 | TSPYL1 | HTA11_3410_2000001011 | Human | Colorectum | AD | 3.24e-06 | 1.95e-01 | 0.0155 |
| 7259 | TSPYL1 | HTA11_1938_2000001011 | Human | Colorectum | AD | 5.25e-08 | 3.80e-01 | -0.0811 |
| 7259 | TSPYL1 | HTA11_78_2000001011 | Human | Colorectum | AD | 2.13e-13 | 4.23e-01 | -0.1088 |
| 7259 | TSPYL1 | HTA11_347_2000001011 | Human | Colorectum | AD | 3.61e-27 | 6.42e-01 | -0.1954 |
| 7259 | TSPYL1 | HTA11_411_2000001011 | Human | Colorectum | SER | 1.44e-02 | 5.06e-01 | -0.2602 |
| 7259 | TSPYL1 | HTA11_696_2000001011 | Human | Colorectum | AD | 7.90e-05 | 1.70e-01 | -0.1464 |
| 7259 | TSPYL1 | HTA11_866_2000001011 | Human | Colorectum | AD | 9.54e-03 | 1.92e-01 | -0.1001 |
| 7259 | TSPYL1 | HTA11_1391_2000001011 | Human | Colorectum | AD | 5.07e-08 | 3.34e-01 | -0.059 |
| 7259 | TSPYL1 | HTA11_2992_2000001011 | Human | Colorectum | SER | 4.87e-05 | 3.47e-01 | -0.1706 |
| 7259 | TSPYL1 | HTA11_5212_2000001011 | Human | Colorectum | AD | 7.50e-04 | 2.69e-01 | -0.2061 |
| 7259 | TSPYL1 | HTA11_7862_2000001011 | Human | Colorectum | AD | 9.11e-12 | 4.50e-01 | -0.0179 |
| 7259 | TSPYL1 | HTA11_866_3004761011 | Human | Colorectum | AD | 7.42e-09 | 2.87e-01 | 0.096 |
| 7259 | TSPYL1 | HTA11_4255_2000001011 | Human | Colorectum | SER | 1.51e-02 | 2.76e-01 | 0.0446 |
| 7259 | TSPYL1 | HTA11_10623_2000001011 | Human | Colorectum | AD | 2.69e-03 | 3.03e-01 | -0.0177 |
| 7259 | TSPYL1 | HTA11_6801_2000001011 | Human | Colorectum | SER | 2.06e-06 | 6.37e-01 | 0.0171 |
| 7259 | TSPYL1 | HTA11_7696_3000711011 | Human | Colorectum | AD | 2.73e-05 | 2.40e-01 | 0.0674 |
| 7259 | TSPYL1 | HTA11_7469_2000001011 | Human | Colorectum | AD | 4.14e-03 | 5.35e-01 | -0.0124 |
| 7259 | TSPYL1 | HTA11_6818_2000001021 | Human | Colorectum | AD | 3.26e-03 | 2.33e-01 | 0.0588 |
| 7259 | TSPYL1 | HTA11_99999970781_79442 | Human | Colorectum | MSS | 1.36e-16 | 3.64e-01 | 0.294 |
| 7259 | TSPYL1 | HTA11_99999965062_69753 | Human | Colorectum | MSI-H | 2.03e-02 | 7.75e-01 | 0.3487 |
| Page: 1 2 3 4 5 6 7 |
| Tissue | Expression Dynamics | Abbreviation |
| Colorectum (GSE201348) | 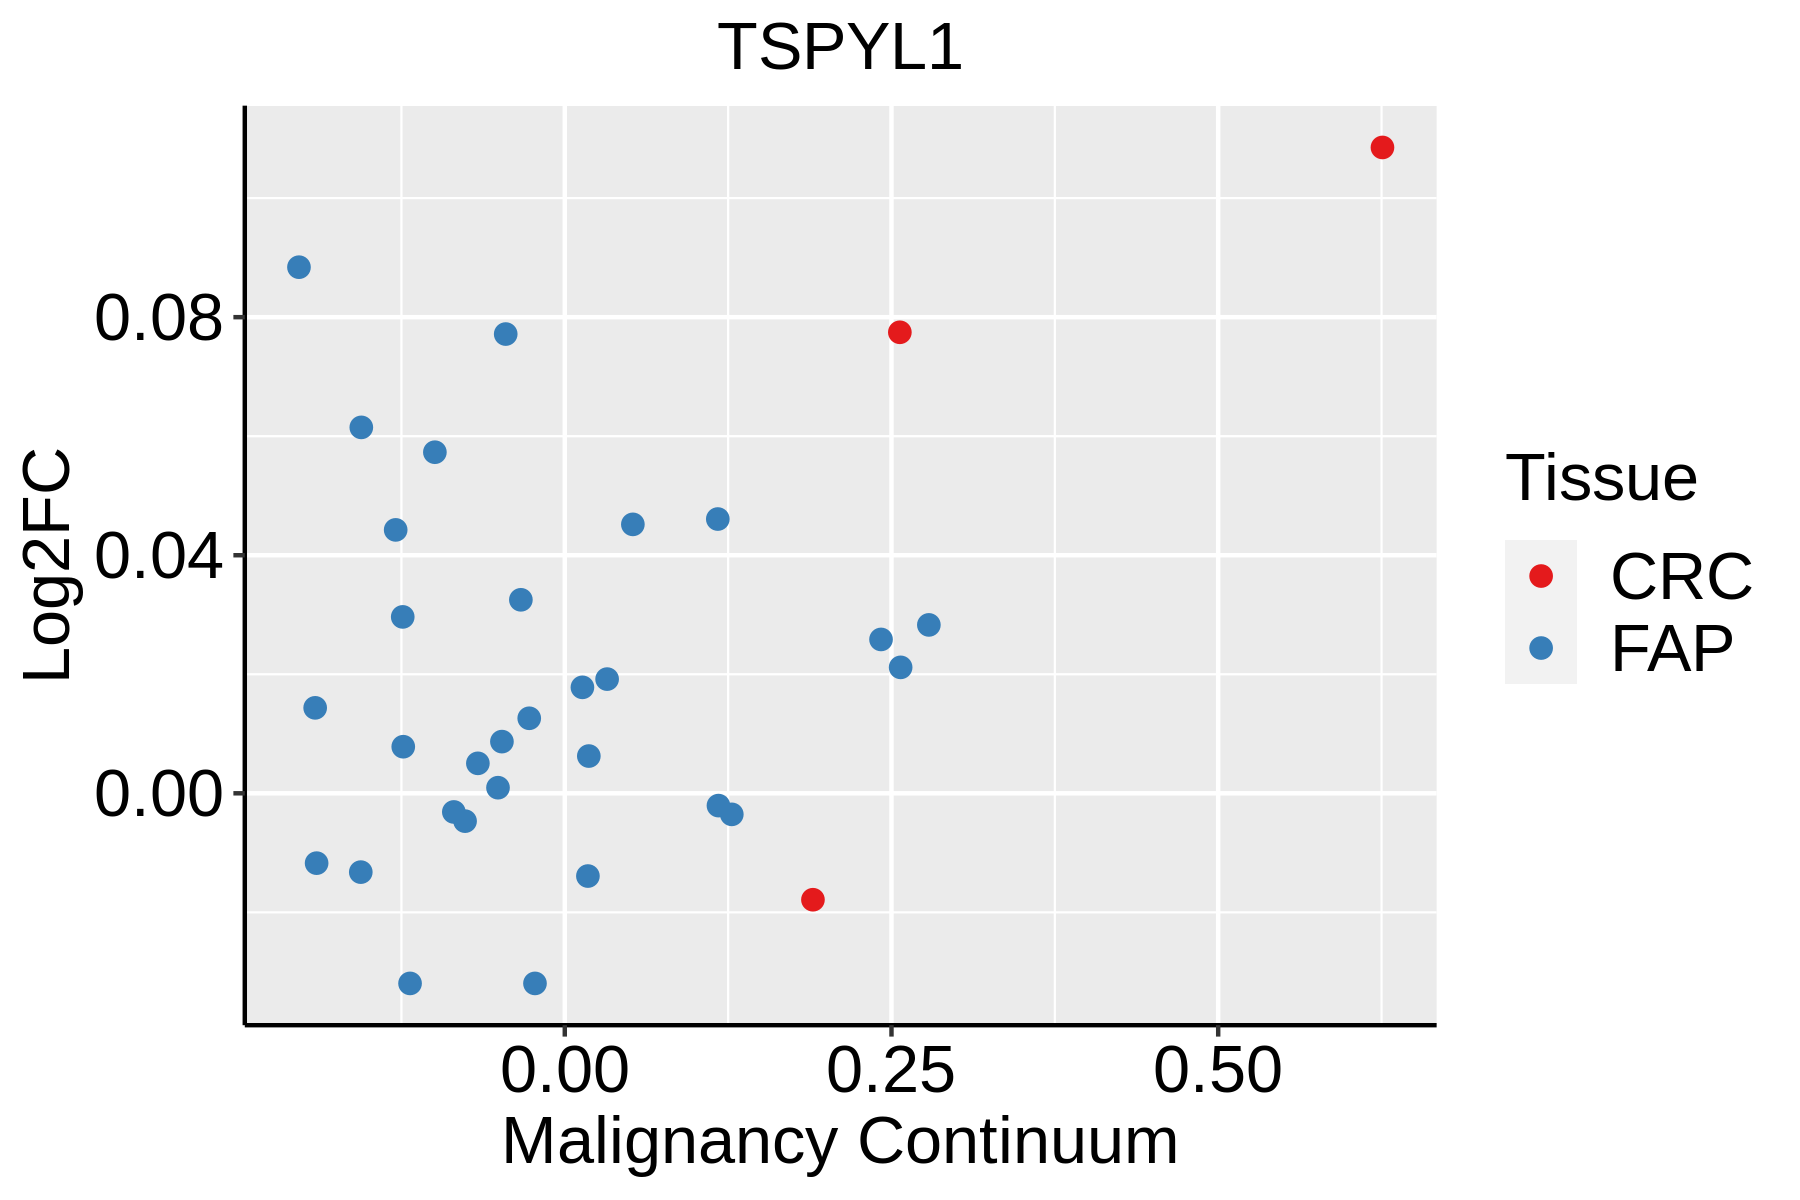 | FAP: Familial adenomatous polyposis |
| CRC: Colorectal cancer | ||
| Colorectum (HTA11) |  | AD: Adenomas |
| SER: Sessile serrated lesions | ||
| MSI-H: Microsatellite-high colorectal cancer | ||
| MSS: Microsatellite stable colorectal cancer | ||
| Esophagus |  | ESCC: Esophageal squamous cell carcinoma |
| HGIN: High-grade intraepithelial neoplasias | ||
| LGIN: Low-grade intraepithelial neoplasias | ||
| Liver |  | HCC: Hepatocellular carcinoma |
| NAFLD: Non-alcoholic fatty liver disease | ||
| Oral Cavity | 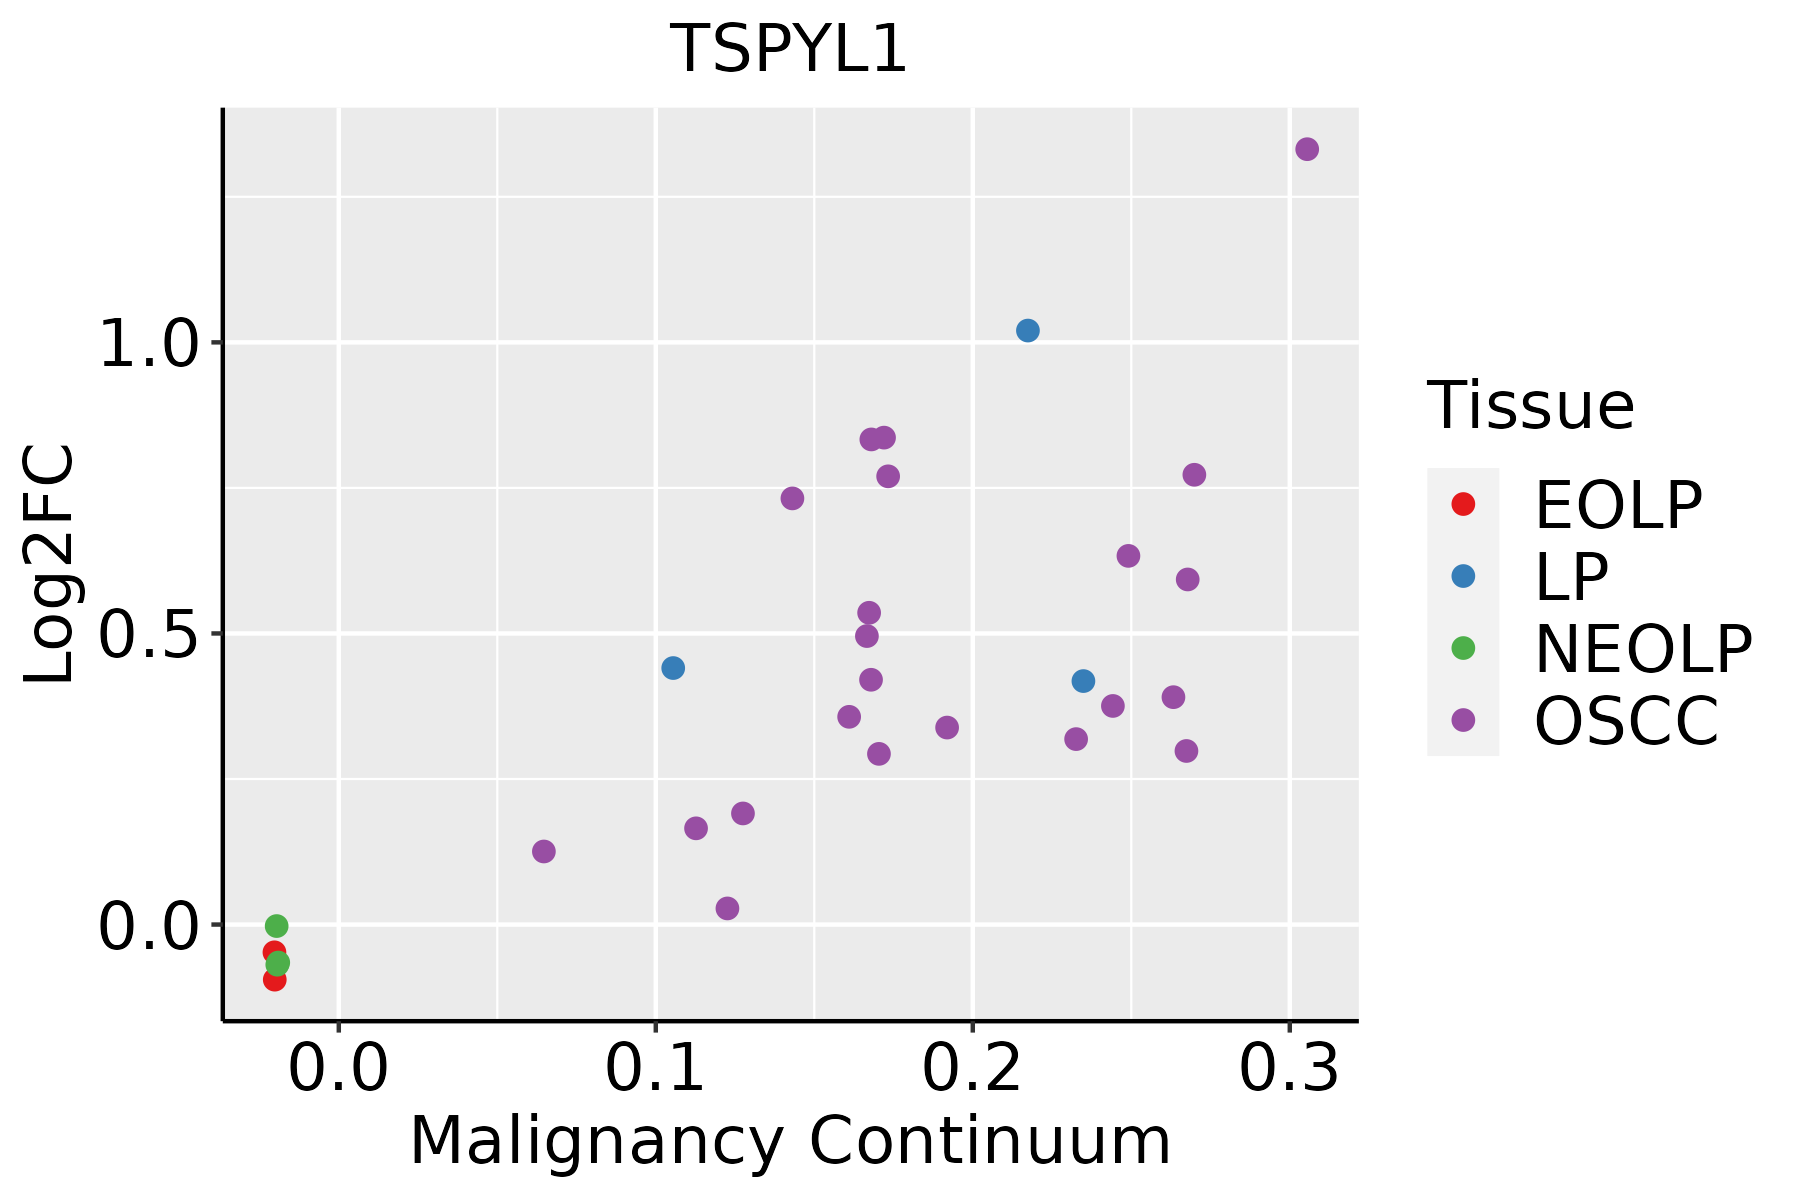 | EOLP: Erosive Oral lichen planus |
| LP: leukoplakia | ||
| NEOLP: Non-erosive oral lichen planus | ||
| OSCC: Oral squamous cell carcinoma | ||
| Skin | 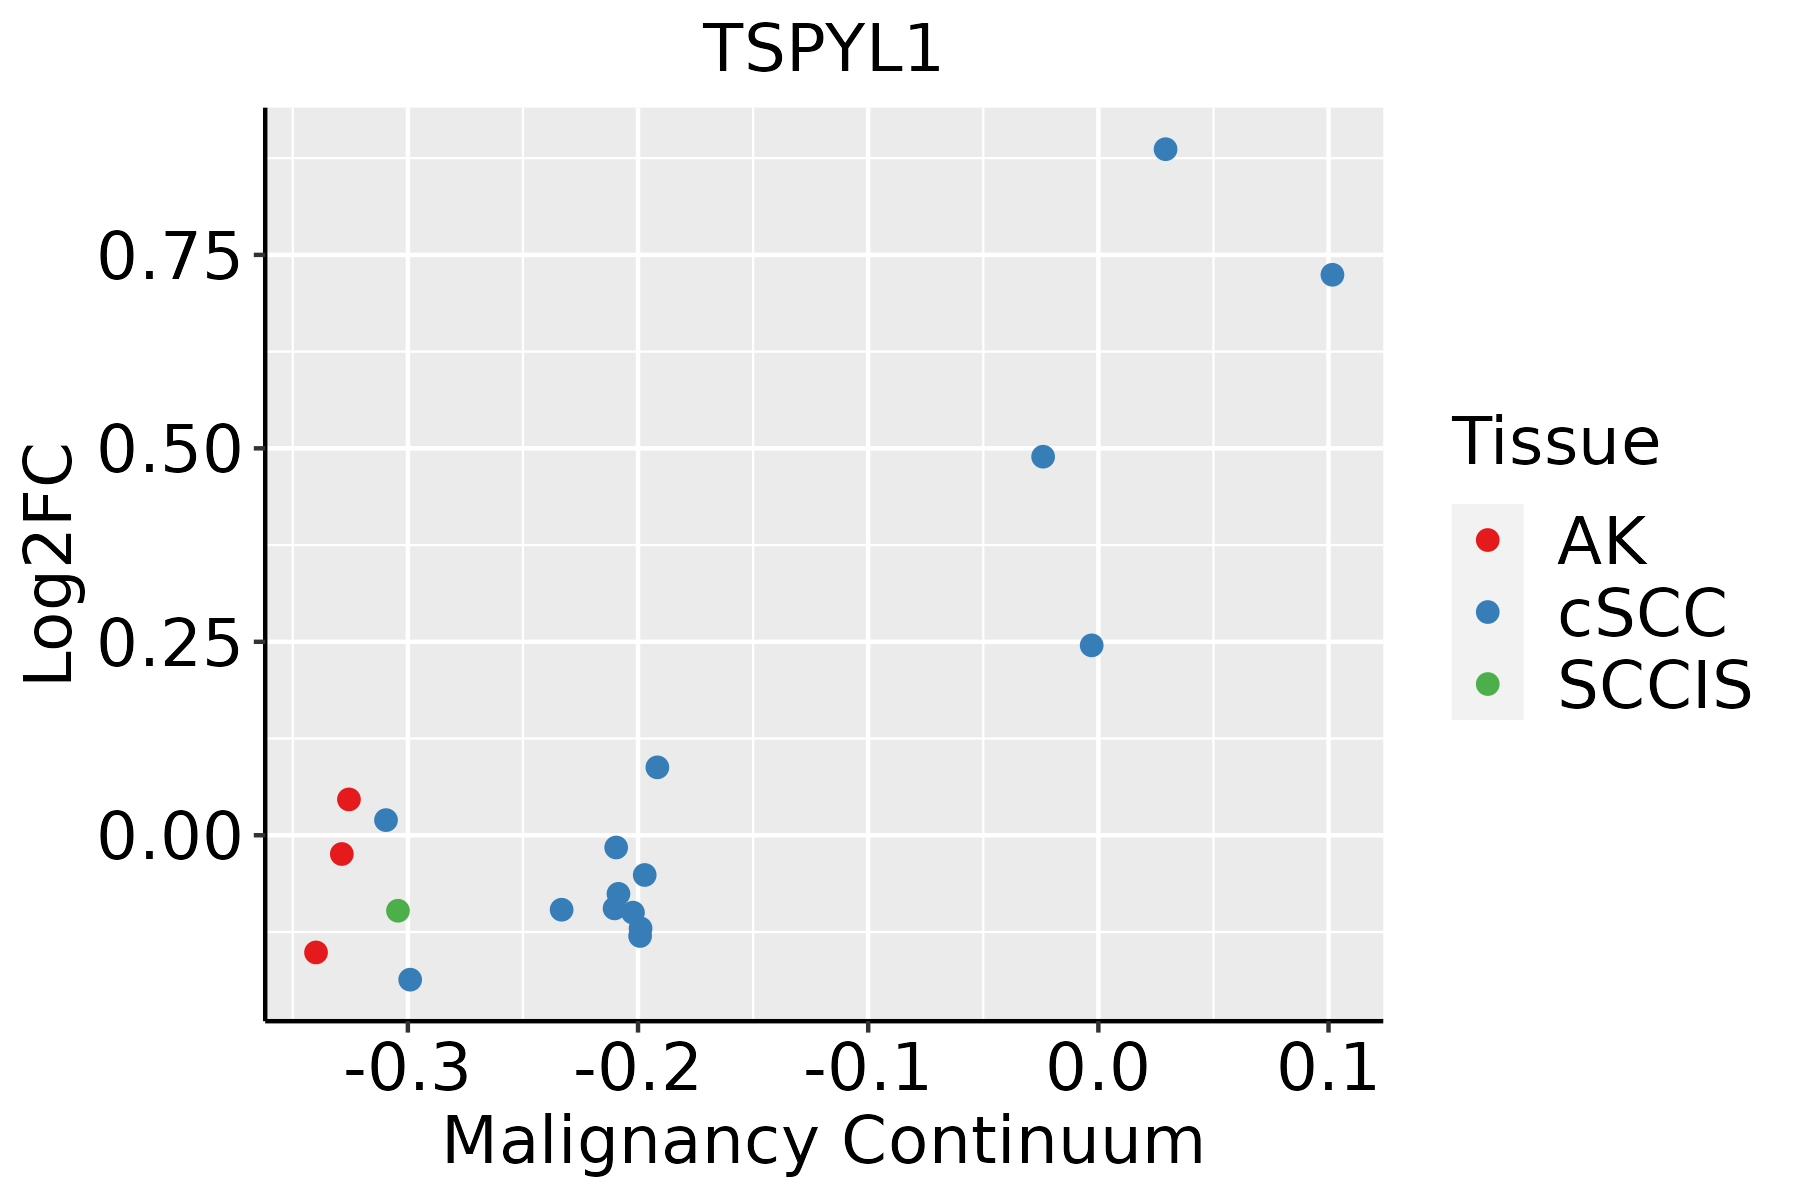 | AK: Actinic keratosis |
| cSCC: Cutaneous squamous cell carcinoma | ||
| SCCIS:squamous cell carcinoma in situ | ||
| Thyroid |  | ATC: Anaplastic thyroid cancer |
| HT: Hashimoto's thyroiditis | ||
| PTC: Papillary thyroid cancer |
| ∗log2FC in expression of this searched gene in stem-like cells from each diseased tissue sample relative to stem-like cells in normal samples in each tissue plotted against the malignancy continuum. Samples are colored based on if they are from different disease stage. |
Top |
Malignant transformation related pathway analysis |
| Find out the enriched GO biological processes and KEGG pathways involved in transition from healthy to precancer to cancer |
| Tissue | Disease Stage | Enriched GO biological Processes |
| Colorectum | AD |  |
| Colorectum | SER |  |
| Colorectum | MSS |  |
| Colorectum | MSI-H |  |
| Colorectum | FAP |  |
| ∗Top 15 enriched GO BP terms are showed in the bar plot of each disease state in each tissue. Each row represents a significant GO biological process which is colored according to the -log10(p.adjust). |
| Page: 1 2 3 4 5 6 7 8 9 |
| GO ID | Tissue | Disease Stage | Description | Gene Ratio | Bg Ratio | pvalue | p.adjust | Count |
| GO:0006325 | Colorectum | AD | chromatin organization | 119/3918 | 409/18723 | 4.85e-05 | 8.33e-04 | 119 |
| GO:0006338 | Colorectum | AD | chromatin remodeling | 70/3918 | 255/18723 | 7.44e-03 | 4.53e-02 | 70 |
| GO:00063251 | Colorectum | SER | chromatin organization | 89/2897 | 409/18723 | 4.15e-04 | 6.17e-03 | 89 |
| GO:00063252 | Colorectum | MSS | chromatin organization | 107/3467 | 409/18723 | 7.22e-05 | 1.21e-03 | 107 |
| GO:000632517 | Esophagus | ESCC | chromatin organization | 240/8552 | 409/18723 | 6.52e-08 | 1.14e-06 | 240 |
| GO:000632511 | Liver | HCC | chromatin organization | 206/7958 | 409/18723 | 7.23e-04 | 4.41e-03 | 206 |
| GO:000632510 | Oral cavity | OSCC | chromatin organization | 190/7305 | 409/18723 | 1.17e-03 | 5.97e-03 | 190 |
| GO:000632519 | Skin | cSCC | chromatin organization | 147/4864 | 409/18723 | 4.41e-06 | 6.52e-05 | 147 |
| GO:000633812 | Skin | cSCC | chromatin remodeling | 94/4864 | 255/18723 | 7.58e-05 | 7.26e-04 | 94 |
| GO:00718241 | Skin | cSCC | protein-DNA complex subunit organization | 87/4864 | 241/18723 | 3.09e-04 | 2.47e-03 | 87 |
| GO:00711031 | Skin | cSCC | DNA conformation change | 96/4864 | 290/18723 | 3.87e-03 | 2.07e-02 | 96 |
| GO:000632520 | Thyroid | PTC | chromatin organization | 183/5968 | 409/18723 | 2.55e-08 | 5.70e-07 | 183 |
| GO:00063385 | Thyroid | PTC | chromatin remodeling | 106/5968 | 255/18723 | 6.56e-04 | 4.13e-03 | 106 |
| GO:0006325110 | Thyroid | ATC | chromatin organization | 189/6293 | 409/18723 | 6.40e-08 | 1.13e-06 | 189 |
| GO:000633813 | Thyroid | ATC | chromatin remodeling | 109/6293 | 255/18723 | 1.38e-03 | 7.15e-03 | 109 |
| GO:00718242 | Thyroid | ATC | protein-DNA complex subunit organization | 103/6293 | 241/18723 | 1.84e-03 | 9.03e-03 | 103 |
| Page: 1 |
| Pathway ID | Tissue | Disease Stage | Description | Gene Ratio | Bg Ratio | pvalue | p.adjust | qvalue | Count |
| Page: 1 |
Top |
Cell-cell communication analysis |
| Identification of potential cell-cell interactions between two cell types and their ligand-receptor pairs for different disease states |
| Ligand | Receptor | LRpair | Pathway | Tissue | Disease Stage |
| Page: 1 |
Top |
Single-cell gene regulatory network inference analysis |
| Find out the significant the regulons (TFs) and the target genes of each regulon across cell types for different disease states |
| TF | Cell Type | Tissue | Disease Stage | Target Gene | RSS | Regulon Activity |
| ∗The dot plots of a searched regulon are shown for all cell subpopulations in each disease state of each tissue based on the regulon specific score inferred using pySCENIC and by calculating the average expression. |
| Page: 1 |
Top |
Somatic mutation of malignant transformation related genes |
| Annotation of somatic variants for genes involved in malignant transformation |
| Hugo Symbol | Variant Class | Variant Classification | dbSNP RS | HGVSc | HGVSp | HGVSp Short | SWISSPROT | BIOTYPE | SIFT | PolyPhen | Tumor Sample Barcode | Tissue | Histology | Sex | Age | Stage | Therapy Types | Drugs | Outcome |
| TSPYL1 | SNV | Missense_Mutation | c.1049N>G | p.Ser350Cys | p.S350C | Q9H0U9 | protein_coding | tolerated(0.06) | benign(0.396) | TCGA-A1-A0SO-01 | Breast | breast invasive carcinoma | Female | >=65 | I/II | Chemotherapy | SD | ||
| TSPYL1 | SNV | Missense_Mutation | c.1220N>G | p.Tyr407Cys | p.Y407C | Q9H0U9 | protein_coding | deleterious(0) | probably_damaging(0.998) | TCGA-A8-A09Z-01 | Breast | breast invasive carcinoma | Female | >=65 | I/II | Unknown | Unknown | SD | |
| TSPYL1 | SNV | Missense_Mutation | novel | c.451G>A | p.Glu151Lys | p.E151K | Q9H0U9 | protein_coding | tolerated(1) | benign(0) | TCGA-C8-A1HE-01 | Breast | breast invasive carcinoma | Female | <65 | I/II | Unknown | Unknown | SD |
| TSPYL1 | SNV | Missense_Mutation | novel | c.947G>A | p.Arg316Lys | p.R316K | Q9H0U9 | protein_coding | tolerated(0.09) | benign(0.241) | TCGA-E2-A574-01 | Breast | breast invasive carcinoma | Female | <65 | I/II | Chemotherapy | adriamycin | SD |
| TSPYL1 | SNV | Missense_Mutation | novel | c.313N>A | p.Ala105Thr | p.A105T | Q9H0U9 | protein_coding | tolerated(1) | benign(0.001) | TCGA-OL-A5RY-01 | Breast | breast invasive carcinoma | Female | <65 | I/II | Unknown | Unknown | SD |
| TSPYL1 | insertion | In_Frame_Ins | novel | c.698_699insTTTCATTTTGGCTCTGTCATTTTCAGAGGCAAAGAAGTT | p.Glu233delinsAspPheIleLeuAlaLeuSerPheSerGluAlaLysLysLeu | p.E233delinsDFILALSFSEAKKL | Q9H0U9 | protein_coding | TCGA-A8-A07R-01 | Breast | breast invasive carcinoma | Female | >=65 | III/IV | Ancillary | zoledronic | SD | ||
| TSPYL1 | SNV | Missense_Mutation | novel | c.214C>A | p.Gln72Lys | p.Q72K | Q9H0U9 | protein_coding | tolerated(0.41) | benign(0.003) | TCGA-2W-A8YY-01 | Cervix | cervical & endocervical cancer | Female | <65 | I/II | Chemotherapy | cisplatin | CR |
| TSPYL1 | SNV | Missense_Mutation | novel | c.851N>A | p.Arg284Gln | p.R284Q | Q9H0U9 | protein_coding | tolerated(0.05) | benign(0.19) | TCGA-EA-A3HS-01 | Cervix | cervical & endocervical cancer | Female | <65 | I/II | Unknown | Unknown | SD |
| TSPYL1 | SNV | Missense_Mutation | c.824N>A | p.Ile275Asn | p.I275N | Q9H0U9 | protein_coding | deleterious(0) | probably_damaging(0.997) | TCGA-EK-A2PG-01 | Cervix | cervical & endocervical cancer | Female | >=65 | I/II | Unknown | Unknown | SD | |
| TSPYL1 | SNV | Missense_Mutation | rs377352006 | c.316G>A | p.Glu106Lys | p.E106K | Q9H0U9 | protein_coding | tolerated(0.42) | benign(0.196) | TCGA-VS-A9UD-01 | Cervix | cervical & endocervical cancer | Female | >=65 | III/IV | Chemotherapy | cisplatin | CR |
| Page: 1 2 3 4 |
Top |
Related drugs of malignant transformation related genes |
| Identification of chemicals and drugs interact with genes involved in malignant transfromation |
| (DGIdb 4.0) |
| Entrez ID | Symbol | Category | Interaction Types | Drug Claim Name | Drug Name | PMIDs |
| 7259 | TSPYL1 | NA | prednisolone | PREDNISOLONE | ||
| 7259 | TSPYL1 | NA | abiraterone | ABIRATERONE |
| Page: 1 |

Copyright 2023-Present -The University of Texas Health Science Center at Houston |