
|
|||||
|
 | |
| |
| |
| |
| |
| |
|
Gene: TSPAN9 |
Gene summary for TSPAN9 |
| Gene information | Species | Human | Gene symbol | TSPAN9 | Gene ID | 10867 |
| Gene name | tetraspanin 9 | |
| Gene Alias | NET-5 | |
| Cytomap | 12p13.33-p13.32 | |
| Gene Type | protein-coding | GO ID | GO:0008150 | UniProtAcc | O75954 |
Top |
Malignant transformation analysis |
| Identification of the aberrant gene expression in precancerous and cancerous lesions by comparing the gene expression of stem-like cells in diseased tissues with normal stem cells |
| Entrez ID | Symbol | Replicates | Species | Organ | Tissue | Adj P-value | Log2FC | Malignancy |
| 10867 | TSPAN9 | CCI_2 | Human | Cervix | CC | 6.00e-07 | 8.84e-01 | 0.5249 |
| 10867 | TSPAN9 | CCI_3 | Human | Cervix | CC | 4.14e-09 | 1.02e+00 | 0.516 |
| 10867 | TSPAN9 | HTA11_2487_2000001011 | Human | Colorectum | SER | 4.49e-04 | 3.05e-01 | -0.1808 |
| 10867 | TSPAN9 | HTA11_2951_2000001011 | Human | Colorectum | AD | 3.05e-02 | 4.66e-01 | 0.0216 |
| 10867 | TSPAN9 | HTA11_1938_2000001011 | Human | Colorectum | AD | 2.93e-03 | 2.60e-01 | -0.0811 |
| 10867 | TSPAN9 | HTA11_347_2000001011 | Human | Colorectum | AD | 3.50e-13 | 3.91e-01 | -0.1954 |
| 10867 | TSPAN9 | HTA11_2112_2000001011 | Human | Colorectum | SER | 2.50e-02 | 5.64e-01 | -0.2196 |
| 10867 | TSPAN9 | HTA11_3361_2000001011 | Human | Colorectum | AD | 3.58e-04 | 4.04e-01 | -0.1207 |
| 10867 | TSPAN9 | HTA11_696_2000001011 | Human | Colorectum | AD | 8.53e-05 | 3.53e-01 | -0.1464 |
| 10867 | TSPAN9 | HTA11_866_2000001011 | Human | Colorectum | AD | 3.98e-09 | 4.32e-01 | -0.1001 |
| 10867 | TSPAN9 | HTA11_1391_2000001011 | Human | Colorectum | AD | 1.35e-09 | 4.55e-01 | -0.059 |
| 10867 | TSPAN9 | HTA11_5216_2000001011 | Human | Colorectum | SER | 4.86e-03 | 5.32e-01 | -0.1462 |
| 10867 | TSPAN9 | HTA11_546_2000001011 | Human | Colorectum | AD | 1.85e-04 | 4.13e-01 | -0.0842 |
| 10867 | TSPAN9 | HTA11_866_3004761011 | Human | Colorectum | AD | 3.13e-17 | 5.35e-01 | 0.096 |
| 10867 | TSPAN9 | HTA11_4255_2000001011 | Human | Colorectum | SER | 1.30e-04 | 5.32e-01 | 0.0446 |
| 10867 | TSPAN9 | HTA11_8622_2000001021 | Human | Colorectum | SER | 2.66e-05 | 4.51e-01 | 0.0528 |
| 10867 | TSPAN9 | HTA11_7663_2000001011 | Human | Colorectum | SER | 1.80e-02 | 5.63e-01 | 0.0131 |
| 10867 | TSPAN9 | HTA11_10711_2000001011 | Human | Colorectum | AD | 1.05e-03 | 2.94e-01 | 0.0338 |
| 10867 | TSPAN9 | HTA11_7696_3000711011 | Human | Colorectum | AD | 1.55e-04 | 3.08e-01 | 0.0674 |
| 10867 | TSPAN9 | HTA11_6818_2000001011 | Human | Colorectum | AD | 7.38e-10 | 9.11e-01 | 0.0112 |
| Page: 1 2 3 4 5 6 7 |
| Tissue | Expression Dynamics | Abbreviation |
| Cervix |  | CC: Cervix cancer |
| HSIL_HPV: HPV-infected high-grade squamous intraepithelial lesions | ||
| N_HPV: HPV-infected normal cervix | ||
| Colorectum (GSE201348) | 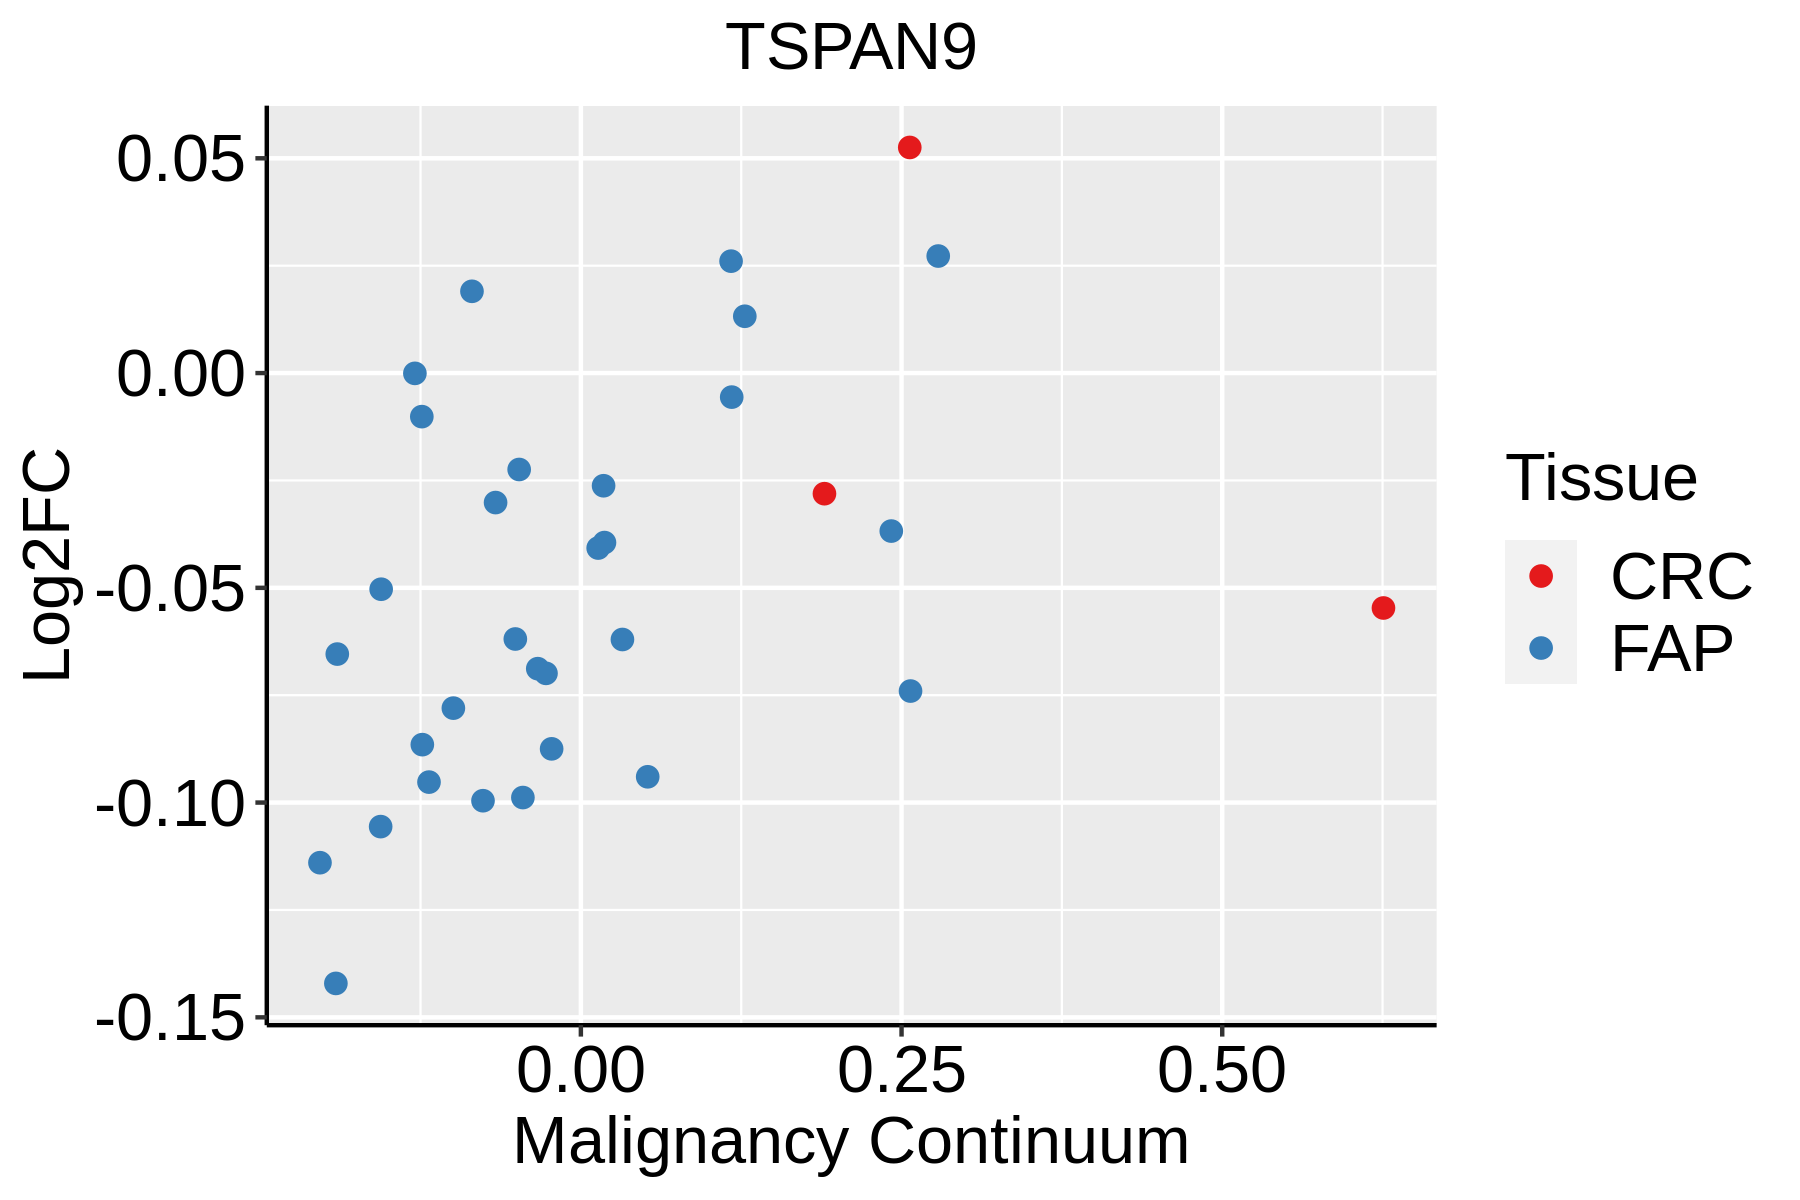 | FAP: Familial adenomatous polyposis |
| CRC: Colorectal cancer | ||
| Colorectum (HTA11) |  | AD: Adenomas |
| SER: Sessile serrated lesions | ||
| MSI-H: Microsatellite-high colorectal cancer | ||
| MSS: Microsatellite stable colorectal cancer | ||
| Esophagus | 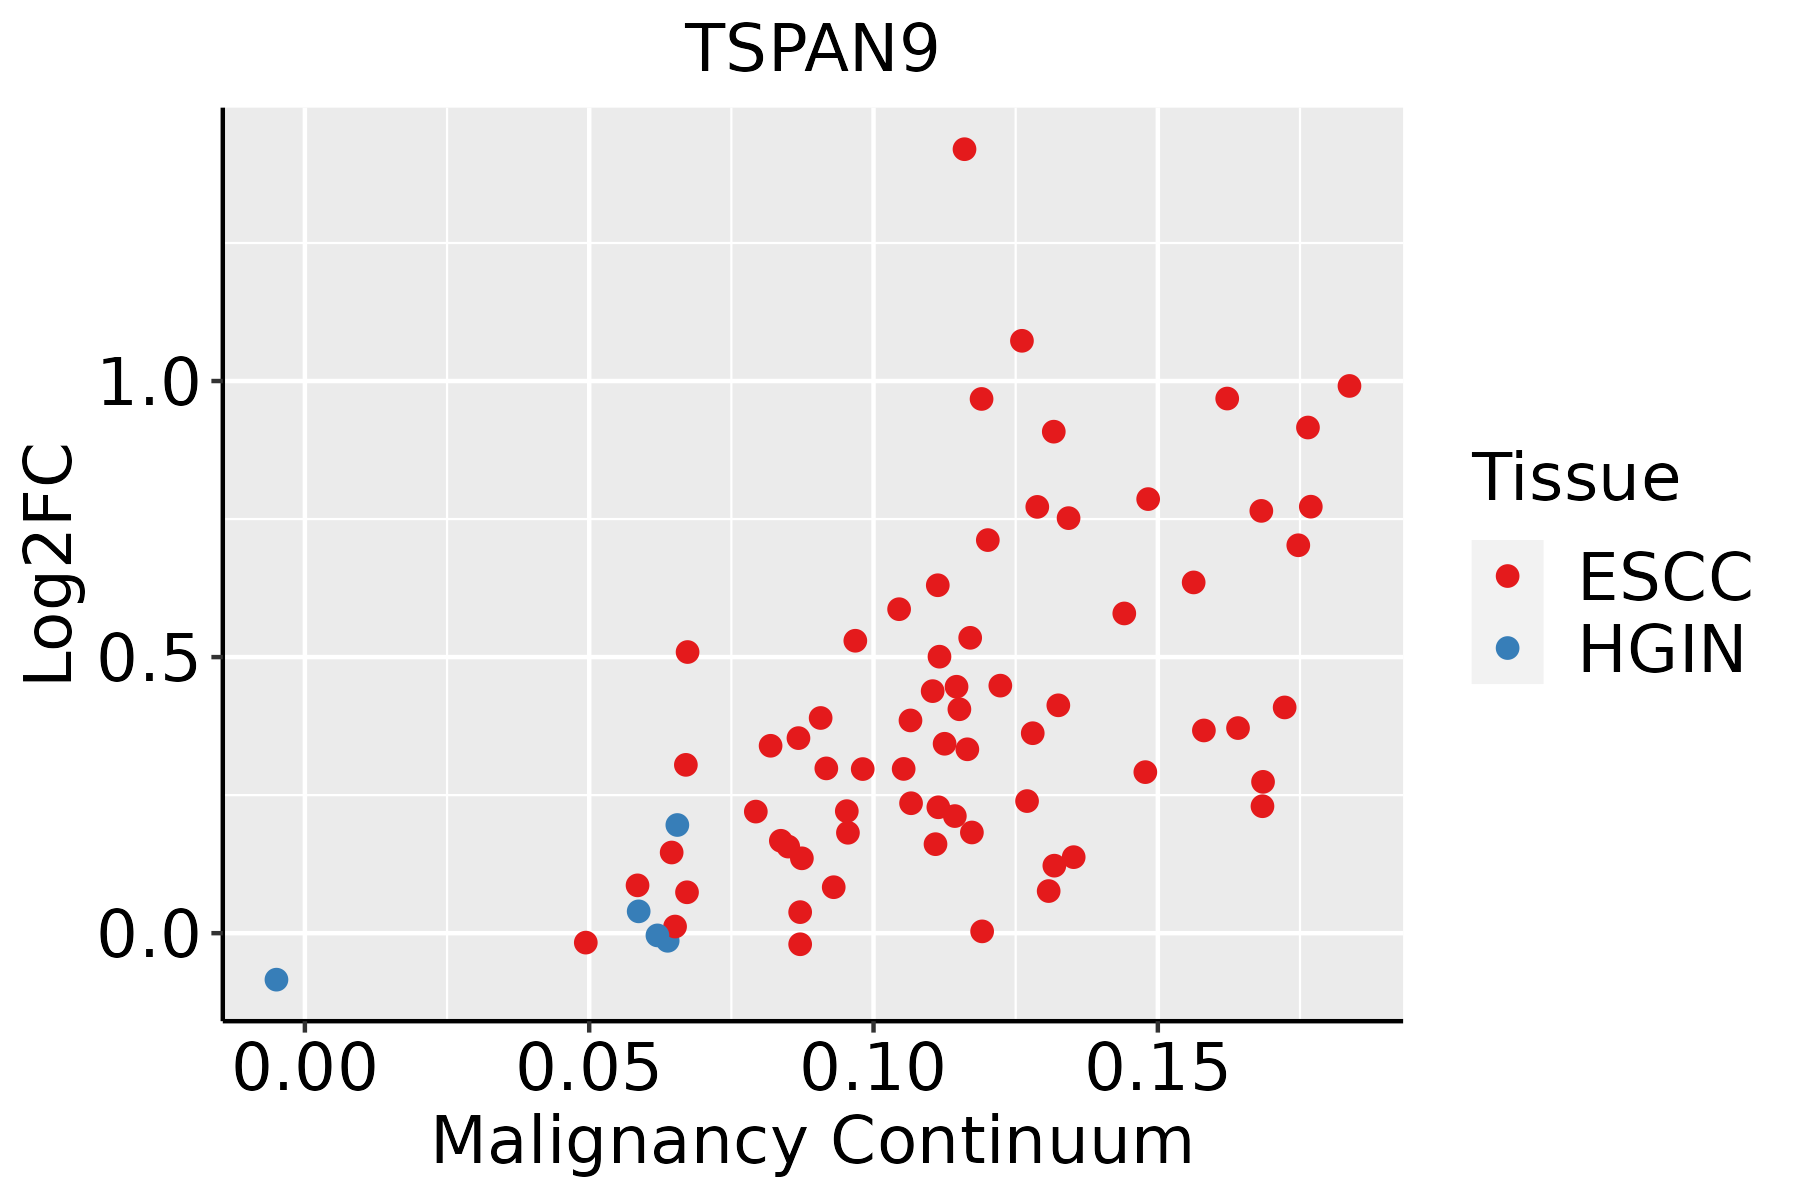 | ESCC: Esophageal squamous cell carcinoma |
| HGIN: High-grade intraepithelial neoplasias | ||
| LGIN: Low-grade intraepithelial neoplasias | ||
| Liver | 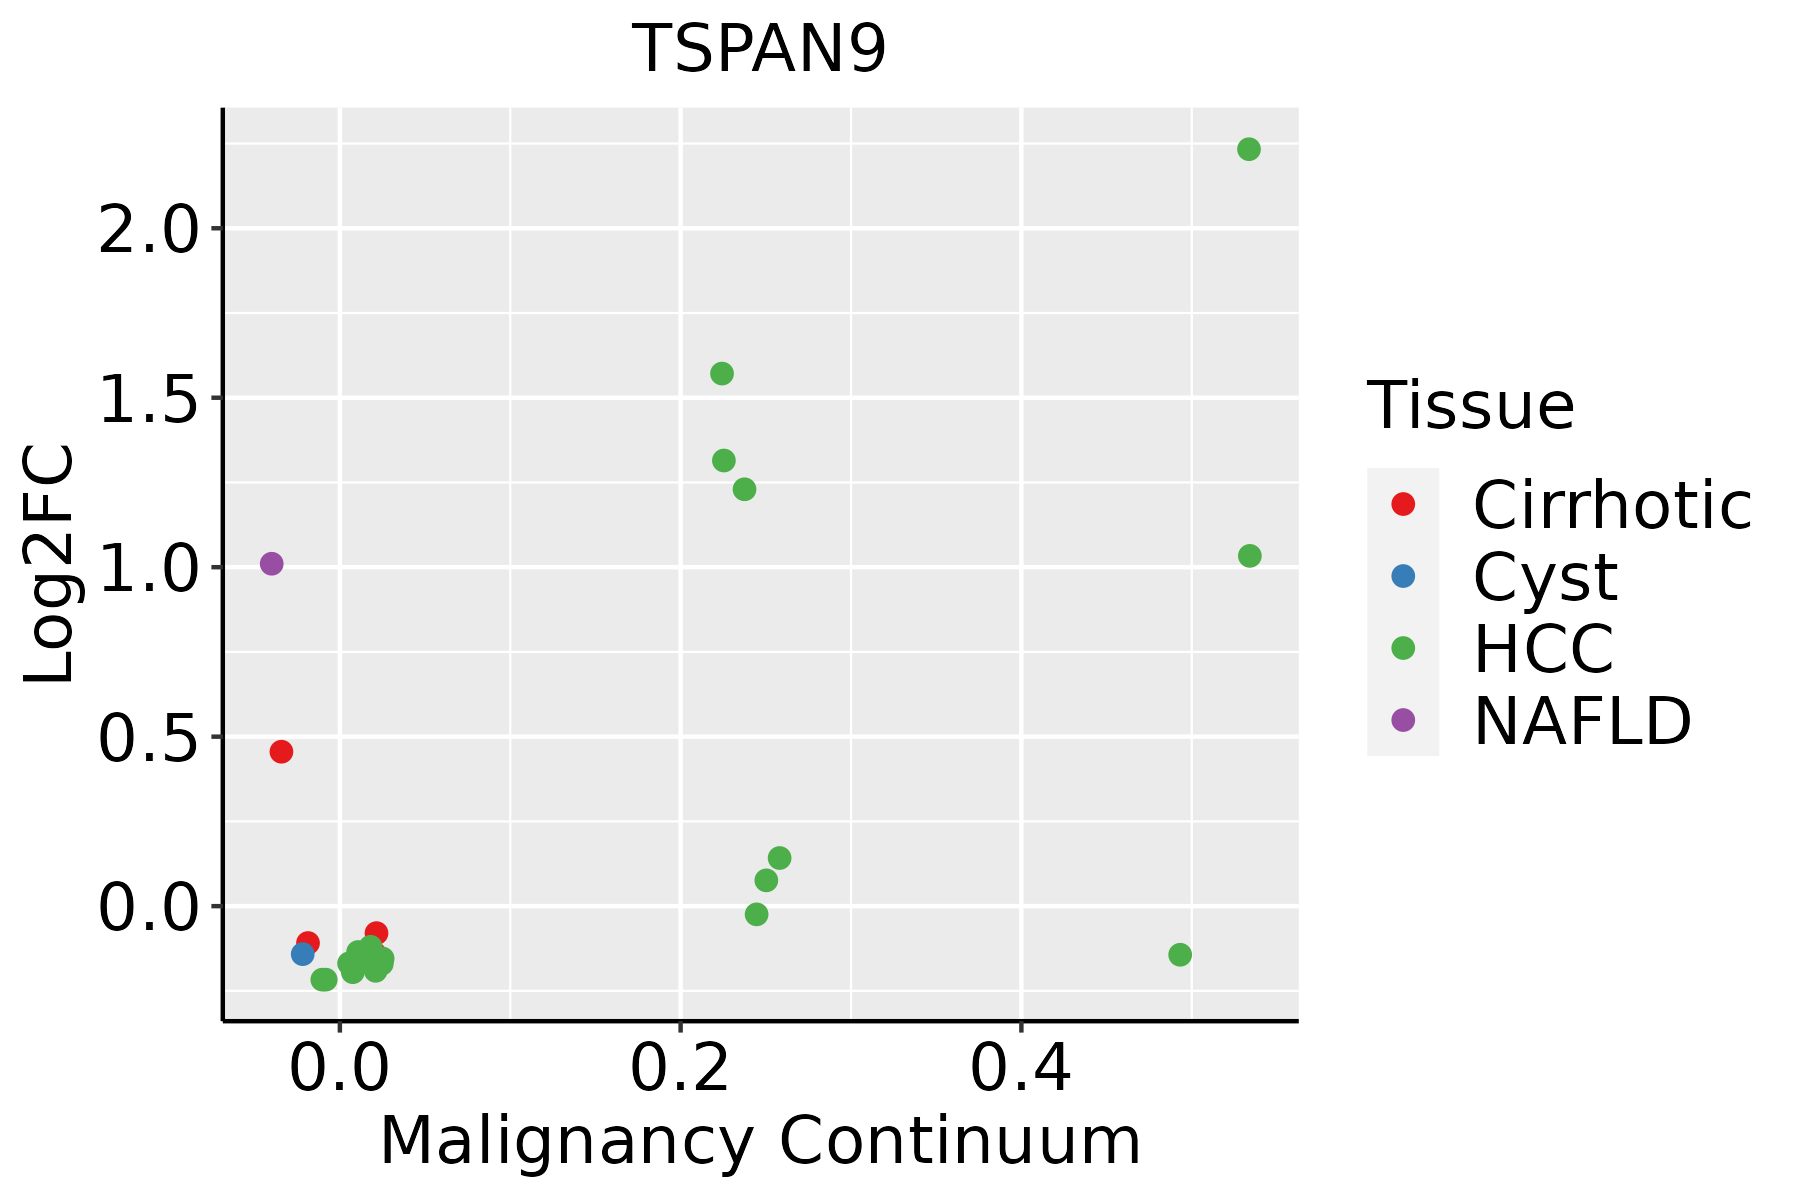 | HCC: Hepatocellular carcinoma |
| NAFLD: Non-alcoholic fatty liver disease | ||
| Oral Cavity | 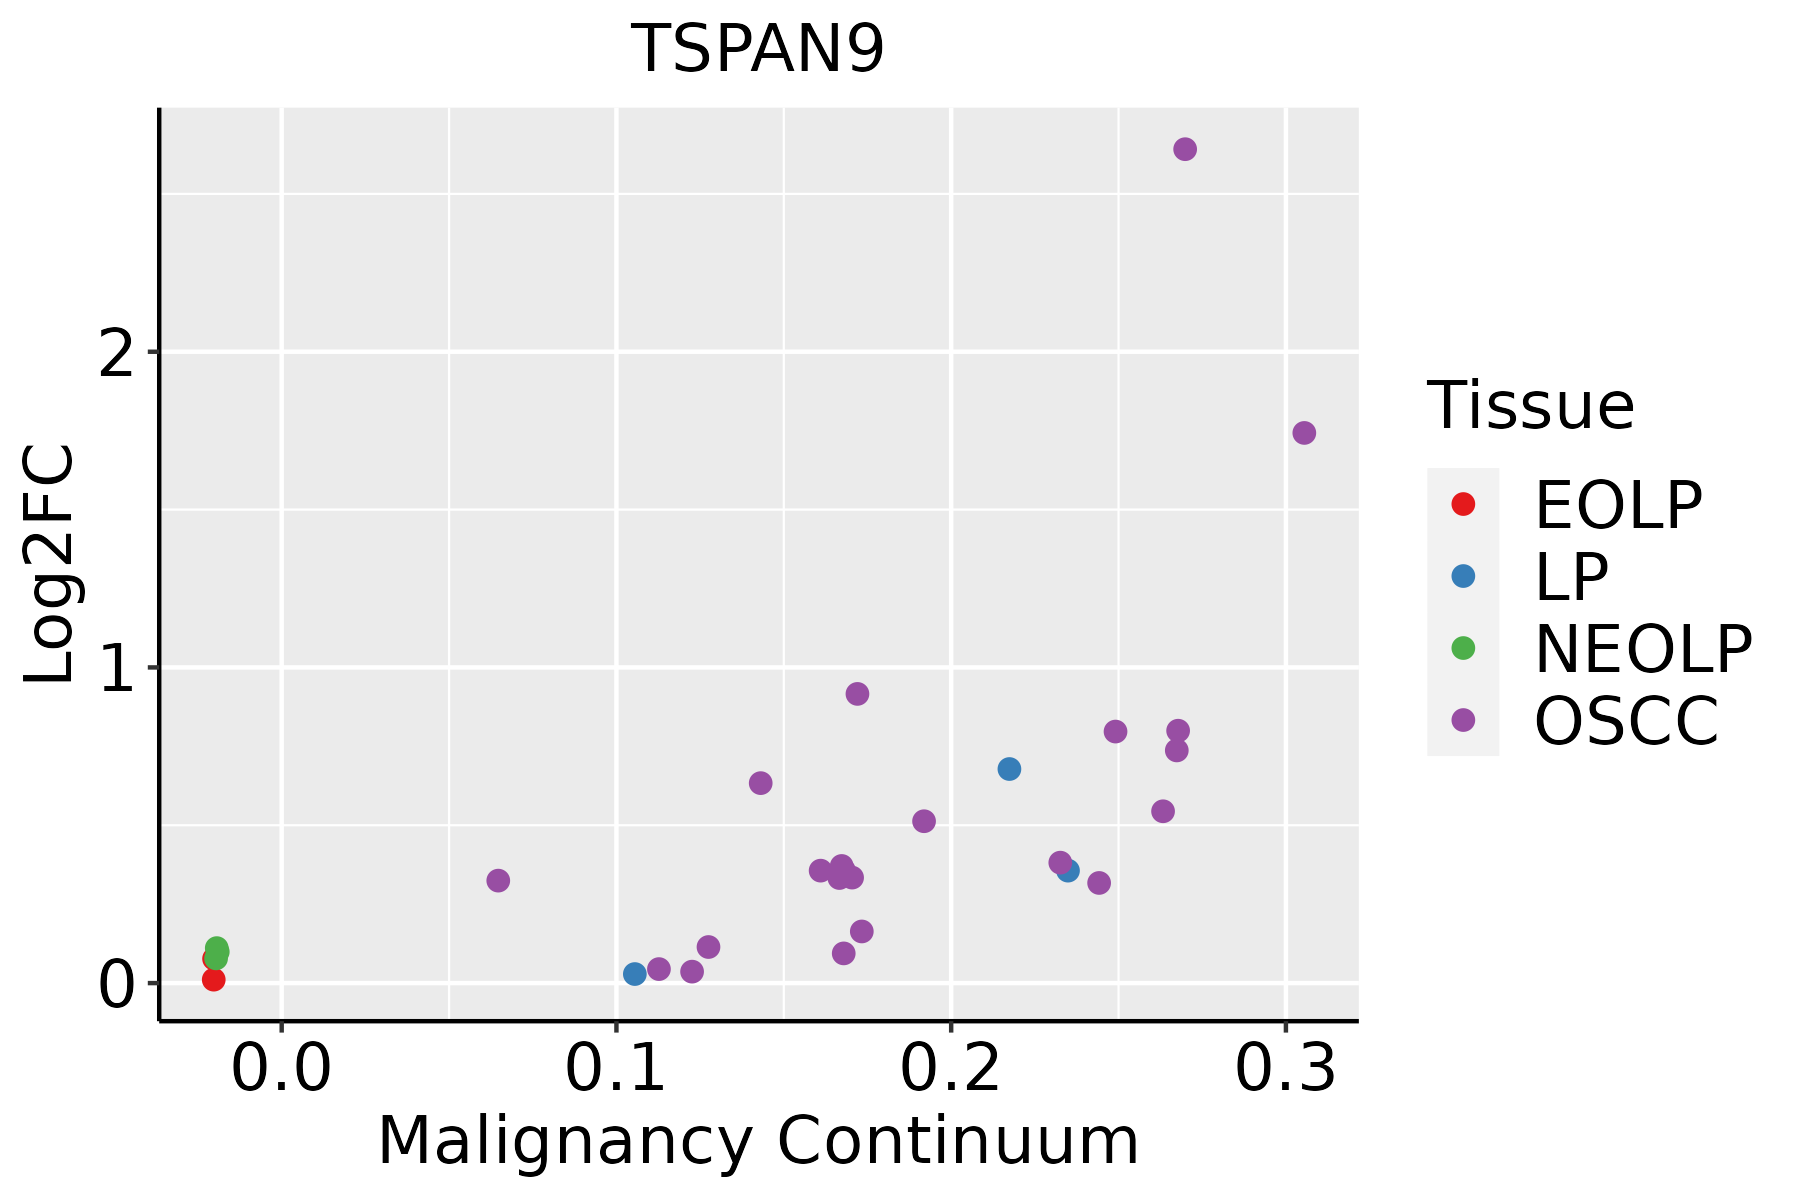 | EOLP: Erosive Oral lichen planus |
| LP: leukoplakia | ||
| NEOLP: Non-erosive oral lichen planus | ||
| OSCC: Oral squamous cell carcinoma | ||
| Skin | 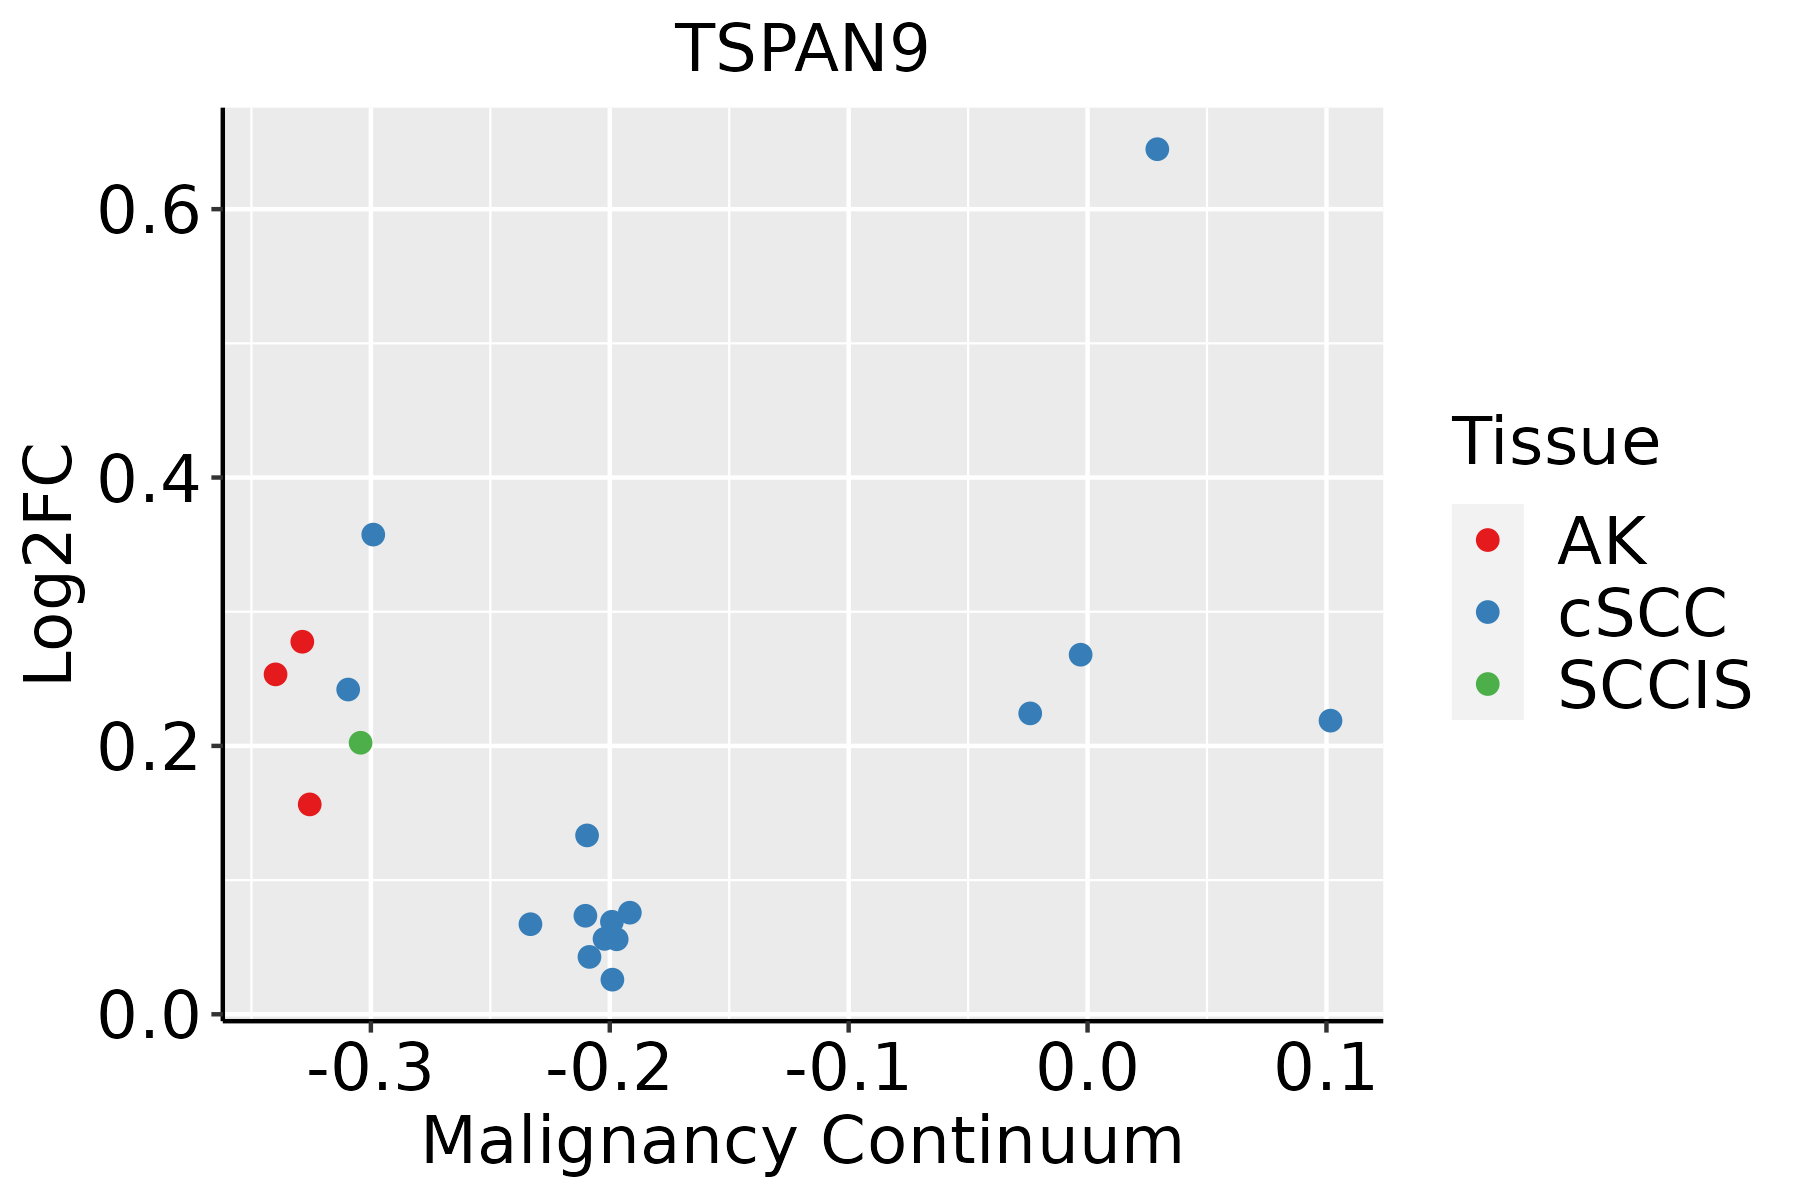 | AK: Actinic keratosis |
| cSCC: Cutaneous squamous cell carcinoma | ||
| SCCIS:squamous cell carcinoma in situ | ||
| Thyroid |  | ATC: Anaplastic thyroid cancer |
| HT: Hashimoto's thyroiditis | ||
| PTC: Papillary thyroid cancer |
| ∗log2FC in expression of this searched gene in stem-like cells from each diseased tissue sample relative to stem-like cells in normal samples in each tissue plotted against the malignancy continuum. Samples are colored based on if they are from different disease stage. |
Top |
Malignant transformation related pathway analysis |
| Find out the enriched GO biological processes and KEGG pathways involved in transition from healthy to precancer to cancer |
| Tissue | Disease Stage | Enriched GO biological Processes |
| Colorectum | AD |  |
| Colorectum | SER |  |
| Colorectum | MSS |  |
| Colorectum | MSI-H |  |
| Colorectum | FAP |  |
| ∗Top 15 enriched GO BP terms are showed in the bar plot of each disease state in each tissue. Each row represents a significant GO biological process which is colored according to the -log10(p.adjust). |
| Page: 1 2 3 4 5 6 7 8 9 |
| GO ID | Tissue | Disease Stage | Description | Gene Ratio | Bg Ratio | pvalue | p.adjust | Count |
| Page: 1 |
| Pathway ID | Tissue | Disease Stage | Description | Gene Ratio | Bg Ratio | pvalue | p.adjust | qvalue | Count |
| Page: 1 |
Top |
Cell-cell communication analysis |
| Identification of potential cell-cell interactions between two cell types and their ligand-receptor pairs for different disease states |
| Ligand | Receptor | LRpair | Pathway | Tissue | Disease Stage |
| Page: 1 |
Top |
Single-cell gene regulatory network inference analysis |
| Find out the significant the regulons (TFs) and the target genes of each regulon across cell types for different disease states |
| TF | Cell Type | Tissue | Disease Stage | Target Gene | RSS | Regulon Activity |
| ∗The dot plots of a searched regulon are shown for all cell subpopulations in each disease state of each tissue based on the regulon specific score inferred using pySCENIC and by calculating the average expression. |
| Page: 1 |
Top |
Somatic mutation of malignant transformation related genes |
| Annotation of somatic variants for genes involved in malignant transformation |
| Hugo Symbol | Variant Class | Variant Classification | dbSNP RS | HGVSc | HGVSp | HGVSp Short | SWISSPROT | BIOTYPE | SIFT | PolyPhen | Tumor Sample Barcode | Tissue | Histology | Sex | Age | Stage | Therapy Types | Drugs | Outcome |
| TSPAN9 | SNV | Missense_Mutation | novel | c.548N>T | p.Thr183Met | p.T183M | O75954 | protein_coding | tolerated(0.11) | possibly_damaging(0.601) | TCGA-AC-A3EH-01 | Breast | breast invasive carcinoma | Female | >=65 | III/IV | Unknown | Unknown | SD |
| TSPAN9 | SNV | Missense_Mutation | novel | c.655N>A | p.Gly219Ser | p.G219S | O75954 | protein_coding | deleterious(0.02) | possibly_damaging(0.654) | TCGA-E2-A2P5-01 | Breast | breast invasive carcinoma | Female | >=65 | III/IV | Hormone Therapy | arimidex | PD |
| TSPAN9 | insertion | In_Frame_Ins | novel | c.240_241insAGAGAATTGACAGTCTTGAAACATAATTCAGGAGCT | p.Lys80_Cys81insArgGluLeuThrValLeuLysHisAsnSerGlyAla | p.K80_C81insRELTVLKHNSGA | O75954 | protein_coding | TCGA-AN-A0FS-01 | Breast | breast invasive carcinoma | Female | <65 | I/II | Unknown | Unknown | SD | ||
| TSPAN9 | deletion | Frame_Shift_Del | novel | c.592delN | p.Phe198SerfsTer27 | p.F198Sfs*27 | O75954 | protein_coding | TCGA-D8-A27V-01 | Breast | breast invasive carcinoma | Female | <65 | I/II | Hormone Therapy | tamoxiphen | SD | ||
| TSPAN9 | SNV | Missense_Mutation | novel | c.254N>A | p.Ser85Asn | p.S85N | O75954 | protein_coding | deleterious(0) | probably_damaging(0.975) | TCGA-C5-A902-01 | Cervix | cervical & endocervical cancer | Female | <65 | I/II | Chemotherapy | cisplatin | SD |
| TSPAN9 | SNV | Missense_Mutation | novel | c.548N>T | p.Thr183Met | p.T183M | O75954 | protein_coding | tolerated(0.11) | possibly_damaging(0.601) | TCGA-EX-A449-01 | Cervix | cervical & endocervical cancer | Female | <65 | I/II | Chemotherapy | cisplatin | CR |
| TSPAN9 | SNV | Missense_Mutation | novel | c.182N>A | p.Gly61Asp | p.G61D | O75954 | protein_coding | deleterious(0) | probably_damaging(1) | TCGA-5M-AAT6-01 | Colorectum | colon adenocarcinoma | Female | <65 | III/IV | Unknown | Unknown | PD |
| TSPAN9 | SNV | Missense_Mutation | c.40T>A | p.Phe14Ile | p.F14I | O75954 | protein_coding | deleterious(0) | benign(0.061) | TCGA-F4-6856-01 | Colorectum | colon adenocarcinoma | Male | <65 | I/II | Ancillary | leucovorin | CR | |
| TSPAN9 | SNV | Missense_Mutation | c.60C>A | p.Phe20Leu | p.F20L | O75954 | protein_coding | tolerated(0.1) | benign(0.107) | TCGA-AP-A056-01 | Endometrium | uterine corpus endometrioid carcinoma | Female | <65 | I/II | Unknown | Unknown | SD | |
| TSPAN9 | SNV | Missense_Mutation | rs774632414 | c.149N>T | p.Ser50Leu | p.S50L | O75954 | protein_coding | tolerated(0.05) | probably_damaging(0.941) | TCGA-AX-A05Z-01 | Endometrium | uterine corpus endometrioid carcinoma | Female | <65 | III/IV | Chemotherapy | adriamycin | SD |
| Page: 1 2 |
Top |
Related drugs of malignant transformation related genes |
| Identification of chemicals and drugs interact with genes involved in malignant transfromation |
| (DGIdb 4.0) |
| Entrez ID | Symbol | Category | Interaction Types | Drug Claim Name | Drug Name | PMIDs |
| Page: 1 |

Copyright 2023-Present -The University of Texas Health Science Center at Houston |