
|
|||||
|
 | |
| |
| |
| |
| |
| |
|
Gene: TSPAN8 |
Gene summary for TSPAN8 |
| Gene information | Species | Human | Gene symbol | TSPAN8 | Gene ID | 7103 |
| Gene name | tetraspanin 8 | |
| Gene Alias | CO-029 | |
| Cytomap | 12q21.1 | |
| Gene Type | protein-coding | GO ID | GO:0000003 | UniProtAcc | P19075 |
Top |
Malignant transformation analysis |
| Identification of the aberrant gene expression in precancerous and cancerous lesions by comparing the gene expression of stem-like cells in diseased tissues with normal stem cells |
| Entrez ID | Symbol | Replicates | Species | Organ | Tissue | Adj P-value | Log2FC | Malignancy |
| 7103 | TSPAN8 | HTA11_3410_2000001011 | Human | Colorectum | AD | 2.84e-21 | -7.40e-01 | 0.0155 |
| 7103 | TSPAN8 | HTA11_78_2000001011 | Human | Colorectum | AD | 6.02e-12 | 1.20e+00 | -0.1088 |
| 7103 | TSPAN8 | HTA11_2992_2000001011 | Human | Colorectum | SER | 1.17e-06 | 8.59e-01 | -0.1706 |
| 7103 | TSPAN8 | HTA11_5212_2000001011 | Human | Colorectum | AD | 1.13e-08 | 7.42e-01 | -0.2061 |
| 7103 | TSPAN8 | HTA11_6801_2000001011 | Human | Colorectum | SER | 3.16e-05 | 9.25e-01 | 0.0171 |
| 7103 | TSPAN8 | HTA11_7696_3000711011 | Human | Colorectum | AD | 1.29e-08 | 7.72e-01 | 0.0674 |
| 7103 | TSPAN8 | HTA11_99999965062_69753 | Human | Colorectum | MSI-H | 6.90e-08 | 1.71e+00 | 0.3487 |
| 7103 | TSPAN8 | HTA11_99999965104_69814 | Human | Colorectum | MSS | 1.19e-06 | 6.83e-01 | 0.281 |
| 7103 | TSPAN8 | F007 | Human | Colorectum | FAP | 2.45e-02 | -1.47e-01 | 0.1176 |
| 7103 | TSPAN8 | A002-C-010 | Human | Colorectum | FAP | 1.18e-09 | 3.54e-01 | 0.242 |
| 7103 | TSPAN8 | A015-C-203 | Human | Colorectum | FAP | 2.32e-27 | -4.93e-01 | -0.1294 |
| 7103 | TSPAN8 | A015-C-204 | Human | Colorectum | FAP | 1.13e-04 | -3.41e-01 | -0.0228 |
| 7103 | TSPAN8 | A014-C-040 | Human | Colorectum | FAP | 4.08e-06 | -5.69e-01 | -0.1184 |
| 7103 | TSPAN8 | A002-C-201 | Human | Colorectum | FAP | 1.82e-08 | -2.01e-01 | 0.0324 |
| 7103 | TSPAN8 | A001-C-119 | Human | Colorectum | FAP | 9.84e-14 | -6.61e-01 | -0.1557 |
| 7103 | TSPAN8 | A001-C-108 | Human | Colorectum | FAP | 2.57e-09 | -1.49e-01 | -0.0272 |
| 7103 | TSPAN8 | A002-C-205 | Human | Colorectum | FAP | 1.28e-24 | -5.66e-01 | -0.1236 |
| 7103 | TSPAN8 | A015-C-005 | Human | Colorectum | FAP | 8.95e-03 | -2.36e-01 | -0.0336 |
| 7103 | TSPAN8 | A015-C-006 | Human | Colorectum | FAP | 7.38e-16 | -5.29e-01 | -0.0994 |
| 7103 | TSPAN8 | A015-C-106 | Human | Colorectum | FAP | 1.42e-07 | -2.21e-01 | -0.0511 |
| Page: 1 2 3 4 5 6 |
| Tissue | Expression Dynamics | Abbreviation |
| Colorectum (GSE201348) |  | FAP: Familial adenomatous polyposis |
| CRC: Colorectal cancer | ||
| Colorectum (HTA11) | 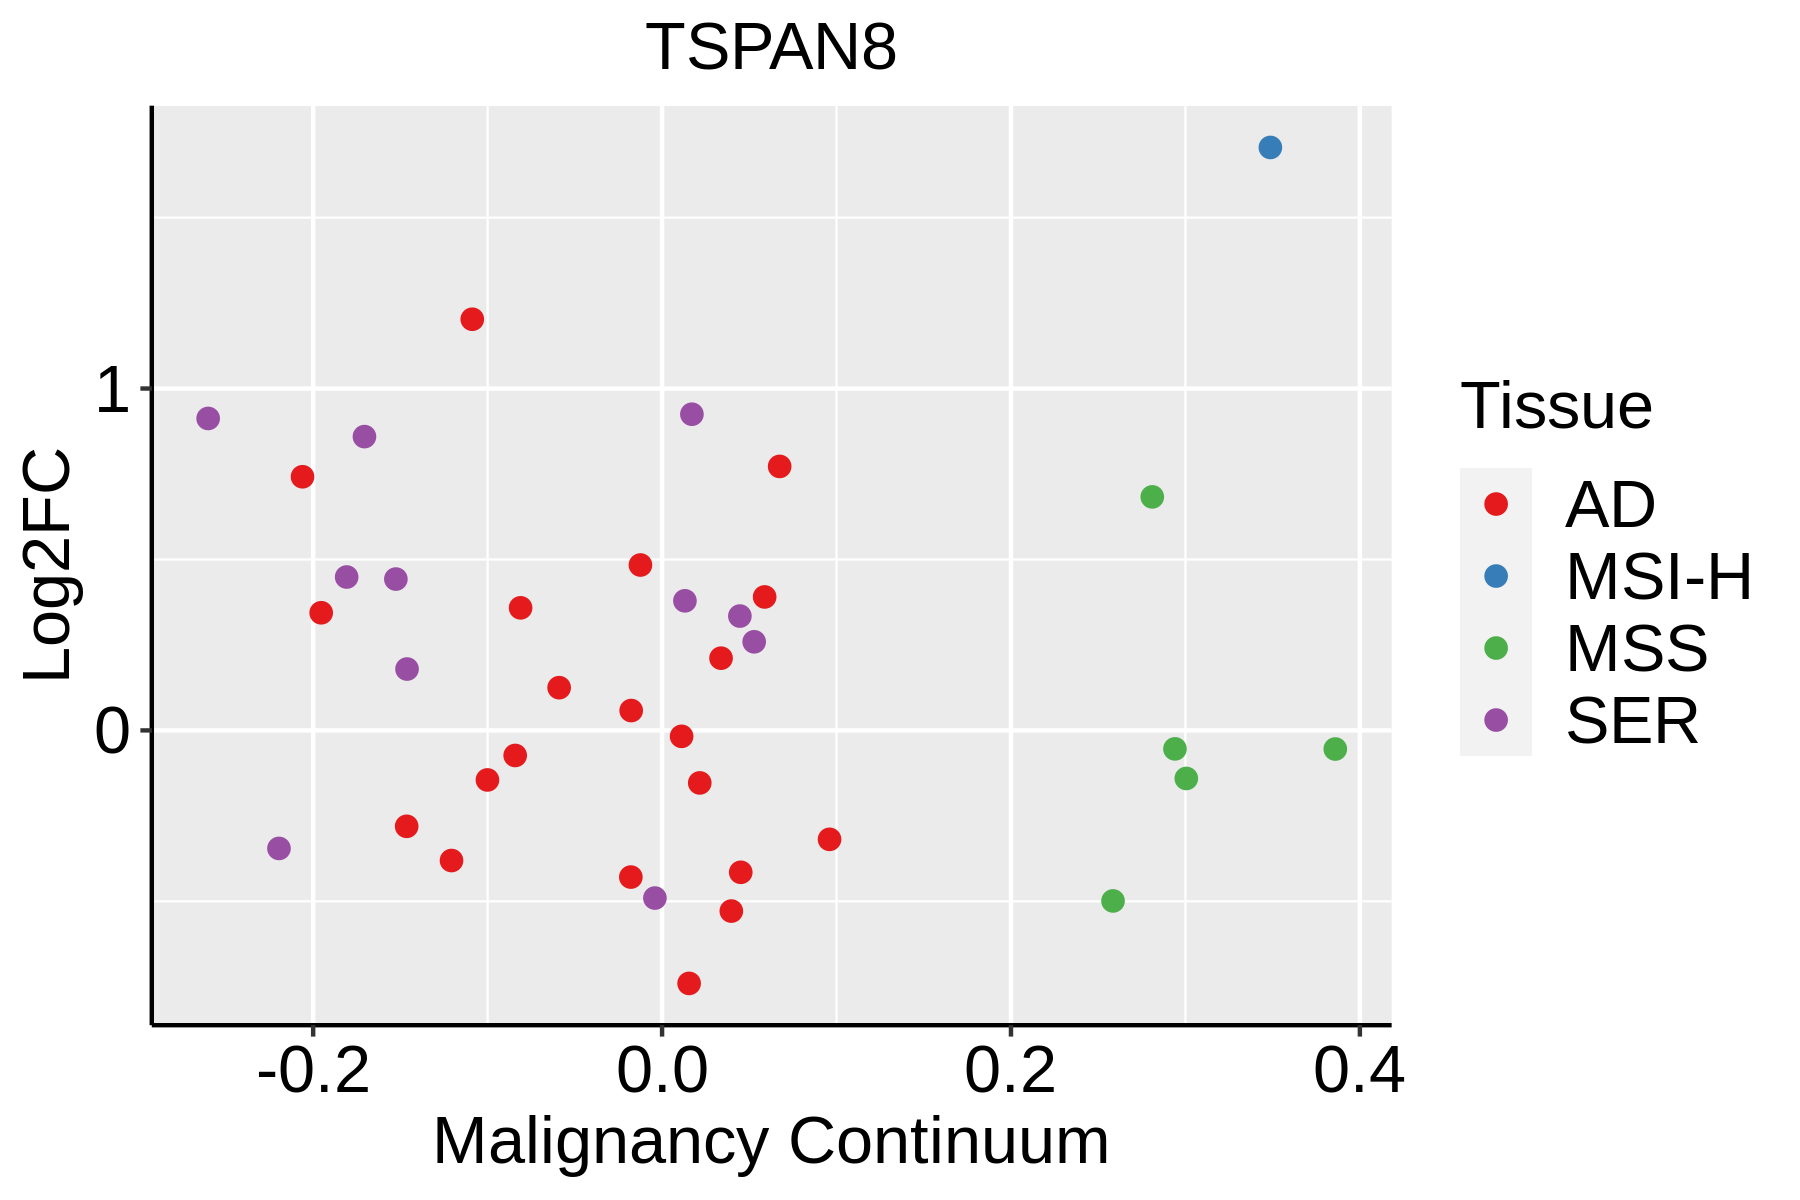 | AD: Adenomas |
| SER: Sessile serrated lesions | ||
| MSI-H: Microsatellite-high colorectal cancer | ||
| MSS: Microsatellite stable colorectal cancer | ||
| Esophagus | 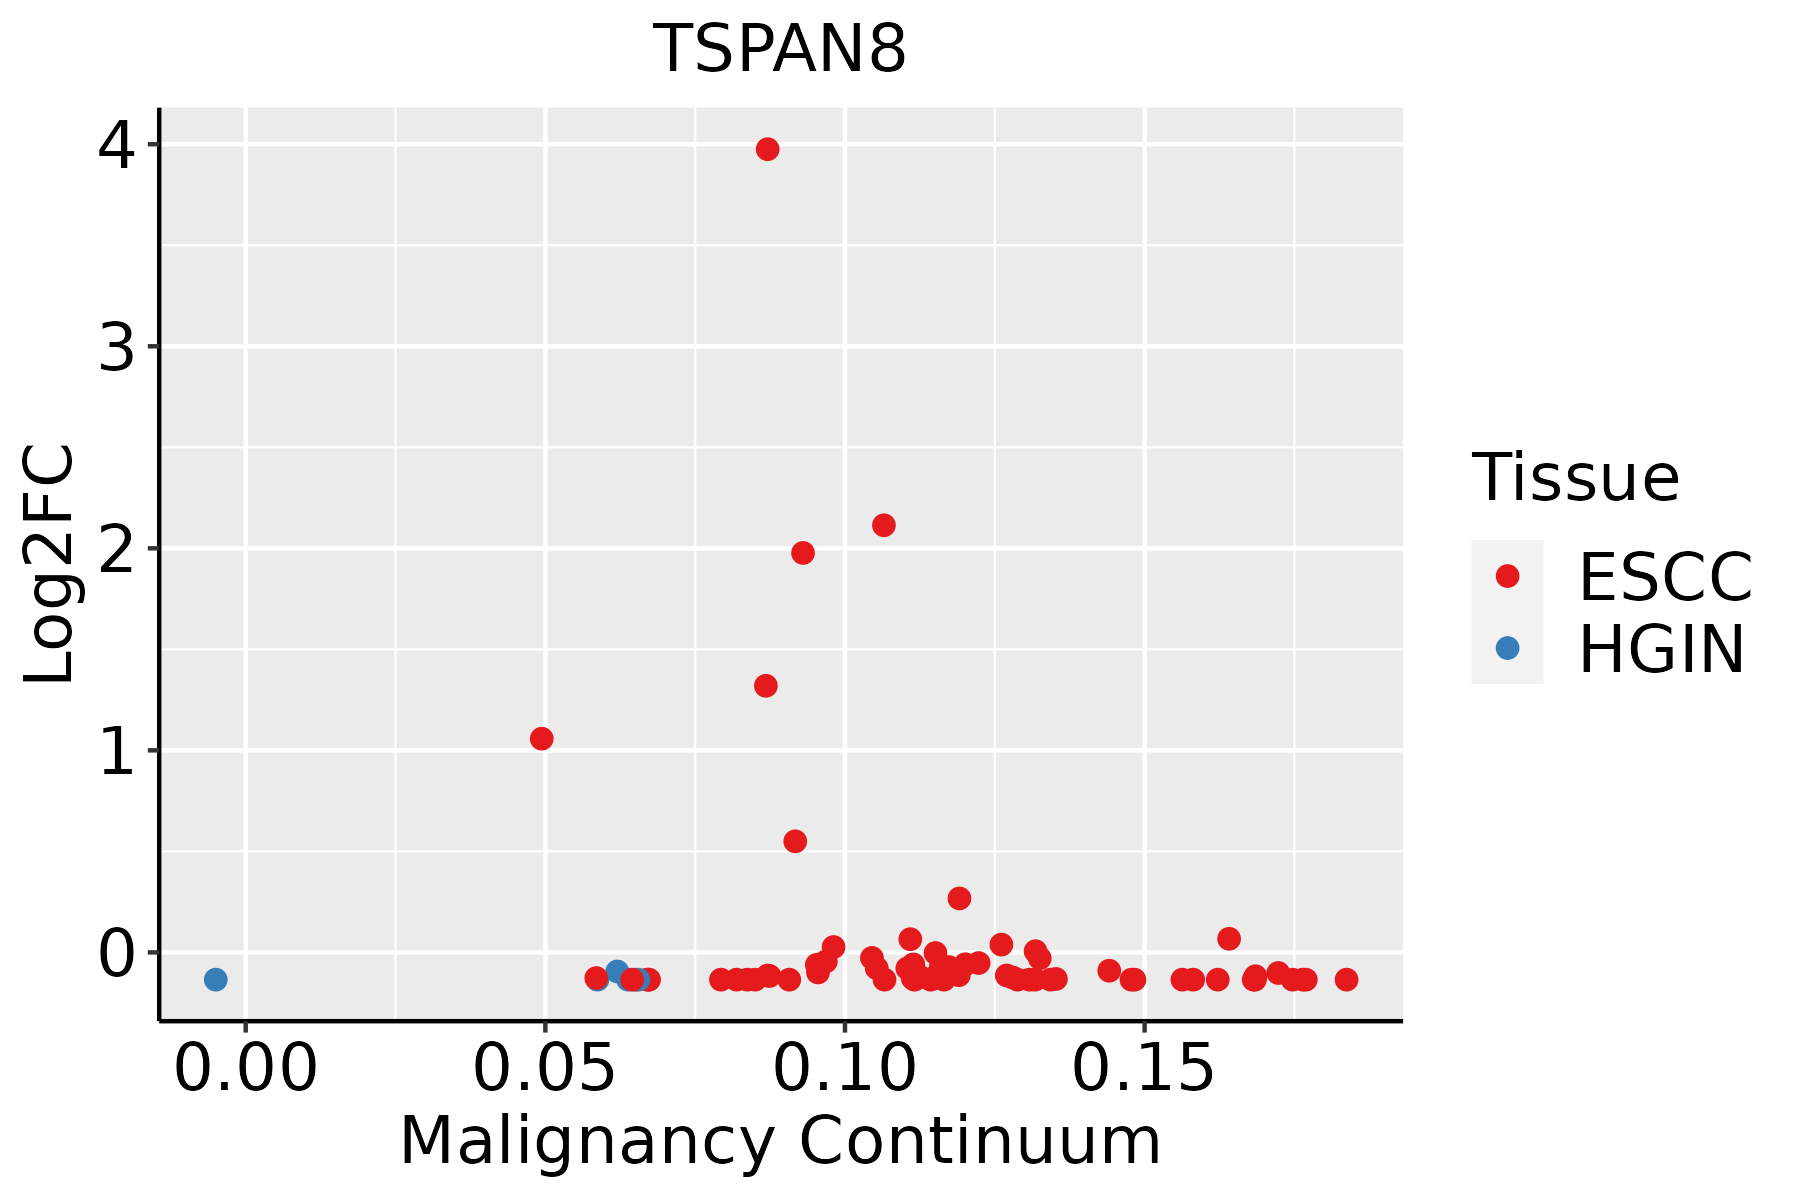 | ESCC: Esophageal squamous cell carcinoma |
| HGIN: High-grade intraepithelial neoplasias | ||
| LGIN: Low-grade intraepithelial neoplasias | ||
| GC | 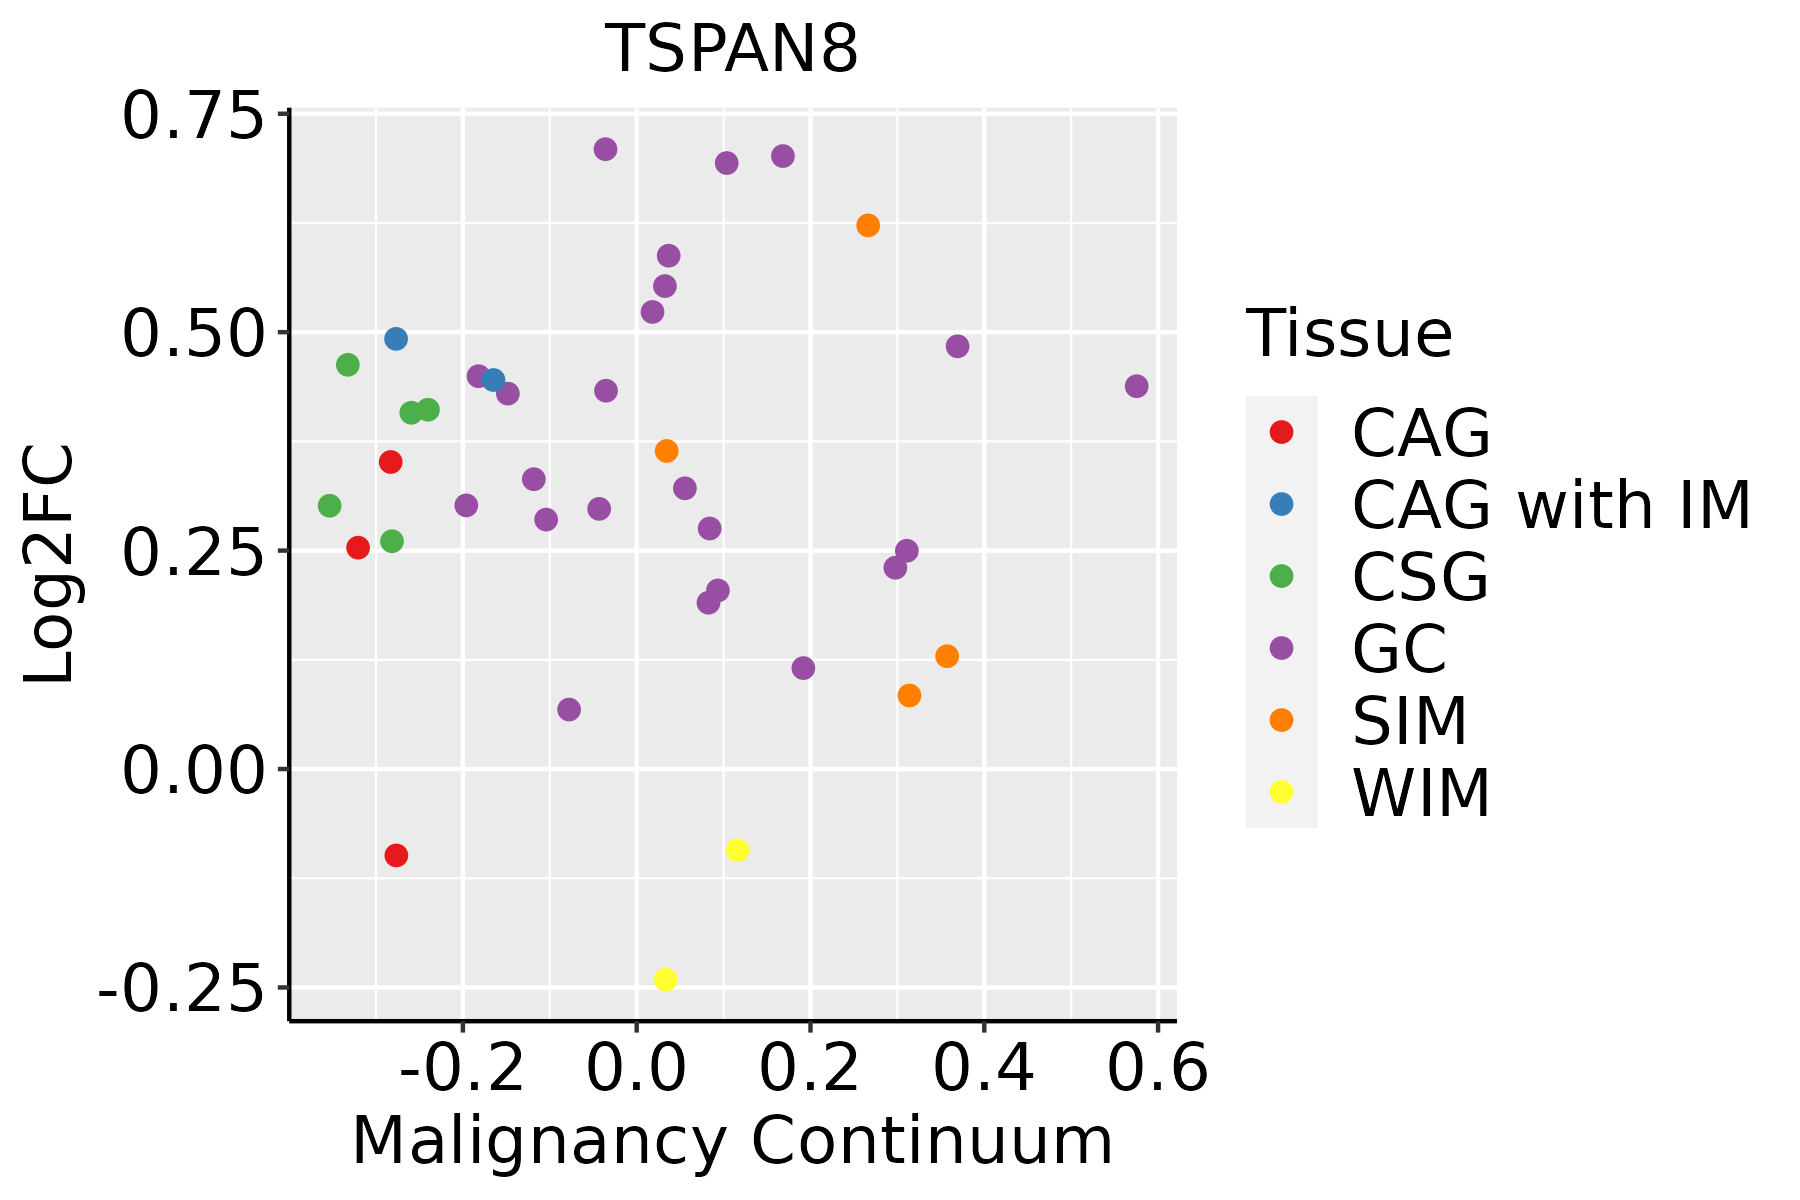 | CAG: Chronic atrophic gastritis |
| CAG with IM: Chronic atrophic gastritis with intestinal metaplasia | ||
| CSG: Chronic superficial gastritis | ||
| GC: Gastric cancer | ||
| SIM: Severe intestinal metaplasia | ||
| WIM: Wild intestinal metaplasia | ||
| Liver | 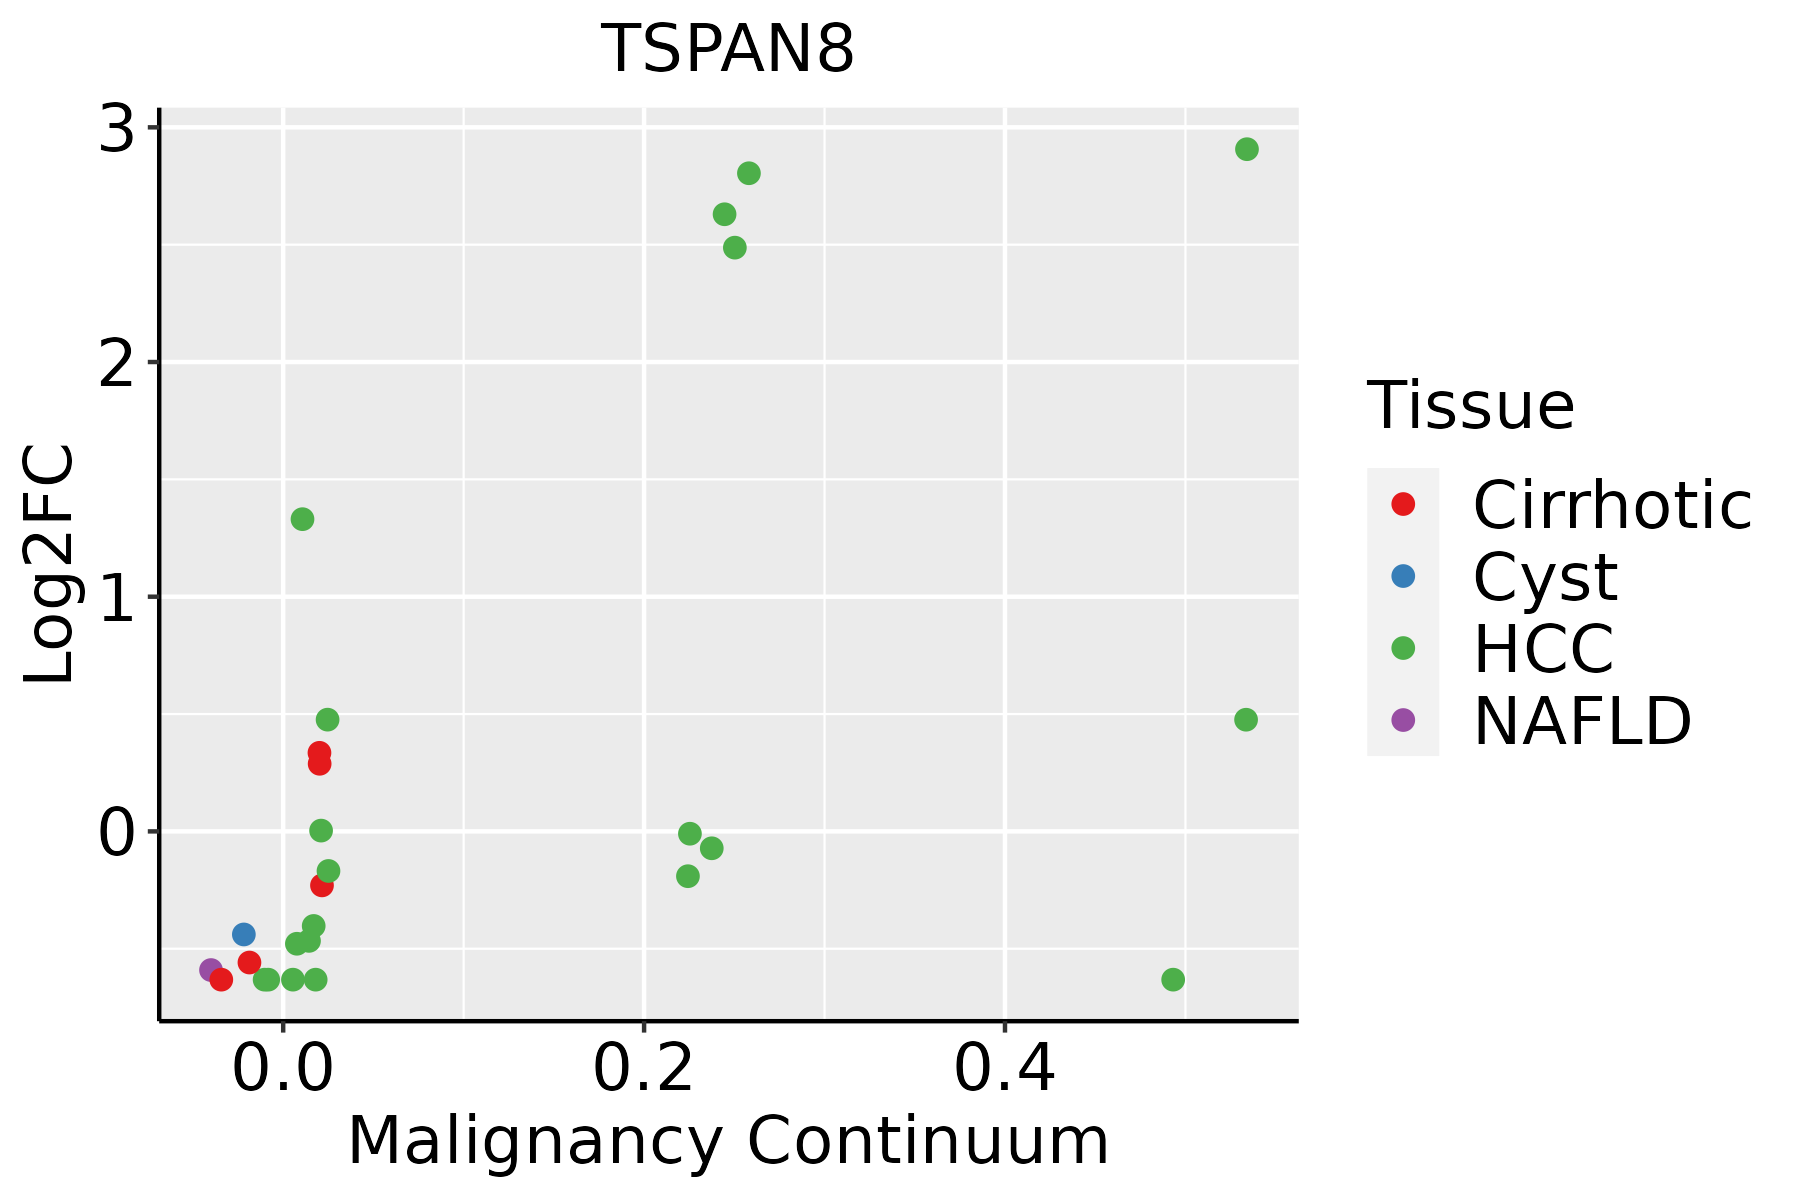 | HCC: Hepatocellular carcinoma |
| NAFLD: Non-alcoholic fatty liver disease | ||
| Prostate |  | BPH: Benign Prostatic Hyperplasia |
| Thyroid |  | ATC: Anaplastic thyroid cancer |
| HT: Hashimoto's thyroiditis | ||
| PTC: Papillary thyroid cancer |
| ∗log2FC in expression of this searched gene in stem-like cells from each diseased tissue sample relative to stem-like cells in normal samples in each tissue plotted against the malignancy continuum. Samples are colored based on if they are from different disease stage. |
Top |
Malignant transformation related pathway analysis |
| Find out the enriched GO biological processes and KEGG pathways involved in transition from healthy to precancer to cancer |
| Tissue | Disease Stage | Enriched GO biological Processes |
| Colorectum | AD |  |
| Colorectum | SER |  |
| Colorectum | MSS |  |
| Colorectum | MSI-H |  |
| Colorectum | FAP |  |
| ∗Top 15 enriched GO BP terms are showed in the bar plot of each disease state in each tissue. Each row represents a significant GO biological process which is colored according to the -log10(p.adjust). |
| Page: 1 2 3 4 5 6 7 8 9 |
| GO ID | Tissue | Disease Stage | Description | Gene Ratio | Bg Ratio | pvalue | p.adjust | Count |
| GO:0042060 | Colorectum | AD | wound healing | 128/3918 | 422/18723 | 2.73e-06 | 7.89e-05 | 128 |
| GO:0050878 | Colorectum | AD | regulation of body fluid levels | 108/3918 | 379/18723 | 2.54e-04 | 3.20e-03 | 108 |
| GO:00420601 | Colorectum | SER | wound healing | 97/2897 | 422/18723 | 2.69e-05 | 7.30e-04 | 97 |
| GO:00508781 | Colorectum | SER | regulation of body fluid levels | 81/2897 | 379/18723 | 1.28e-03 | 1.43e-02 | 81 |
| GO:0061041 | Colorectum | SER | regulation of wound healing | 33/2897 | 134/18723 | 3.78e-03 | 3.13e-02 | 33 |
| GO:1903034 | Colorectum | SER | regulation of response to wounding | 39/2897 | 167/18723 | 4.73e-03 | 3.72e-02 | 39 |
| GO:00420602 | Colorectum | MSS | wound healing | 119/3467 | 422/18723 | 5.93e-07 | 2.24e-05 | 119 |
| GO:00508782 | Colorectum | MSS | regulation of body fluid levels | 99/3467 | 379/18723 | 1.40e-04 | 2.07e-03 | 99 |
| GO:00420603 | Colorectum | MSI-H | wound healing | 47/1319 | 422/18723 | 1.23e-03 | 2.00e-02 | 47 |
| GO:00508783 | Colorectum | MSI-H | regulation of body fluid levels | 41/1319 | 379/18723 | 4.10e-03 | 4.67e-02 | 41 |
| GO:00420604 | Colorectum | FAP | wound healing | 99/2622 | 422/18723 | 9.50e-08 | 6.33e-06 | 99 |
| GO:00610411 | Colorectum | FAP | regulation of wound healing | 35/2622 | 134/18723 | 1.48e-04 | 2.29e-03 | 35 |
| GO:00508784 | Colorectum | FAP | regulation of body fluid levels | 79/2622 | 379/18723 | 1.52e-04 | 2.35e-03 | 79 |
| GO:19030341 | Colorectum | FAP | regulation of response to wounding | 41/2622 | 167/18723 | 1.86e-04 | 2.74e-03 | 41 |
| GO:00420605 | Colorectum | CRC | wound healing | 80/2078 | 422/18723 | 1.06e-06 | 6.54e-05 | 80 |
| GO:00508785 | Colorectum | CRC | regulation of body fluid levels | 65/2078 | 379/18723 | 2.38e-04 | 3.96e-03 | 65 |
| GO:00610412 | Colorectum | CRC | regulation of wound healing | 26/2078 | 134/18723 | 3.17e-03 | 2.78e-02 | 26 |
| GO:004206027 | Esophagus | ESCC | wound healing | 243/8552 | 422/18723 | 4.62e-07 | 6.25e-06 | 243 |
| GO:190303420 | Esophagus | ESCC | regulation of response to wounding | 93/8552 | 167/18723 | 5.77e-03 | 2.14e-02 | 93 |
| GO:004206012 | Liver | Cirrhotic | wound healing | 155/4634 | 422/18723 | 2.12e-08 | 7.56e-07 | 155 |
| Page: 1 2 3 4 5 |
| Pathway ID | Tissue | Disease Stage | Description | Gene Ratio | Bg Ratio | pvalue | p.adjust | qvalue | Count |
| Page: 1 |
Top |
Cell-cell communication analysis |
| Identification of potential cell-cell interactions between two cell types and their ligand-receptor pairs for different disease states |
| Ligand | Receptor | LRpair | Pathway | Tissue | Disease Stage |
| Page: 1 |
Top |
Single-cell gene regulatory network inference analysis |
| Find out the significant the regulons (TFs) and the target genes of each regulon across cell types for different disease states |
| TF | Cell Type | Tissue | Disease Stage | Target Gene | RSS | Regulon Activity |
| ∗The dot plots of a searched regulon are shown for all cell subpopulations in each disease state of each tissue based on the regulon specific score inferred using pySCENIC and by calculating the average expression. |
| Page: 1 |
Top |
Somatic mutation of malignant transformation related genes |
| Annotation of somatic variants for genes involved in malignant transformation |
| Hugo Symbol | Variant Class | Variant Classification | dbSNP RS | HGVSc | HGVSp | HGVSp Short | SWISSPROT | BIOTYPE | SIFT | PolyPhen | Tumor Sample Barcode | Tissue | Histology | Sex | Age | Stage | Therapy Types | Drugs | Outcome |
| TSPAN8 | SNV | Missense_Mutation | c.482N>T | p.Trp161Leu | p.W161L | P19075 | protein_coding | deleterious(0) | probably_damaging(0.997) | TCGA-A1-A0SO-01 | Breast | breast invasive carcinoma | Female | >=65 | I/II | Chemotherapy | SD | ||
| TSPAN8 | insertion | Nonsense_Mutation | novel | c.94_95insAGAGCCTTTTTAAGGTATTTGCCCACATAAAGA | p.Trp32delinsTer | p.W32delins* | P19075 | protein_coding | TCGA-A8-A08H-01 | Breast | breast invasive carcinoma | Female | >=65 | I/II | Unknown | Unknown | SD | ||
| TSPAN8 | insertion | Frame_Shift_Ins | novel | c.499_500insCCTC | p.His167ProfsTer5 | p.H167Pfs*5 | P19075 | protein_coding | TCGA-B6-A0IA-01 | Breast | breast invasive carcinoma | Female | <65 | I/II | Unknown | Unknown | SD | ||
| TSPAN8 | insertion | In_Frame_Ins | novel | c.497_498insGGGGAAACT | p.Gln166_His167insGlyLysLeu | p.Q166_H167insGKL | P19075 | protein_coding | TCGA-B6-A0IA-01 | Breast | breast invasive carcinoma | Female | <65 | I/II | Unknown | Unknown | SD | ||
| TSPAN8 | SNV | Missense_Mutation | c.112N>A | p.Asp38Asn | p.D38N | P19075 | protein_coding | tolerated(0.08) | benign(0.098) | TCGA-DR-A0ZM-01 | Cervix | cervical & endocervical cancer | Female | <65 | III/IV | Unspecific | Cisplatin | SD | |
| TSPAN8 | SNV | Missense_Mutation | c.496N>G | p.Gln166Glu | p.Q166E | P19075 | protein_coding | tolerated(0.69) | benign(0.003) | TCGA-DS-A0VM-01 | Cervix | cervical & endocervical cancer | Female | <65 | I/II | Chemotherapy | cisplatin | PD | |
| TSPAN8 | SNV | Missense_Mutation | c.280N>G | p.Leu94Val | p.L94V | P19075 | protein_coding | tolerated(0.08) | benign(0.031) | TCGA-Q1-A73O-01 | Cervix | cervical & endocervical cancer | Female | <65 | I/II | Chemotherapy | cisplatin | CR | |
| TSPAN8 | SNV | Missense_Mutation | rs774338946 | c.656N>C | p.Ile219Thr | p.I219T | P19075 | protein_coding | deleterious(0) | possibly_damaging(0.675) | TCGA-AA-A00N-01 | Colorectum | colon adenocarcinoma | Male | >=65 | I/II | Unknown | Unknown | PD |
| TSPAN8 | SNV | Missense_Mutation | novel | c.182N>T | p.Ala61Val | p.A61V | P19075 | protein_coding | tolerated(0.06) | probably_damaging(0.974) | TCGA-AG-A002-01 | Colorectum | rectum adenocarcinoma | Male | <65 | I/II | Unknown | Unknown | SD |
| TSPAN8 | deletion | In_Frame_Del | c.29_31delNNN | p.Tyr10del | p.Y10del | P19075 | protein_coding | TCGA-A6-2672-01 | Colorectum | colon adenocarcinoma | Female | >=65 | III/IV | Unknown | Unknown | SD |
| Page: 1 2 3 |
Top |
Related drugs of malignant transformation related genes |
| Identification of chemicals and drugs interact with genes involved in malignant transfromation |
| (DGIdb 4.0) |
| Entrez ID | Symbol | Category | Interaction Types | Drug Claim Name | Drug Name | PMIDs |
| Page: 1 |

Copyright 2023-Present -The University of Texas Health Science Center at Houston |