
|
|||||
|
 | |
| |
| |
| |
| |
| |
|
Gene: TSPAN7 |
Gene summary for TSPAN7 |
| Gene information | Species | Human | Gene symbol | TSPAN7 | Gene ID | 7102 |
| Gene name | tetraspanin 7 | |
| Gene Alias | A15 | |
| Cytomap | Xp11.4 | |
| Gene Type | protein-coding | GO ID | GO:0005575 | UniProtAcc | P41732 |
Top |
Malignant transformation analysis |
| Identification of the aberrant gene expression in precancerous and cancerous lesions by comparing the gene expression of stem-like cells in diseased tissues with normal stem cells |
| Entrez ID | Symbol | Replicates | Species | Organ | Tissue | Adj P-value | Log2FC | Malignancy |
| 7102 | TSPAN7 | HTA11_78_2000001011 | Human | Colorectum | AD | 7.04e-12 | 3.74e-01 | -0.1088 |
| 7102 | TSPAN7 | HTA11_347_2000001011 | Human | Colorectum | AD | 1.05e-25 | 5.26e-01 | -0.1954 |
| 7102 | TSPAN7 | HTA11_411_2000001011 | Human | Colorectum | SER | 1.74e-04 | 3.07e-01 | -0.2602 |
| 7102 | TSPAN7 | HTA11_1391_2000001011 | Human | Colorectum | AD | 3.38e-05 | 1.26e-01 | -0.059 |
| 7102 | TSPAN7 | HTA11_5212_2000001011 | Human | Colorectum | AD | 4.77e-11 | 5.78e-01 | -0.2061 |
| 7102 | TSPAN7 | HTA11_10623_2000001011 | Human | Colorectum | AD | 2.06e-03 | 1.82e-01 | -0.0177 |
| 7102 | TSPAN7 | HTA11_7469_2000001011 | Human | Colorectum | AD | 1.87e-04 | 3.50e-01 | -0.0124 |
| 7102 | TSPAN7 | HTA11_99999965104_69814 | Human | Colorectum | MSS | 1.51e-08 | 2.95e-01 | 0.281 |
| 7102 | TSPAN7 | LZE2T | Human | Esophagus | ESCC | 1.52e-03 | 4.06e-01 | 0.082 |
| 7102 | TSPAN7 | LZE4T | Human | Esophagus | ESCC | 1.38e-39 | 1.58e+00 | 0.0811 |
| 7102 | TSPAN7 | LZE7T | Human | Esophagus | ESCC | 1.55e-03 | 3.07e-01 | 0.0667 |
| 7102 | TSPAN7 | LZE21T | Human | Esophagus | ESCC | 8.06e-07 | 7.63e-01 | 0.0655 |
| 7102 | TSPAN7 | P4T-E | Human | Esophagus | ESCC | 2.67e-27 | 7.08e-01 | 0.1323 |
| 7102 | TSPAN7 | P9T-E | Human | Esophagus | ESCC | 2.73e-11 | 3.36e-01 | 0.1131 |
| 7102 | TSPAN7 | P10T-E | Human | Esophagus | ESCC | 7.94e-21 | 4.72e-01 | 0.116 |
| 7102 | TSPAN7 | P11T-E | Human | Esophagus | ESCC | 1.29e-06 | 3.68e-01 | 0.1426 |
| 7102 | TSPAN7 | P15T-E | Human | Esophagus | ESCC | 2.22e-49 | 1.22e+00 | 0.1149 |
| 7102 | TSPAN7 | P16T-E | Human | Esophagus | ESCC | 7.08e-07 | 1.29e-01 | 0.1153 |
| 7102 | TSPAN7 | P20T-E | Human | Esophagus | ESCC | 2.24e-07 | 2.81e-01 | 0.1124 |
| 7102 | TSPAN7 | P22T-E | Human | Esophagus | ESCC | 3.53e-31 | 6.19e-01 | 0.1236 |
| Page: 1 2 3 |
| Tissue | Expression Dynamics | Abbreviation |
| Colorectum (GSE201348) | 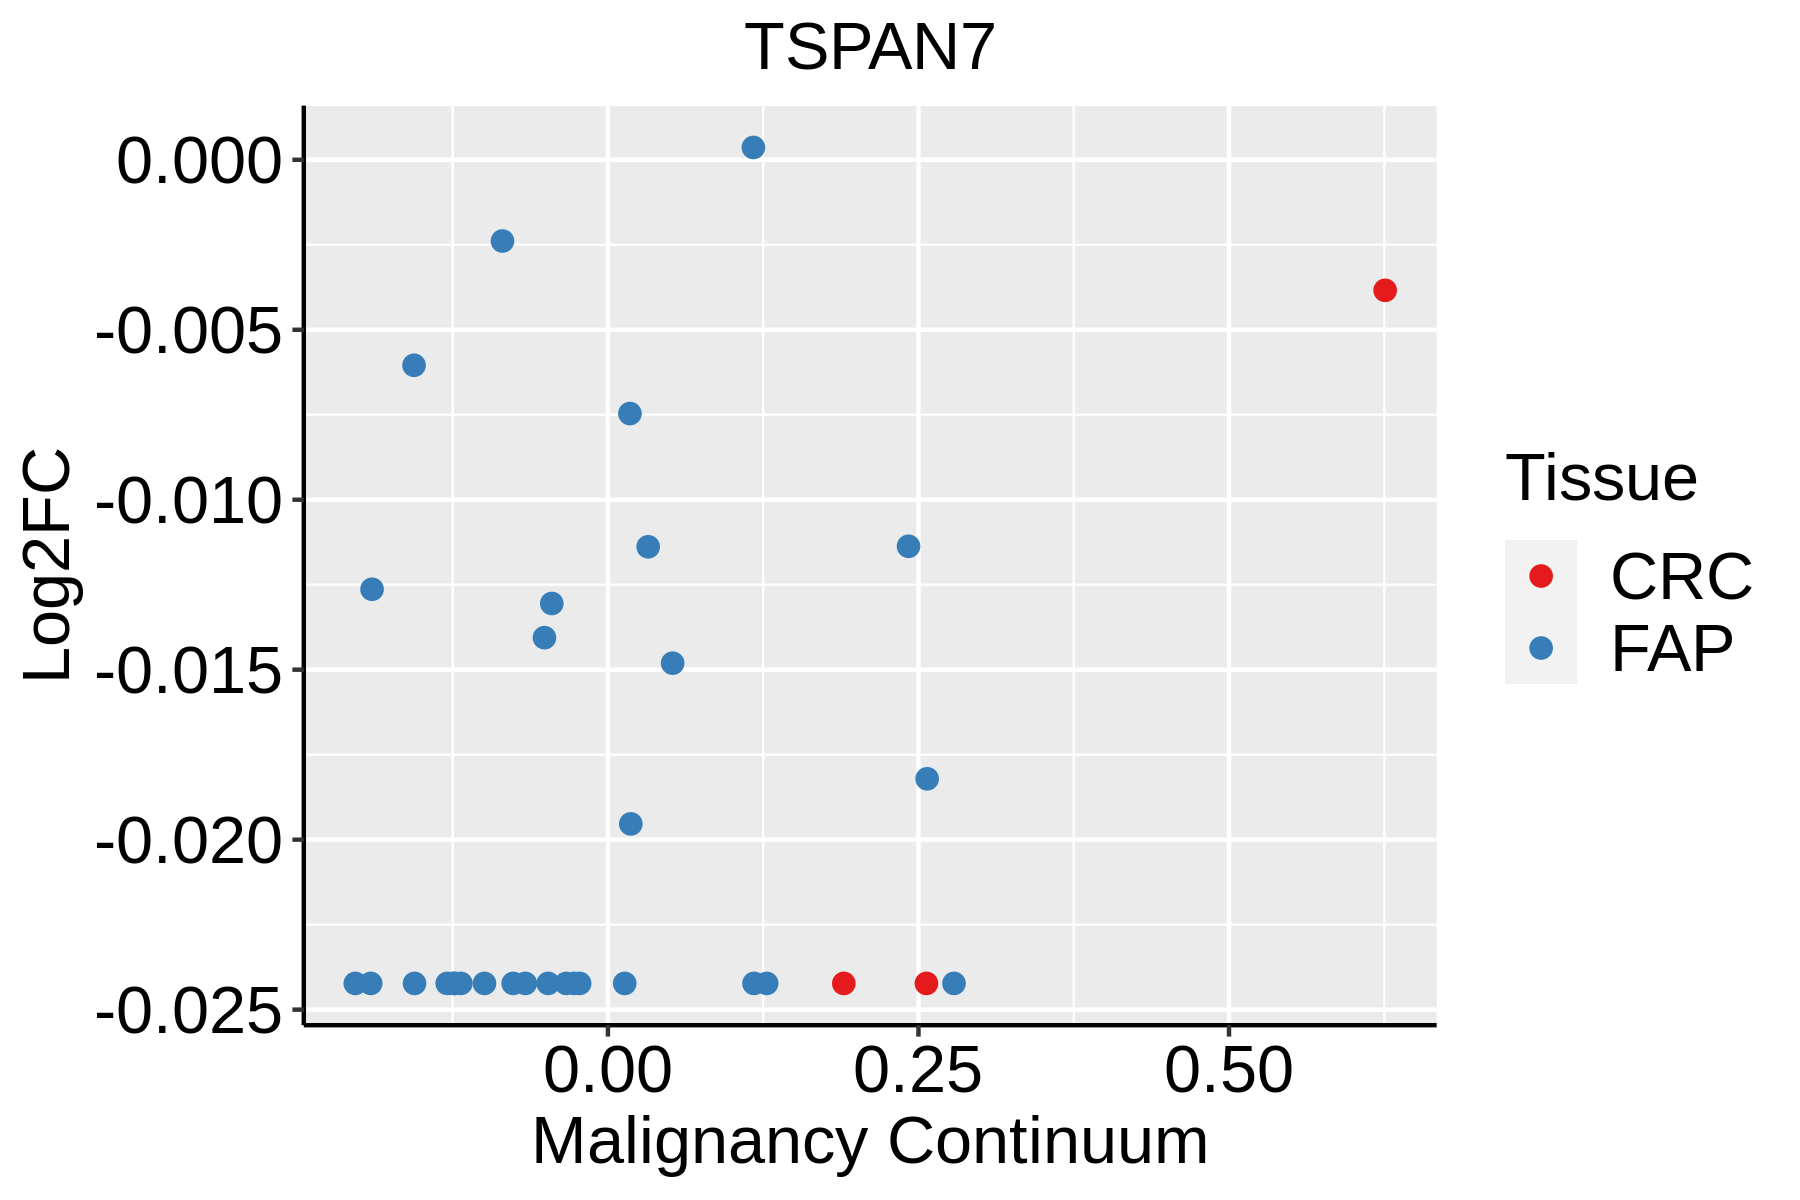 | FAP: Familial adenomatous polyposis |
| CRC: Colorectal cancer | ||
| Colorectum (HTA11) |  | AD: Adenomas |
| SER: Sessile serrated lesions | ||
| MSI-H: Microsatellite-high colorectal cancer | ||
| MSS: Microsatellite stable colorectal cancer | ||
| Esophagus | 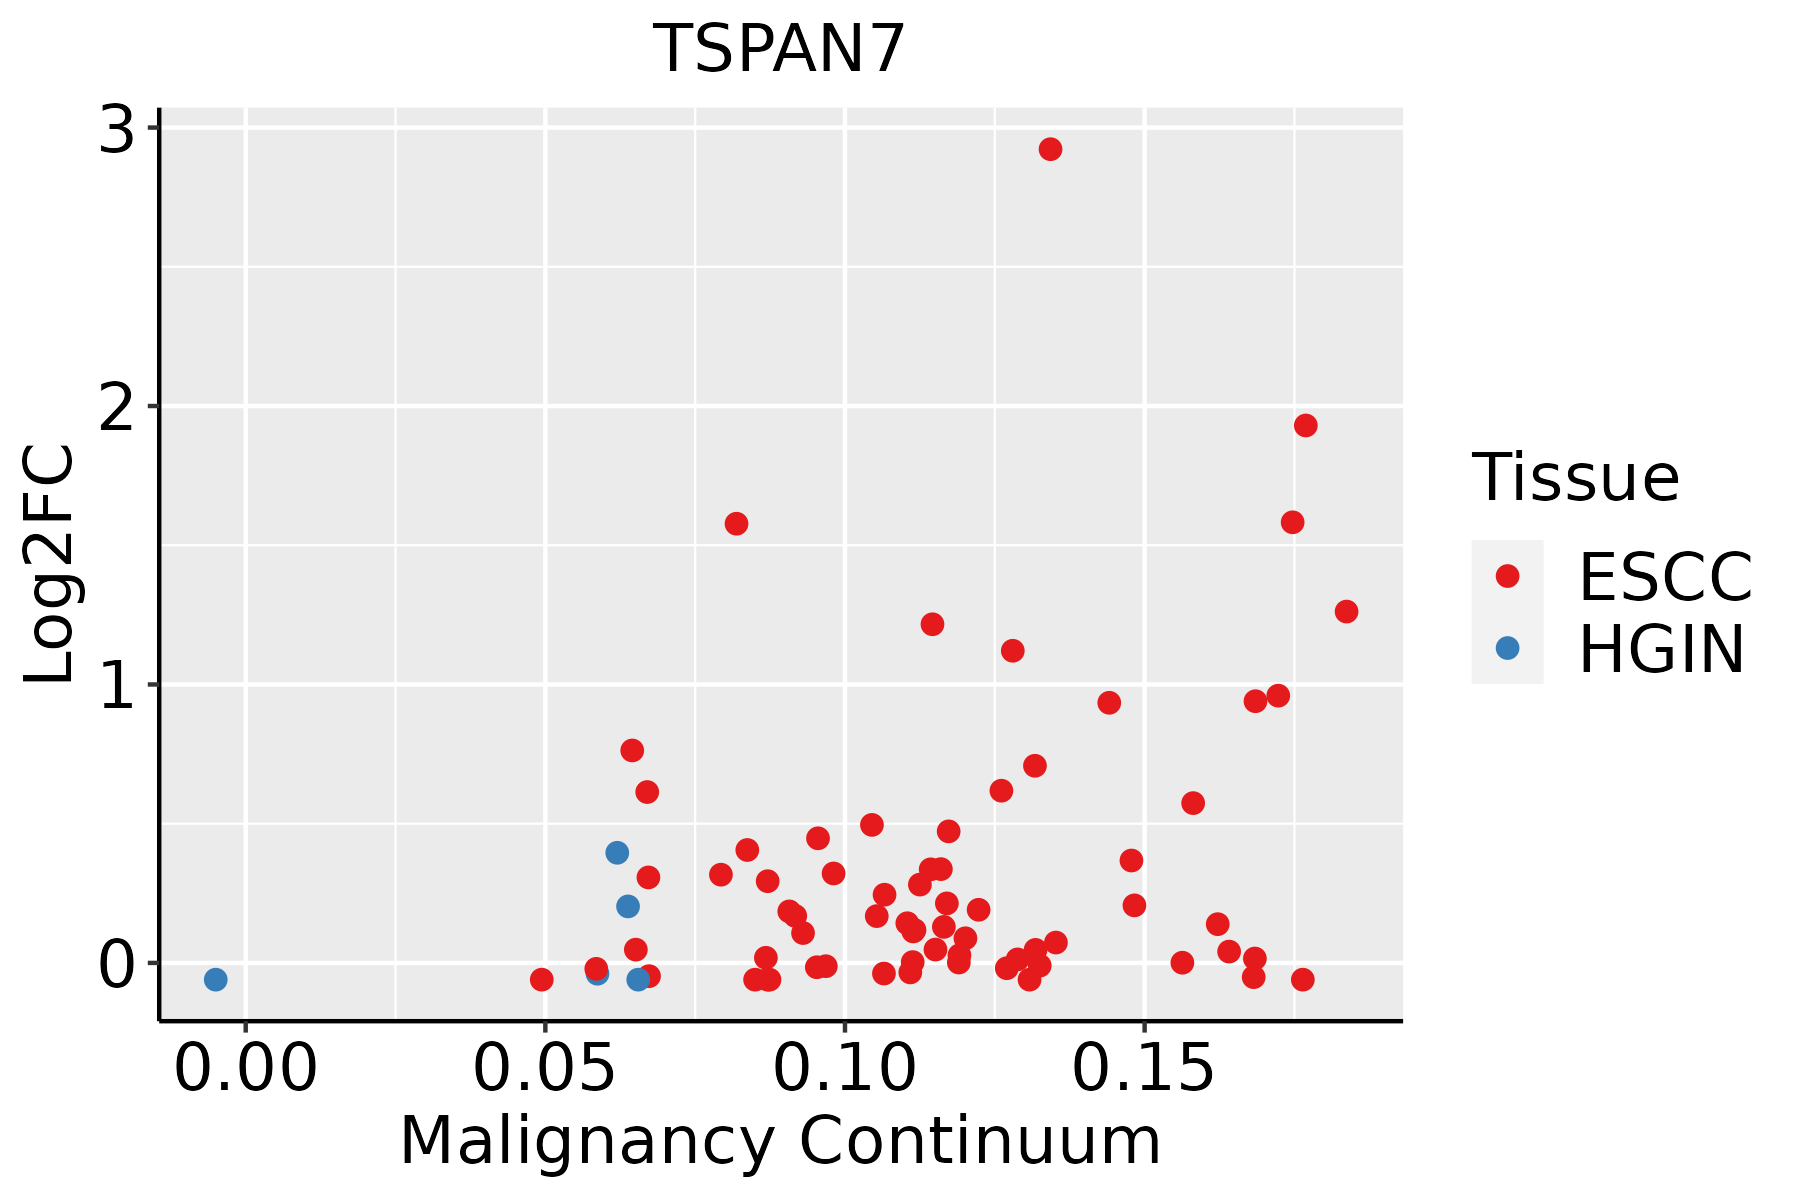 | ESCC: Esophageal squamous cell carcinoma |
| HGIN: High-grade intraepithelial neoplasias | ||
| LGIN: Low-grade intraepithelial neoplasias | ||
| Oral Cavity | 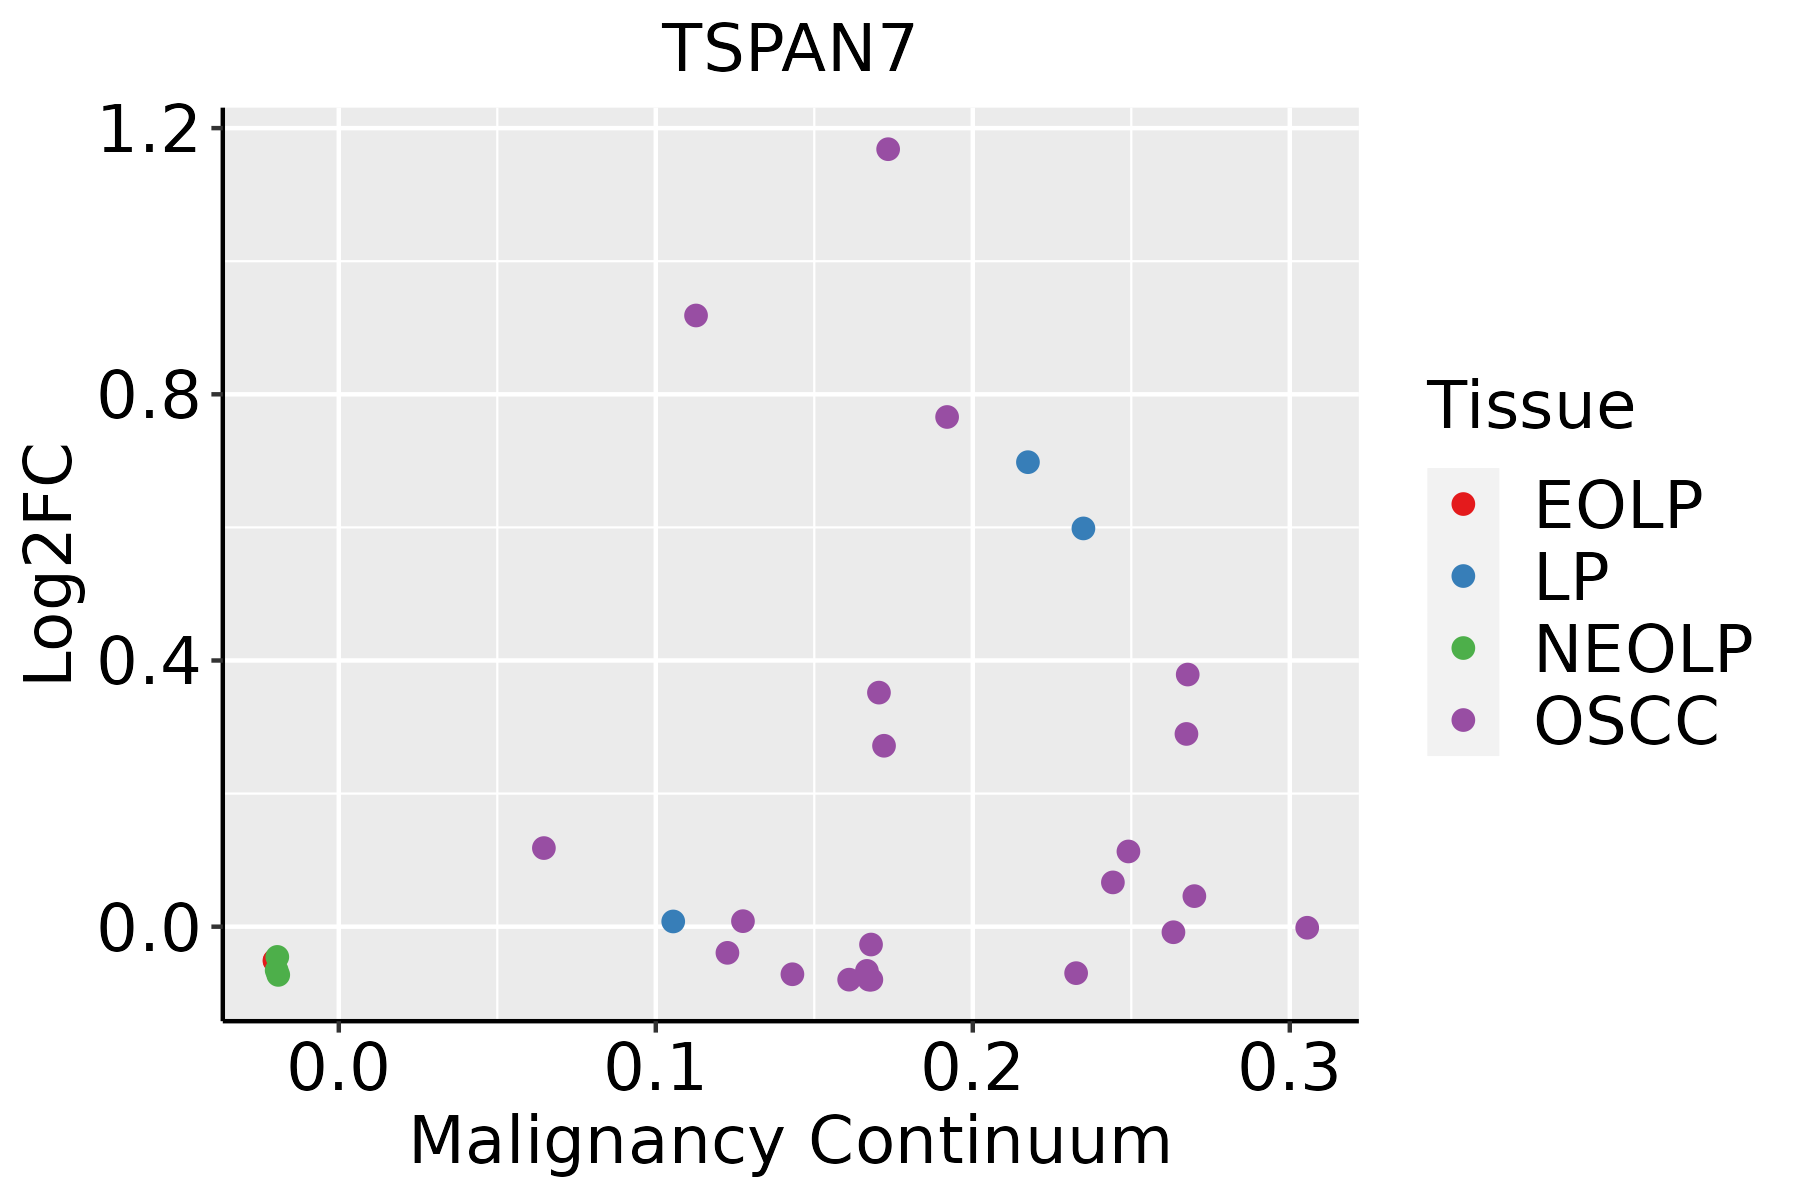 | EOLP: Erosive Oral lichen planus |
| LP: leukoplakia | ||
| NEOLP: Non-erosive oral lichen planus | ||
| OSCC: Oral squamous cell carcinoma |
| ∗log2FC in expression of this searched gene in stem-like cells from each diseased tissue sample relative to stem-like cells in normal samples in each tissue plotted against the malignancy continuum. Samples are colored based on if they are from different disease stage. |
Top |
Malignant transformation related pathway analysis |
| Find out the enriched GO biological processes and KEGG pathways involved in transition from healthy to precancer to cancer |
| Tissue | Disease Stage | Enriched GO biological Processes |
| Colorectum | AD |  |
| Colorectum | SER |  |
| Colorectum | MSS |  |
| Colorectum | MSI-H |  |
| Colorectum | FAP |  |
| ∗Top 15 enriched GO BP terms are showed in the bar plot of each disease state in each tissue. Each row represents a significant GO biological process which is colored according to the -log10(p.adjust). |
| Page: 1 2 3 4 5 6 7 8 9 |
| GO ID | Tissue | Disease Stage | Description | Gene Ratio | Bg Ratio | pvalue | p.adjust | Count |
| Page: 1 |
| Pathway ID | Tissue | Disease Stage | Description | Gene Ratio | Bg Ratio | pvalue | p.adjust | qvalue | Count |
| hsa052028 | Esophagus | ESCC | Transcriptional misregulation in cancer | 116/4205 | 193/8465 | 2.08e-03 | 5.95e-03 | 3.05e-03 | 116 |
| hsa0520213 | Esophagus | ESCC | Transcriptional misregulation in cancer | 116/4205 | 193/8465 | 2.08e-03 | 5.95e-03 | 3.05e-03 | 116 |
| Page: 1 |
Top |
Cell-cell communication analysis |
| Identification of potential cell-cell interactions between two cell types and their ligand-receptor pairs for different disease states |
| Ligand | Receptor | LRpair | Pathway | Tissue | Disease Stage |
| Page: 1 |
Top |
Single-cell gene regulatory network inference analysis |
| Find out the significant the regulons (TFs) and the target genes of each regulon across cell types for different disease states |
| TF | Cell Type | Tissue | Disease Stage | Target Gene | RSS | Regulon Activity |
| ∗The dot plots of a searched regulon are shown for all cell subpopulations in each disease state of each tissue based on the regulon specific score inferred using pySCENIC and by calculating the average expression. |
| Page: 1 |
Top |
Somatic mutation of malignant transformation related genes |
| Annotation of somatic variants for genes involved in malignant transformation |
| Hugo Symbol | Variant Class | Variant Classification | dbSNP RS | HGVSc | HGVSp | HGVSp Short | SWISSPROT | BIOTYPE | SIFT | PolyPhen | Tumor Sample Barcode | Tissue | Histology | Sex | Age | Stage | Therapy Types | Drugs | Outcome |
| TSPAN7 | SNV | Missense_Mutation | c.389N>A | p.Thr130Asn | p.T130N | P41732 | protein_coding | tolerated(1) | benign(0) | TCGA-C8-A137-01 | Breast | breast invasive carcinoma | Female | <65 | I/II | Unknown | Unknown | PD | |
| TSPAN7 | SNV | Missense_Mutation | rs868156656 | c.670N>A | p.Ala224Thr | p.A224T | P41732 | protein_coding | tolerated(0.09) | probably_damaging(1) | TCGA-2W-A8YY-01 | Cervix | cervical & endocervical cancer | Female | <65 | I/II | Chemotherapy | cisplatin | CR |
| TSPAN7 | SNV | Missense_Mutation | c.565N>G | p.Leu189Val | p.L189V | P41732 | protein_coding | tolerated(1) | benign(0.011) | TCGA-LP-A4AV-01 | Cervix | cervical & endocervical cancer | Female | <65 | I/II | Unknown | Unknown | SD | |
| TSPAN7 | SNV | Missense_Mutation | c.71T>C | p.Phe24Ser | p.F24S | P41732 | protein_coding | deleterious(0.02) | benign(0.169) | TCGA-A6-5661-01 | Colorectum | colon adenocarcinoma | Female | >=65 | I/II | Unknown | Unknown | SD | |
| TSPAN7 | SNV | Missense_Mutation | c.244C>T | p.Arg82Cys | p.R82C | P41732 | protein_coding | deleterious(0) | probably_damaging(0.969) | TCGA-AA-3966-01 | Colorectum | colon adenocarcinoma | Female | >=65 | I/II | Unknown | Unknown | SD | |
| TSPAN7 | SNV | Missense_Mutation | c.617N>T | p.Thr206Ile | p.T206I | P41732 | protein_coding | tolerated(0.2) | benign(0.088) | TCGA-AD-5900-01 | Colorectum | colon adenocarcinoma | Male | >=65 | I/II | Unknown | Unknown | SD | |
| TSPAN7 | SNV | Missense_Mutation | c.8N>G | p.Ser3Trp | p.S3W | P41732 | protein_coding | deleterious(0.01) | probably_damaging(0.969) | TCGA-CK-4951-01 | Colorectum | colon adenocarcinoma | Female | >=65 | I/II | Unknown | Unknown | PD | |
| TSPAN7 | SNV | Missense_Mutation | c.512N>T | p.Pro171Leu | p.P171L | P41732 | protein_coding | deleterious(0) | probably_damaging(0.999) | TCGA-DM-A285-01 | Colorectum | colon adenocarcinoma | Female | >=65 | III/IV | Unknown | Unknown | SD | |
| TSPAN7 | SNV | Missense_Mutation | novel | c.608N>C | p.Asp203Ala | p.D203A | P41732 | protein_coding | tolerated(0.48) | benign(0.003) | TCGA-F5-6814-01 | Colorectum | rectum adenocarcinoma | Male | <65 | I/II | Unknown | Unknown | SD |
| TSPAN7 | SNV | Missense_Mutation | novel | c.446G>A | p.Ser149Asn | p.S149N | P41732 | protein_coding | tolerated(0.15) | benign(0.015) | TCGA-A5-A1OF-01 | Endometrium | uterine corpus endometrioid carcinoma | Female | <65 | I/II | Unknown | Unknown | SD |
| Page: 1 2 3 |
Top |
Related drugs of malignant transformation related genes |
| Identification of chemicals and drugs interact with genes involved in malignant transfromation |
| (DGIdb 4.0) |
| Entrez ID | Symbol | Category | Interaction Types | Drug Claim Name | Drug Name | PMIDs |
| Page: 1 |

Copyright 2023-Present -The University of Texas Health Science Center at Houston |