
|
|||||
|
 | |
| |
| |
| |
| |
| |
|
Gene: TSPAN5 |
Gene summary for TSPAN5 |
| Gene information | Species | Human | Gene symbol | TSPAN5 | Gene ID | 10098 |
| Gene name | tetraspanin 5 | |
| Gene Alias | NET-4 | |
| Cytomap | 4q23 | |
| Gene Type | protein-coding | GO ID | GO:0006807 | UniProtAcc | P62079 |
Top |
Malignant transformation analysis |
| Identification of the aberrant gene expression in precancerous and cancerous lesions by comparing the gene expression of stem-like cells in diseased tissues with normal stem cells |
| Entrez ID | Symbol | Replicates | Species | Organ | Tissue | Adj P-value | Log2FC | Malignancy |
| 10098 | TSPAN5 | CCI_1 | Human | Cervix | CC | 1.38e-19 | 1.53e+00 | 0.528 |
| 10098 | TSPAN5 | CCI_3 | Human | Cervix | CC | 6.60e-09 | 7.02e-01 | 0.516 |
| 10098 | TSPAN5 | Tumor | Human | Cervix | CC | 4.18e-02 | 1.65e-01 | 0.1241 |
| 10098 | TSPAN5 | sample3 | Human | Cervix | CC | 8.50e-04 | 2.18e-01 | 0.1387 |
| 10098 | TSPAN5 | T3 | Human | Cervix | CC | 2.43e-05 | 1.91e-01 | 0.1389 |
| 10098 | TSPAN5 | HTA11_7696_3000711011 | Human | Colorectum | AD | 2.86e-02 | 1.36e-01 | 0.0674 |
| 10098 | TSPAN5 | HTA11_6818_2000001021 | Human | Colorectum | AD | 8.15e-03 | 5.50e-01 | 0.0588 |
| 10098 | TSPAN5 | HTA11_99999970781_79442 | Human | Colorectum | MSS | 5.45e-19 | 8.32e-01 | 0.294 |
| 10098 | TSPAN5 | HTA11_99999965062_69753 | Human | Colorectum | MSI-H | 5.68e-06 | 2.19e+00 | 0.3487 |
| 10098 | TSPAN5 | HTA11_99999965104_69814 | Human | Colorectum | MSS | 5.05e-08 | 5.25e-01 | 0.281 |
| 10098 | TSPAN5 | HTA11_99999971662_82457 | Human | Colorectum | MSS | 3.35e-17 | 7.73e-01 | 0.3859 |
| 10098 | TSPAN5 | A002-C-010 | Human | Colorectum | FAP | 1.48e-04 | 3.95e-01 | 0.242 |
| 10098 | TSPAN5 | A002-C-021 | Human | Colorectum | FAP | 5.50e-11 | 5.12e-01 | 0.1171 |
| 10098 | TSPAN5 | A001-C-104 | Human | Colorectum | FAP | 5.07e-07 | 5.06e-01 | 0.0184 |
| 10098 | TSPAN5 | CRC-1-8810 | Human | Colorectum | CRC | 9.83e-03 | 3.64e-01 | 0.6257 |
| 10098 | TSPAN5 | CRC-3-11773 | Human | Colorectum | CRC | 3.13e-02 | 3.61e-01 | 0.2564 |
| 10098 | TSPAN5 | LZE22T | Human | Esophagus | ESCC | 4.49e-06 | 4.73e-01 | 0.068 |
| 10098 | TSPAN5 | LZE24T | Human | Esophagus | ESCC | 2.29e-20 | 4.43e-01 | 0.0596 |
| 10098 | TSPAN5 | P2T-E | Human | Esophagus | ESCC | 7.16e-09 | 5.21e-02 | 0.1177 |
| 10098 | TSPAN5 | P4T-E | Human | Esophagus | ESCC | 6.65e-41 | 1.01e+00 | 0.1323 |
| Page: 1 2 3 4 5 6 7 |
| Tissue | Expression Dynamics | Abbreviation |
| Cervix | 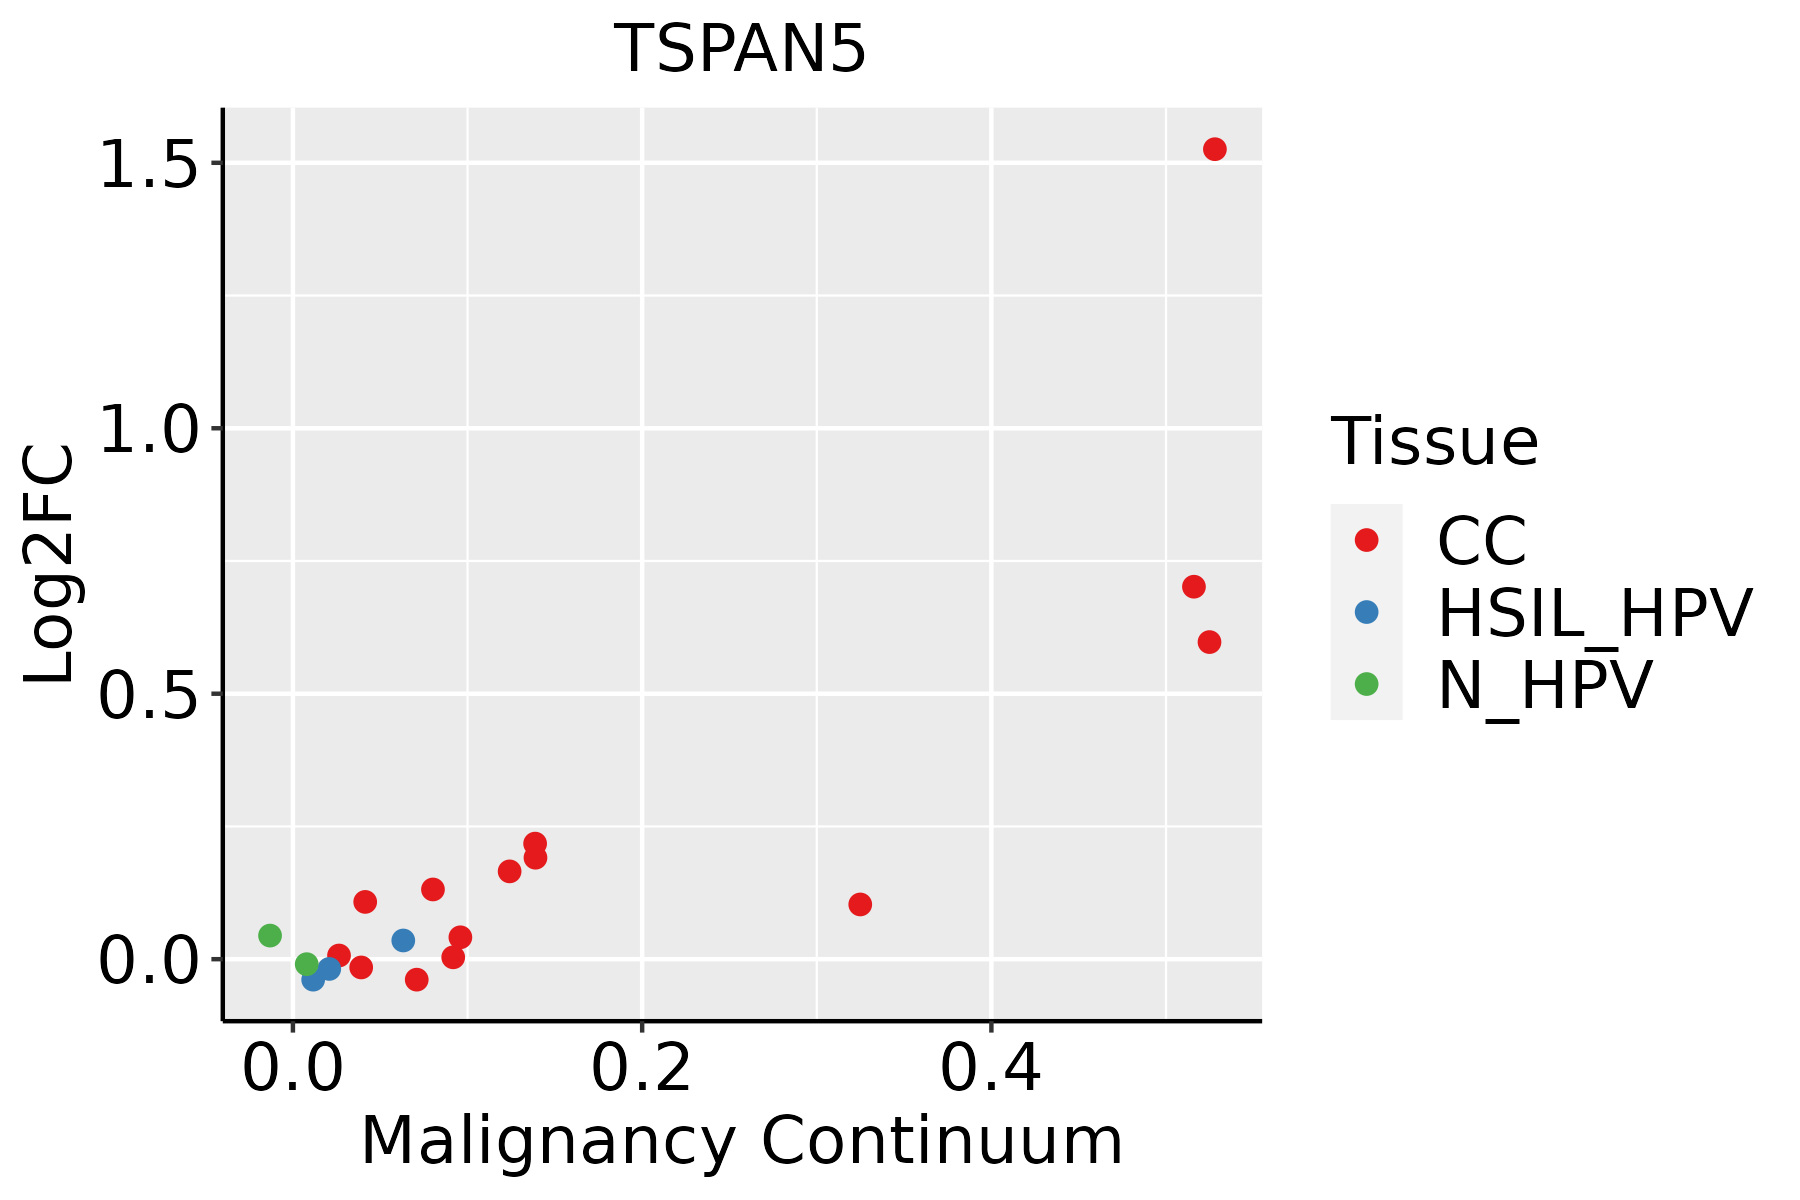 | CC: Cervix cancer |
| HSIL_HPV: HPV-infected high-grade squamous intraepithelial lesions | ||
| N_HPV: HPV-infected normal cervix | ||
| Colorectum (GSE201348) |  | FAP: Familial adenomatous polyposis |
| CRC: Colorectal cancer | ||
| Colorectum (HTA11) |  | AD: Adenomas |
| SER: Sessile serrated lesions | ||
| MSI-H: Microsatellite-high colorectal cancer | ||
| MSS: Microsatellite stable colorectal cancer | ||
| Esophagus | 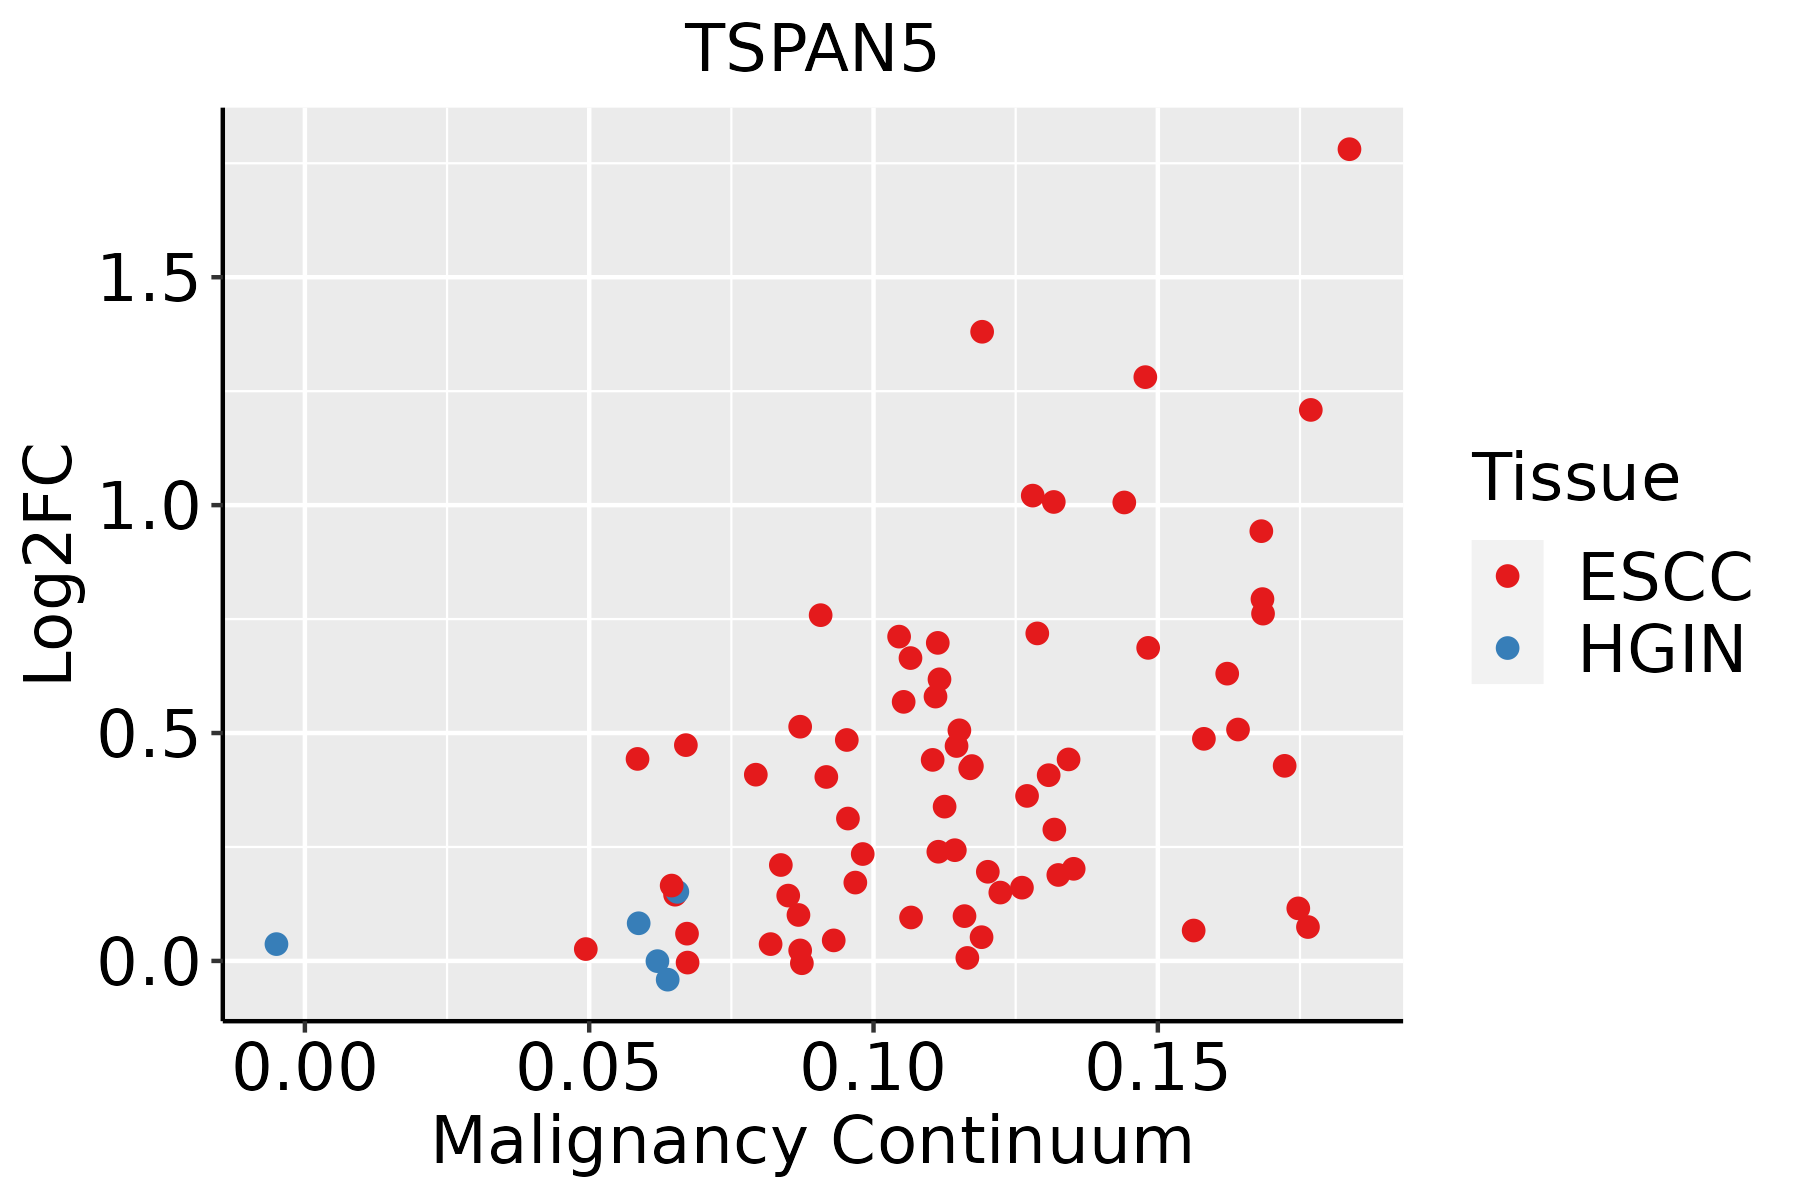 | ESCC: Esophageal squamous cell carcinoma |
| HGIN: High-grade intraepithelial neoplasias | ||
| LGIN: Low-grade intraepithelial neoplasias | ||
| Liver | 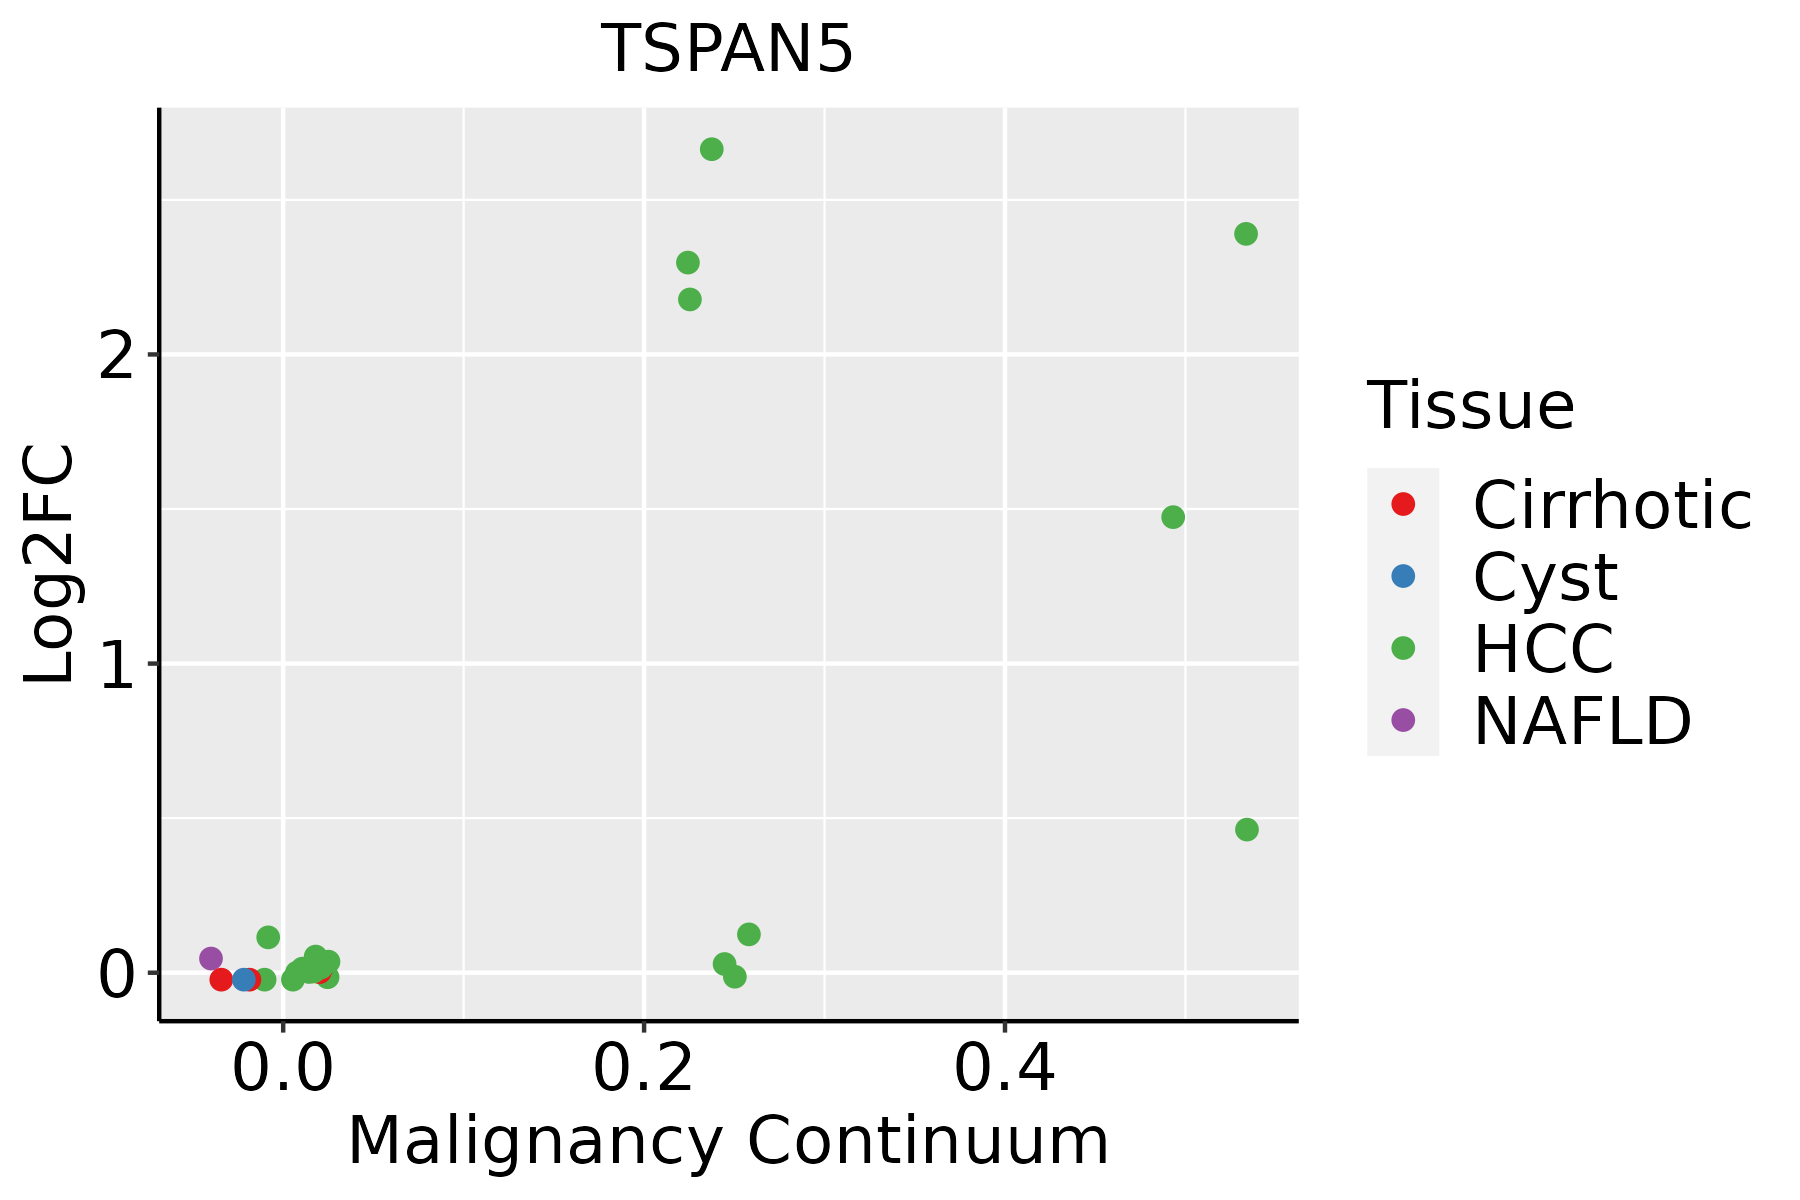 | HCC: Hepatocellular carcinoma |
| NAFLD: Non-alcoholic fatty liver disease | ||
| Lung |  | AAH: Atypical adenomatous hyperplasia |
| AIS: Adenocarcinoma in situ | ||
| IAC: Invasive lung adenocarcinoma | ||
| MIA: Minimally invasive adenocarcinoma | ||
| Oral Cavity | 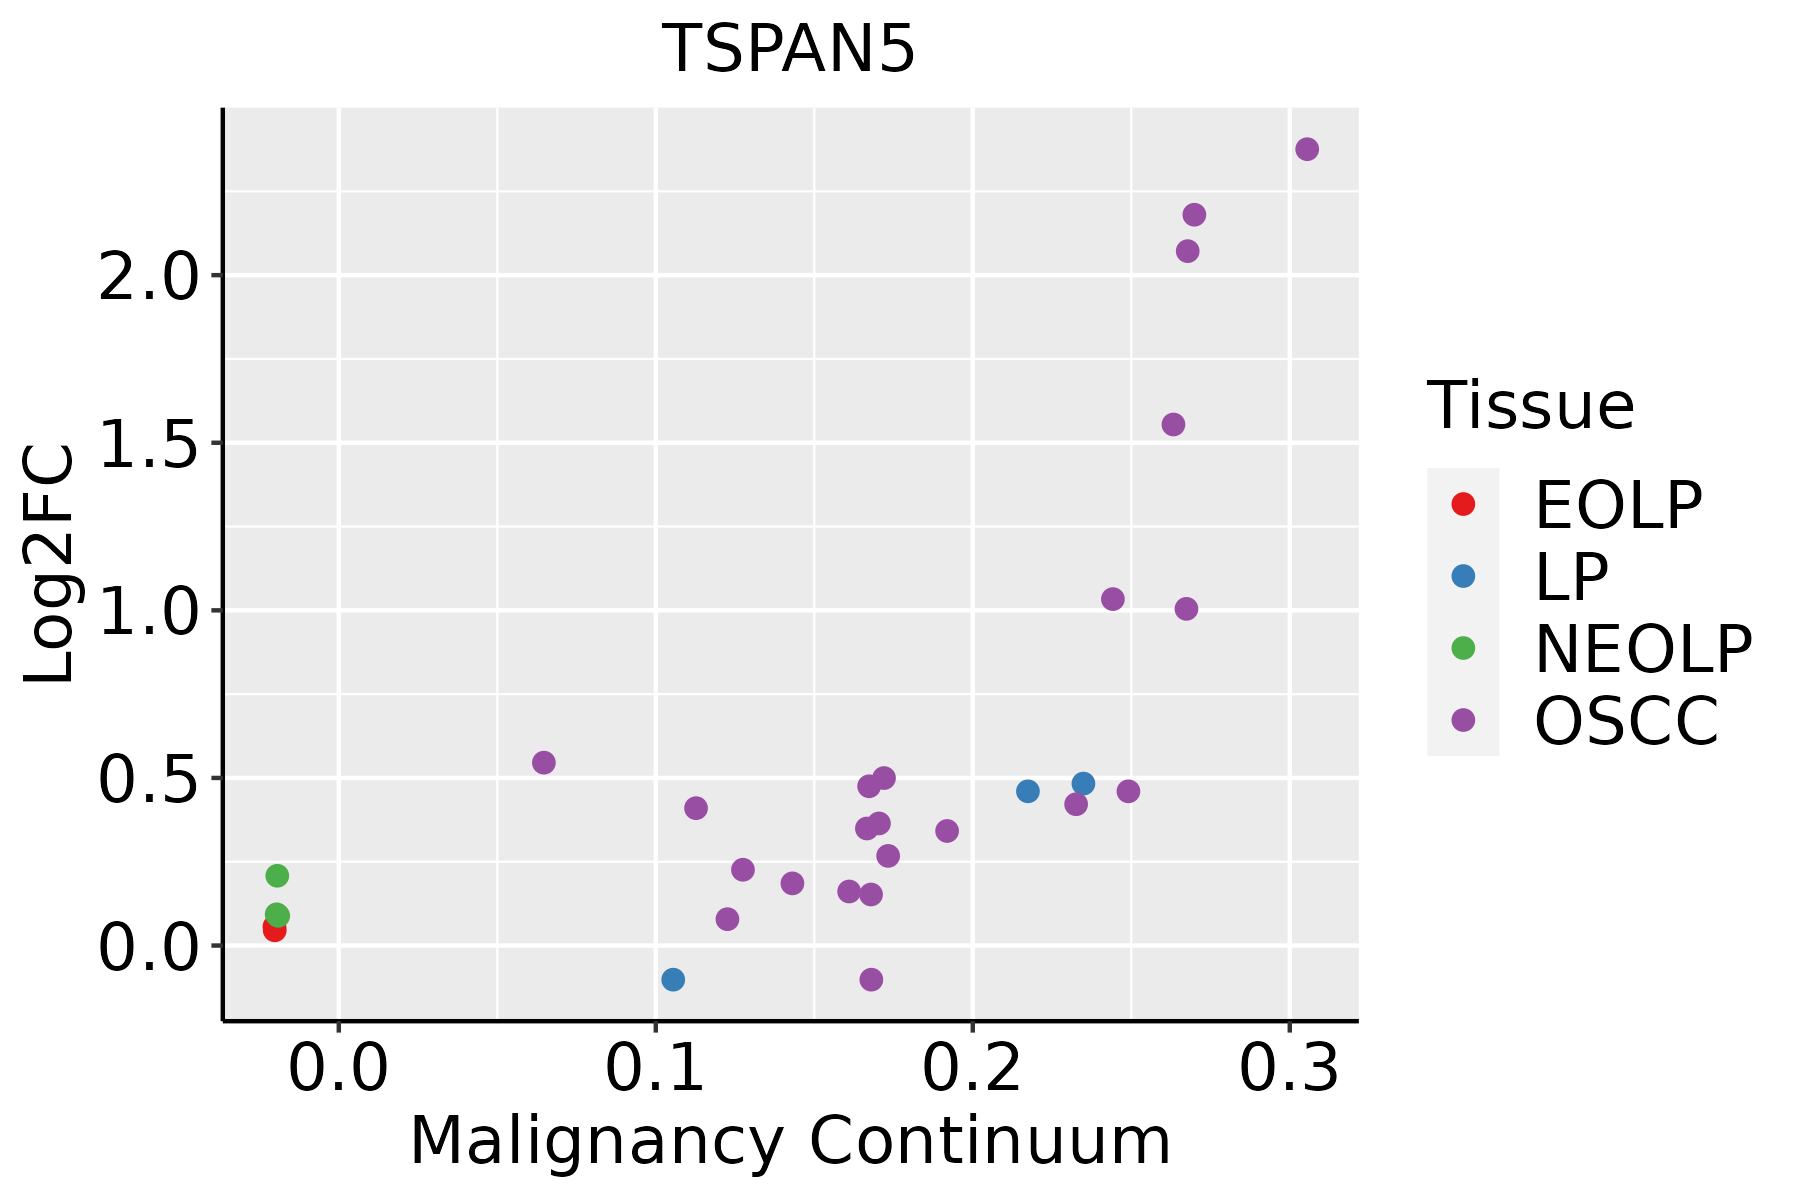 | EOLP: Erosive Oral lichen planus |
| LP: leukoplakia | ||
| NEOLP: Non-erosive oral lichen planus | ||
| OSCC: Oral squamous cell carcinoma | ||
| Prostate | 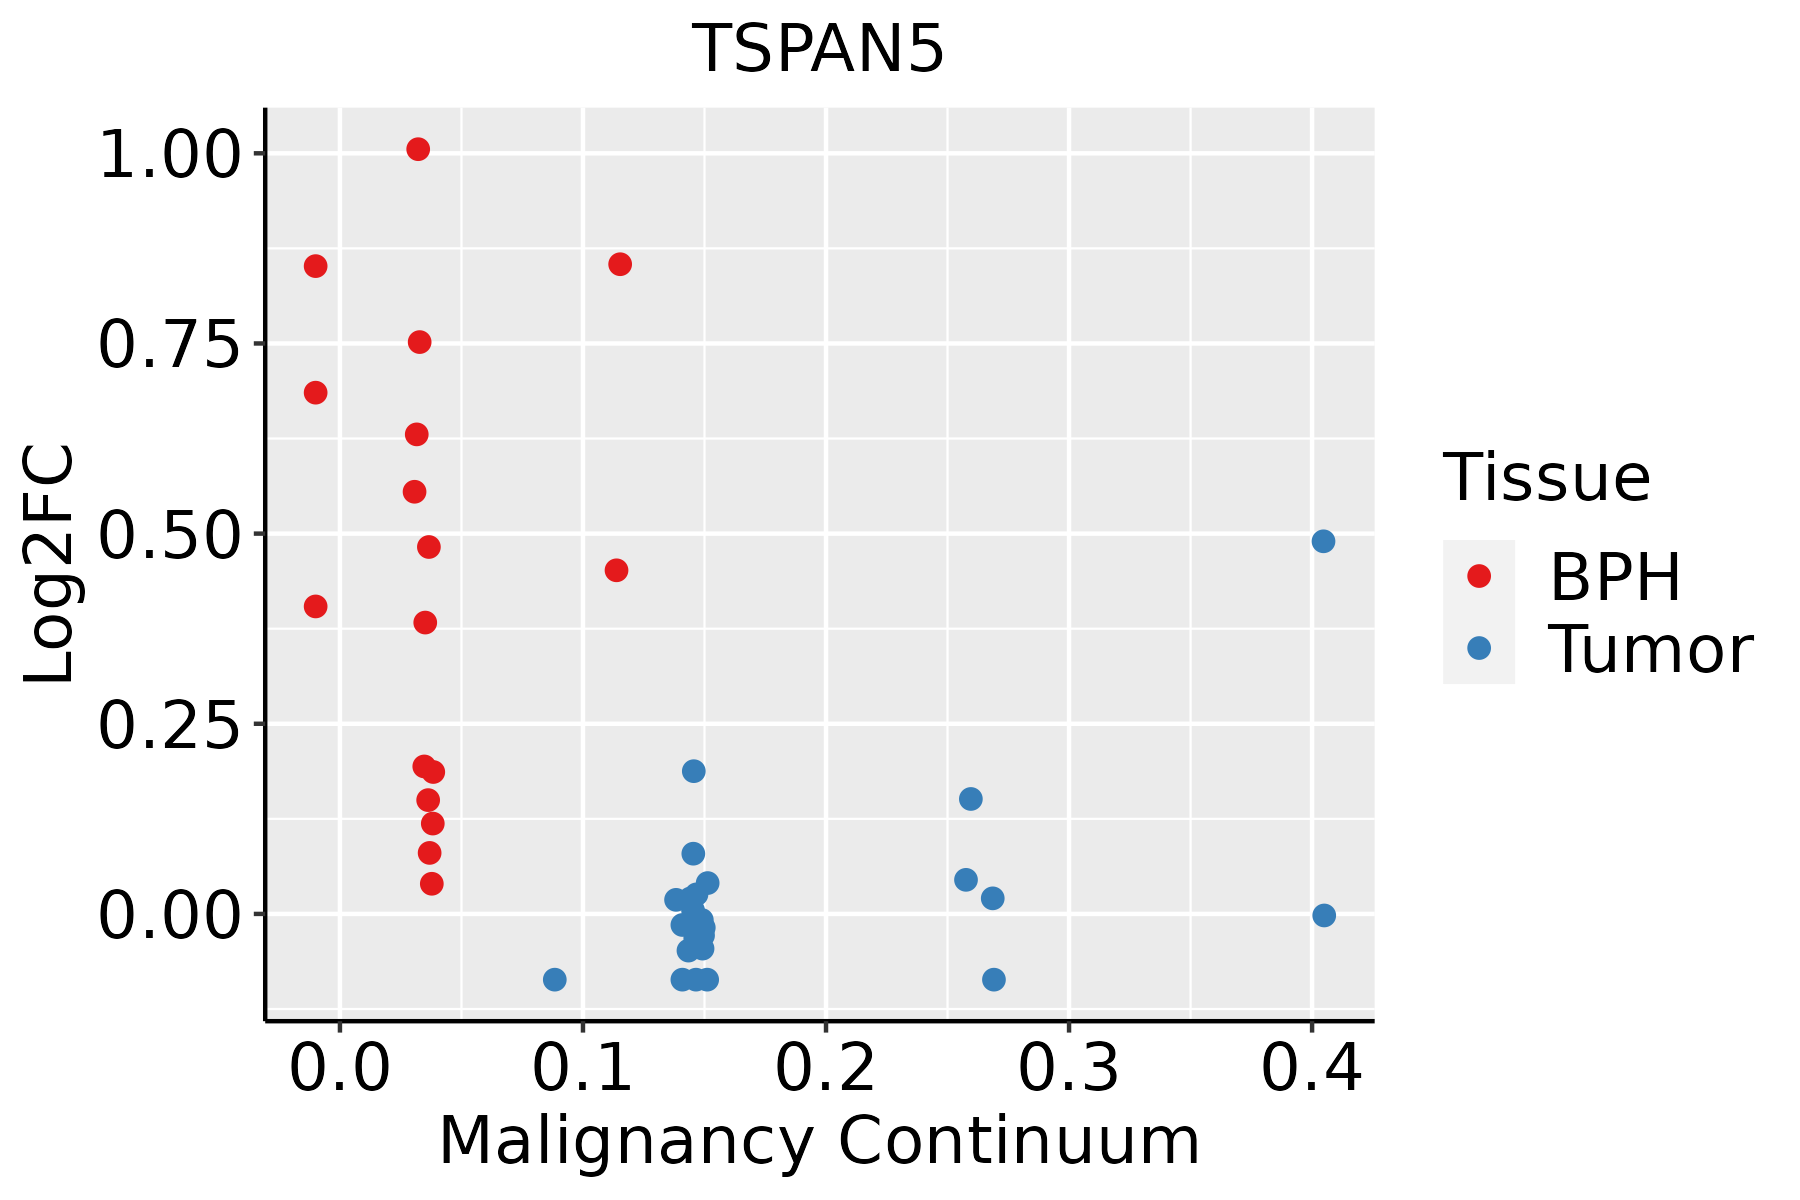 | BPH: Benign Prostatic Hyperplasia |
| Skin |  | AK: Actinic keratosis |
| cSCC: Cutaneous squamous cell carcinoma | ||
| SCCIS:squamous cell carcinoma in situ | ||
| Thyroid |  | ATC: Anaplastic thyroid cancer |
| HT: Hashimoto's thyroiditis | ||
| PTC: Papillary thyroid cancer |
| ∗log2FC in expression of this searched gene in stem-like cells from each diseased tissue sample relative to stem-like cells in normal samples in each tissue plotted against the malignancy continuum. Samples are colored based on if they are from different disease stage. |
Top |
Malignant transformation related pathway analysis |
| Find out the enriched GO biological processes and KEGG pathways involved in transition from healthy to precancer to cancer |
| Tissue | Disease Stage | Enriched GO biological Processes |
| Colorectum | AD |  |
| Colorectum | SER |  |
| Colorectum | MSS |  |
| Colorectum | MSI-H |  |
| Colorectum | FAP |  |
| ∗Top 15 enriched GO BP terms are showed in the bar plot of each disease state in each tissue. Each row represents a significant GO biological process which is colored according to the -log10(p.adjust). |
| Page: 1 2 3 4 5 6 7 8 9 |
| GO ID | Tissue | Disease Stage | Description | Gene Ratio | Bg Ratio | pvalue | p.adjust | Count |
| GO:007265910 | Cervix | CC | protein localization to plasma membrane | 73/2311 | 284/18723 | 4.95e-10 | 6.73e-08 | 73 |
| GO:19907788 | Cervix | CC | protein localization to cell periphery | 78/2311 | 333/18723 | 1.22e-08 | 9.73e-07 | 78 |
| GO:00072194 | Cervix | CC | Notch signaling pathway | 39/2311 | 172/18723 | 1.08e-04 | 1.38e-03 | 39 |
| GO:00085933 | Cervix | CC | regulation of Notch signaling pathway | 25/2311 | 95/18723 | 1.61e-04 | 1.93e-03 | 25 |
| GO:00516048 | Cervix | CC | protein maturation | 56/2311 | 294/18723 | 5.90e-04 | 5.59e-03 | 56 |
| GO:0045747 | Cervix | CC | positive regulation of Notch signaling pathway | 13/2311 | 47/18723 | 3.62e-03 | 2.31e-02 | 13 |
| GO:0072659 | Colorectum | AD | protein localization to plasma membrane | 122/3918 | 284/18723 | 2.86e-17 | 1.49e-14 | 122 |
| GO:1990778 | Colorectum | AD | protein localization to cell periphery | 129/3918 | 333/18723 | 5.51e-14 | 1.15e-11 | 129 |
| GO:0051604 | Colorectum | AD | protein maturation | 85/3918 | 294/18723 | 6.73e-04 | 6.91e-03 | 85 |
| GO:0007219 | Colorectum | AD | Notch signaling pathway | 50/3918 | 172/18723 | 6.92e-03 | 4.26e-02 | 50 |
| GO:00726592 | Colorectum | MSS | protein localization to plasma membrane | 113/3467 | 284/18723 | 3.23e-17 | 1.55e-14 | 113 |
| GO:19907782 | Colorectum | MSS | protein localization to cell periphery | 120/3467 | 333/18723 | 2.02e-14 | 5.47e-12 | 120 |
| GO:00516042 | Colorectum | MSS | protein maturation | 75/3467 | 294/18723 | 1.70e-03 | 1.53e-02 | 75 |
| GO:00726593 | Colorectum | MSI-H | protein localization to plasma membrane | 38/1319 | 284/18723 | 1.03e-04 | 3.18e-03 | 38 |
| GO:19907783 | Colorectum | MSI-H | protein localization to cell periphery | 40/1319 | 333/18723 | 6.61e-04 | 1.27e-02 | 40 |
| GO:00516043 | Colorectum | MSI-H | protein maturation | 34/1319 | 294/18723 | 3.02e-03 | 3.80e-02 | 34 |
| GO:00726594 | Colorectum | FAP | protein localization to plasma membrane | 95/2622 | 284/18723 | 4.86e-17 | 9.93e-14 | 95 |
| GO:19907784 | Colorectum | FAP | protein localization to cell periphery | 100/2622 | 333/18723 | 2.19e-14 | 2.68e-11 | 100 |
| GO:00072191 | Colorectum | FAP | Notch signaling pathway | 38/2622 | 172/18723 | 2.56e-03 | 2.01e-02 | 38 |
| GO:00726595 | Colorectum | CRC | protein localization to plasma membrane | 80/2078 | 284/18723 | 1.36e-15 | 4.07e-12 | 80 |
| Page: 1 2 3 4 |
| Pathway ID | Tissue | Disease Stage | Description | Gene Ratio | Bg Ratio | pvalue | p.adjust | qvalue | Count |
| Page: 1 |
Top |
Cell-cell communication analysis |
| Identification of potential cell-cell interactions between two cell types and their ligand-receptor pairs for different disease states |
| Ligand | Receptor | LRpair | Pathway | Tissue | Disease Stage |
| Page: 1 |
Top |
Single-cell gene regulatory network inference analysis |
| Find out the significant the regulons (TFs) and the target genes of each regulon across cell types for different disease states |
| TF | Cell Type | Tissue | Disease Stage | Target Gene | RSS | Regulon Activity |
| ∗The dot plots of a searched regulon are shown for all cell subpopulations in each disease state of each tissue based on the regulon specific score inferred using pySCENIC and by calculating the average expression. |
| Page: 1 |
Top |
Somatic mutation of malignant transformation related genes |
| Annotation of somatic variants for genes involved in malignant transformation |
| Hugo Symbol | Variant Class | Variant Classification | dbSNP RS | HGVSc | HGVSp | HGVSp Short | SWISSPROT | BIOTYPE | SIFT | PolyPhen | Tumor Sample Barcode | Tissue | Histology | Sex | Age | Stage | Therapy Types | Drugs | Outcome |
| TSPAN5 | SNV | Missense_Mutation | c.530N>T | p.Arg177Leu | p.R177L | P62079 | protein_coding | deleterious(0.03) | possibly_damaging(0.839) | TCGA-A2-A4S1-01 | Breast | breast invasive carcinoma | Female | >=65 | I/II | Unknown | Unknown | SD | |
| TSPAN5 | SNV | Missense_Mutation | novel | c.524C>A | p.Ala175Glu | p.A175E | P62079 | protein_coding | tolerated(0.29) | benign(0.062) | TCGA-A7-A426-01 | Breast | breast invasive carcinoma | Female | <65 | III/IV | Chemotherapy | adriamycin | SD |
| TSPAN5 | insertion | Frame_Shift_Ins | novel | c.425_426insA | p.Asn142LysfsTer19 | p.N142Kfs*19 | P62079 | protein_coding | TCGA-D8-A1J8-01 | Breast | breast invasive carcinoma | Female | >=65 | I/II | Hormone Therapy | nolvadex | SD | ||
| TSPAN5 | SNV | Missense_Mutation | c.625G>C | p.Glu209Gln | p.E209Q | P62079 | protein_coding | tolerated(0.45) | benign(0.026) | TCGA-LP-A4AW-01 | Cervix | cervical & endocervical cancer | Female | <65 | I/II | Unknown | Unknown | SD | |
| TSPAN5 | SNV | Missense_Mutation | c.254N>A | p.Arg85Gln | p.R85Q | P62079 | protein_coding | deleterious(0) | probably_damaging(0.971) | TCGA-Q1-A6DT-01 | Cervix | cervical & endocervical cancer | Female | <65 | I/II | Unknown | Unknown | PD | |
| TSPAN5 | SNV | Missense_Mutation | c.239N>A | p.Cys80Tyr | p.C80Y | P62079 | protein_coding | deleterious(0) | probably_damaging(0.981) | TCGA-AA-3715-01 | Colorectum | colon adenocarcinoma | Male | >=65 | I/II | Unknown | Unknown | PD | |
| TSPAN5 | SNV | Missense_Mutation | novel | c.148A>C | p.Ile50Leu | p.I50L | P62079 | protein_coding | tolerated(1) | benign(0.014) | TCGA-AA-3848-01 | Colorectum | colon adenocarcinoma | Female | >=65 | III/IV | Unknown | Unknown | PD |
| TSPAN5 | SNV | Missense_Mutation | c.20N>C | p.Lys7Thr | p.K7T | P62079 | protein_coding | tolerated(0.38) | benign(0.028) | TCGA-AA-A010-01 | Colorectum | colon adenocarcinoma | Female | <65 | I/II | Chemotherapy | folinic | CR | |
| TSPAN5 | SNV | Missense_Mutation | c.220N>G | p.Ile74Val | p.I74V | P62079 | protein_coding | tolerated(0.45) | benign(0.012) | TCGA-AA-A022-01 | Colorectum | colon adenocarcinoma | Female | >=65 | I/II | Unknown | Unknown | SD | |
| TSPAN5 | SNV | Missense_Mutation | c.729N>G | p.Ile243Met | p.I243M | P62079 | protein_coding | deleterious(0) | probably_damaging(0.91) | TCGA-AD-6895-01 | Colorectum | colon adenocarcinoma | Male | >=65 | III/IV | Unknown | Unknown | SD |
| Page: 1 2 3 4 5 |
Top |
Related drugs of malignant transformation related genes |
| Identification of chemicals and drugs interact with genes involved in malignant transfromation |
| (DGIdb 4.0) |
| Entrez ID | Symbol | Category | Interaction Types | Drug Claim Name | Drug Name | PMIDs |
| 10098 | TSPAN5 | CELL SURFACE | citalopram | CITALOPRAM | 26903268 | |
| 10098 | TSPAN5 | CELL SURFACE | escitalopram | ESCITALOPRAM | 26903268 |
| Page: 1 |

Copyright 2023-Present -The University of Texas Health Science Center at Houston |