
|
|||||
|
 | |
| |
| |
| |
| |
| |
|
Gene: TSPAN33 |
Gene summary for TSPAN33 |
| Gene information | Species | Human | Gene symbol | TSPAN33 | Gene ID | 340348 |
| Gene name | tetraspanin 33 | |
| Gene Alias | PEN | |
| Cytomap | 7q32.1 | |
| Gene Type | protein-coding | GO ID | GO:0006807 | UniProtAcc | Q86UF1 |
Top |
Malignant transformation analysis |
| Identification of the aberrant gene expression in precancerous and cancerous lesions by comparing the gene expression of stem-like cells in diseased tissues with normal stem cells |
| Entrez ID | Symbol | Replicates | Species | Organ | Tissue | Adj P-value | Log2FC | Malignancy |
| 340348 | TSPAN33 | HCC1_Meng | Human | Liver | HCC | 1.79e-55 | 1.23e-01 | 0.0246 |
| 340348 | TSPAN33 | HCC1 | Human | Liver | HCC | 9.76e-09 | 4.15e+00 | 0.5336 |
| 340348 | TSPAN33 | HCC2 | Human | Liver | HCC | 1.03e-32 | 4.70e+00 | 0.5341 |
| 340348 | TSPAN33 | S014 | Human | Liver | HCC | 6.89e-24 | 6.66e-01 | 0.2254 |
| 340348 | TSPAN33 | S015 | Human | Liver | HCC | 3.49e-15 | 6.19e-01 | 0.2375 |
| 340348 | TSPAN33 | S016 | Human | Liver | HCC | 1.19e-19 | 5.73e-01 | 0.2243 |
| 340348 | TSPAN33 | S028 | Human | Liver | HCC | 3.03e-06 | 3.06e-01 | 0.2503 |
| 340348 | TSPAN33 | S029 | Human | Liver | HCC | 9.85e-05 | 2.43e-01 | 0.2581 |
| Page: 1 |
| Tissue | Expression Dynamics | Abbreviation |
| Liver | 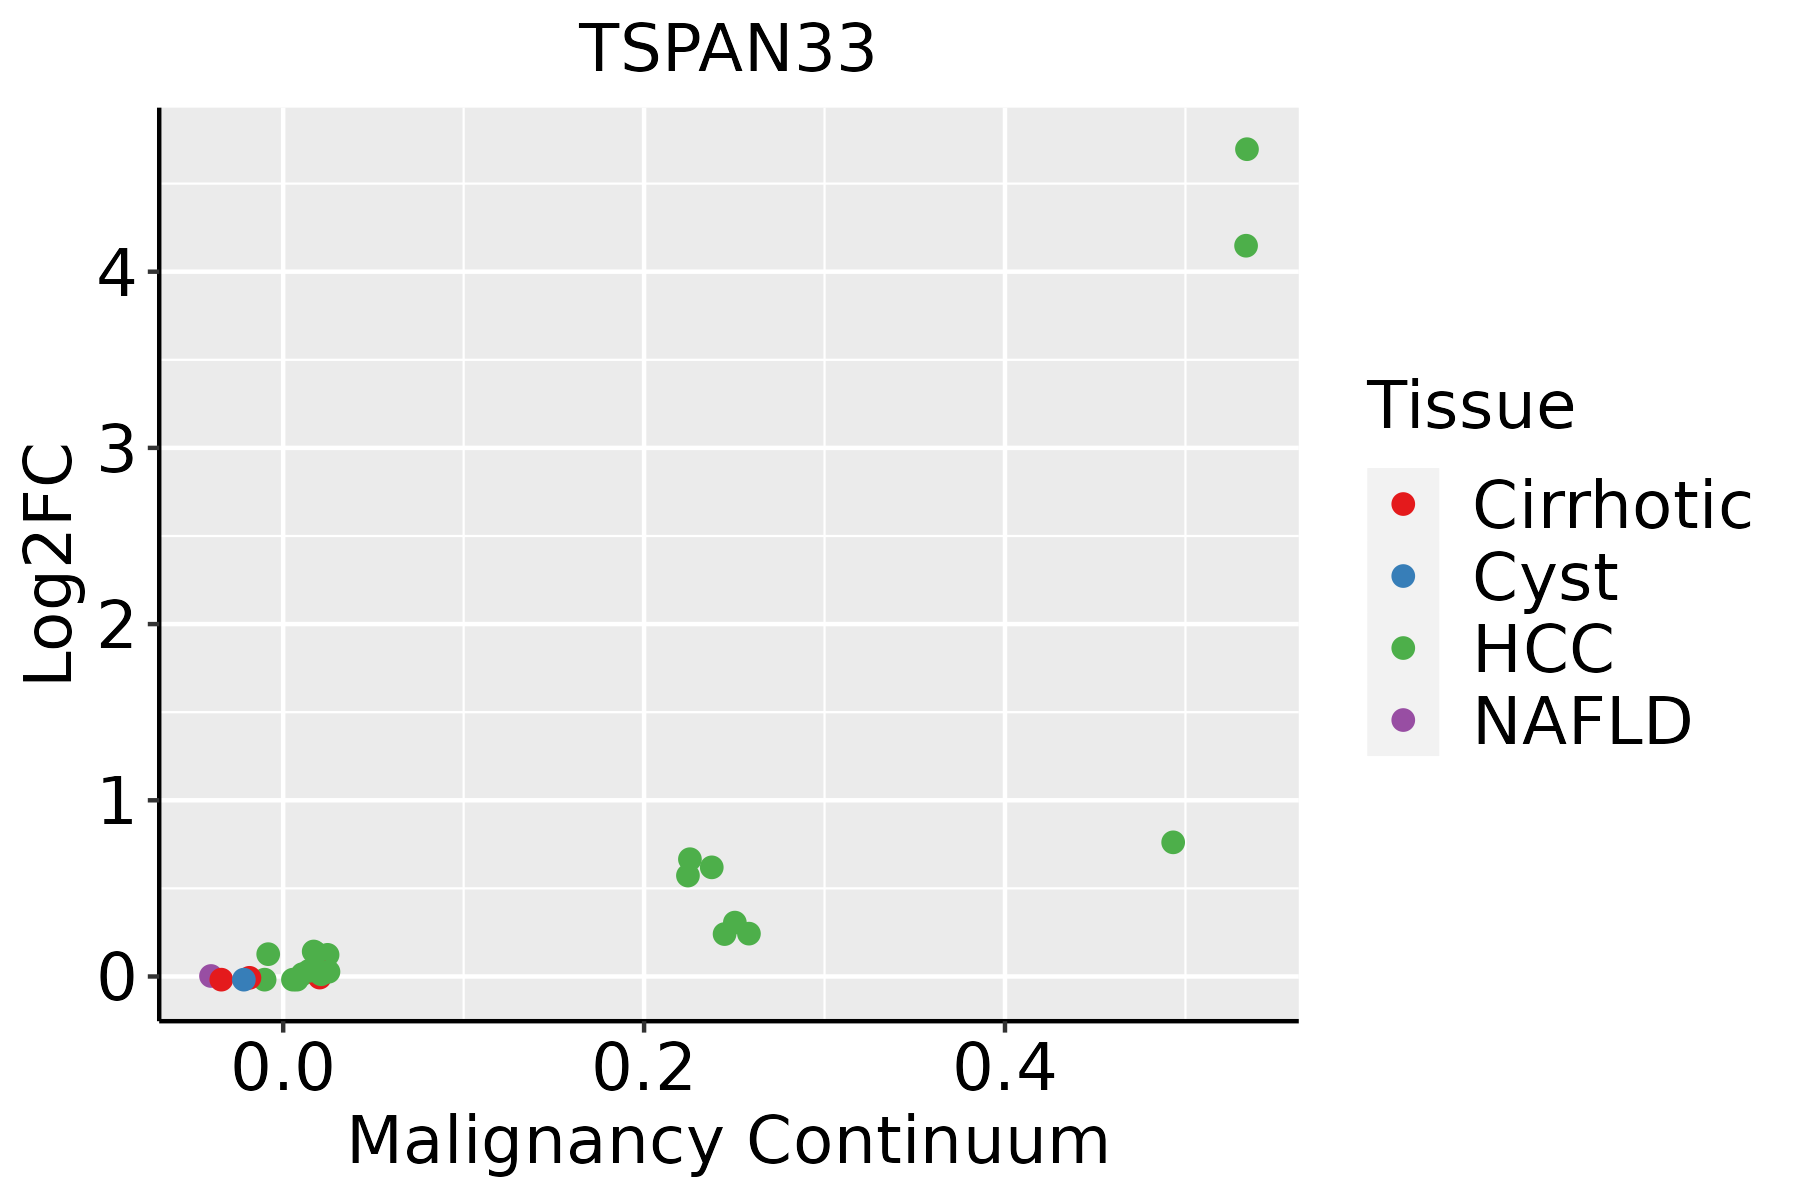 | HCC: Hepatocellular carcinoma |
| NAFLD: Non-alcoholic fatty liver disease |
| ∗log2FC in expression of this searched gene in stem-like cells from each diseased tissue sample relative to stem-like cells in normal samples in each tissue plotted against the malignancy continuum. Samples are colored based on if they are from different disease stage. |
Top |
Malignant transformation related pathway analysis |
| Find out the enriched GO biological processes and KEGG pathways involved in transition from healthy to precancer to cancer |
| Tissue | Disease Stage | Enriched GO biological Processes |
| Colorectum | AD |  |
| Colorectum | SER |  |
| Colorectum | MSS |  |
| Colorectum | MSI-H |  |
| Colorectum | FAP |  |
| ∗Top 15 enriched GO BP terms are showed in the bar plot of each disease state in each tissue. Each row represents a significant GO biological process which is colored according to the -log10(p.adjust). |
| Page: 1 2 3 4 5 6 7 8 9 |
| GO ID | Tissue | Disease Stage | Description | Gene Ratio | Bg Ratio | pvalue | p.adjust | Count |
| GO:007265921 | Liver | HCC | protein localization to plasma membrane | 177/7958 | 284/18723 | 1.02e-11 | 4.18e-10 | 177 |
| GO:199077821 | Liver | HCC | protein localization to cell periphery | 200/7958 | 333/18723 | 6.07e-11 | 2.23e-09 | 200 |
| GO:005160412 | Liver | HCC | protein maturation | 171/7958 | 294/18723 | 3.80e-08 | 8.30e-07 | 171 |
| GO:00469311 | Liver | HCC | pore complex assembly | 17/7958 | 20/18723 | 1.18e-04 | 9.87e-04 | 17 |
| Page: 1 |
| Pathway ID | Tissue | Disease Stage | Description | Gene Ratio | Bg Ratio | pvalue | p.adjust | qvalue | Count |
| Page: 1 |
Top |
Cell-cell communication analysis |
| Identification of potential cell-cell interactions between two cell types and their ligand-receptor pairs for different disease states |
| Ligand | Receptor | LRpair | Pathway | Tissue | Disease Stage |
| Page: 1 |
Top |
Single-cell gene regulatory network inference analysis |
| Find out the significant the regulons (TFs) and the target genes of each regulon across cell types for different disease states |
| TF | Cell Type | Tissue | Disease Stage | Target Gene | RSS | Regulon Activity |
| ∗The dot plots of a searched regulon are shown for all cell subpopulations in each disease state of each tissue based on the regulon specific score inferred using pySCENIC and by calculating the average expression. |
| Page: 1 |
Top |
Somatic mutation of malignant transformation related genes |
| Annotation of somatic variants for genes involved in malignant transformation |
| Hugo Symbol | Variant Class | Variant Classification | dbSNP RS | HGVSc | HGVSp | HGVSp Short | SWISSPROT | BIOTYPE | SIFT | PolyPhen | Tumor Sample Barcode | Tissue | Histology | Sex | Age | Stage | Therapy Types | Drugs | Outcome |
| TSPAN33 | SNV | Missense_Mutation | rs768190545 | c.287C>T | p.Thr96Met | p.T96M | Q86UF1 | protein_coding | tolerated(0.29) | benign(0.072) | TCGA-A2-A0CQ-01 | Breast | breast invasive carcinoma | Female | <65 | I/II | Chemotherapy | adriamycin | SD |
| TSPAN33 | insertion | Nonsense_Mutation | novel | c.476_477insAGCACTGATACTGTAATTATTTCAGCCAATACTTTT | p.Gly159_Ile160insAlaLeuIleLeuTerLeuPheGlnProIleLeuLeu | p.G159_I160insALIL*LFQPILL | Q86UF1 | protein_coding | TCGA-A8-A07R-01 | Breast | breast invasive carcinoma | Female | >=65 | III/IV | Ancillary | zoledronic | SD | ||
| TSPAN33 | SNV | Missense_Mutation | c.730N>G | p.Leu244Val | p.L244V | Q86UF1 | protein_coding | tolerated(0.08) | benign(0.041) | TCGA-JW-A5VL-01 | Cervix | cervical & endocervical cancer | Female | <65 | I/II | Unknown | Unknown | SD | |
| TSPAN33 | SNV | Missense_Mutation | c.804C>G | p.Ile268Met | p.I268M | Q86UF1 | protein_coding | deleterious(0.03) | benign(0.006) | TCGA-AA-3492-01 | Colorectum | colon adenocarcinoma | Female | >=65 | I/II | Unknown | Unknown | SD | |
| TSPAN33 | SNV | Missense_Mutation | novel | c.839A>G | p.Asp280Gly | p.D280G | Q86UF1 | protein_coding | deleterious(0.03) | probably_damaging(0.984) | TCGA-AA-3984-01 | Colorectum | colon adenocarcinoma | Female | <65 | I/II | Unknown | Unknown | SD |
| TSPAN33 | SNV | Missense_Mutation | novel | c.628N>C | p.Phe210Leu | p.F210L | Q86UF1 | protein_coding | tolerated(1) | benign(0) | TCGA-AJ-A3EK-01 | Endometrium | uterine corpus endometrioid carcinoma | Female | <65 | I/II | Chemotherapy | carboplatin | CR |
| TSPAN33 | SNV | Missense_Mutation | rs768190545 | c.287N>T | p.Thr96Met | p.T96M | Q86UF1 | protein_coding | tolerated(0.29) | benign(0.072) | TCGA-AX-A1C5-01 | Endometrium | uterine corpus endometrioid carcinoma | Female | <65 | III/IV | Unspecific | Carboplatin | SD |
| TSPAN33 | SNV | Missense_Mutation | rs139146581 | c.413N>A | p.Arg138Gln | p.R138Q | Q86UF1 | protein_coding | deleterious(0) | probably_damaging(0.994) | TCGA-B5-A3FA-01 | Endometrium | uterine corpus endometrioid carcinoma | Female | >=65 | I/II | Unknown | Unknown | SD |
| TSPAN33 | SNV | Missense_Mutation | c.727N>A | p.Ala243Thr | p.A243T | Q86UF1 | protein_coding | tolerated(0.23) | possibly_damaging(0.733) | TCGA-D1-A103-01 | Endometrium | uterine corpus endometrioid carcinoma | Female | >=65 | I/II | Unknown | Unknown | SD | |
| TSPAN33 | SNV | Missense_Mutation | novel | c.45N>A | p.Phe15Leu | p.F15L | Q86UF1 | protein_coding | deleterious(0.04) | benign(0.041) | TCGA-E6-A1LX-01 | Endometrium | uterine corpus endometrioid carcinoma | Female | <65 | I/II | Unknown | Unknown | SD |
| Page: 1 2 |
Top |
Related drugs of malignant transformation related genes |
| Identification of chemicals and drugs interact with genes involved in malignant transfromation |
| (DGIdb 4.0) |
| Entrez ID | Symbol | Category | Interaction Types | Drug Claim Name | Drug Name | PMIDs |
| Page: 1 |

Copyright 2023-Present -The University of Texas Health Science Center at Houston |