
|
|||||
|
 | |
| |
| |
| |
| |
| |
|
Gene: TSPAN3 |
Gene summary for TSPAN3 |
| Gene information | Species | Human | Gene symbol | TSPAN3 | Gene ID | 10099 |
| Gene name | tetraspanin 3 | |
| Gene Alias | TM4-A | |
| Cytomap | 15q24.3 | |
| Gene Type | protein-coding | GO ID | GO:0008150 | UniProtAcc | O60637 |
Top |
Malignant transformation analysis |
| Identification of the aberrant gene expression in precancerous and cancerous lesions by comparing the gene expression of stem-like cells in diseased tissues with normal stem cells |
| Entrez ID | Symbol | Replicates | Species | Organ | Tissue | Adj P-value | Log2FC | Malignancy |
| 10099 | TSPAN3 | HTA11_2487_2000001011 | Human | Colorectum | SER | 1.34e-09 | 9.77e-01 | -0.1808 |
| 10099 | TSPAN3 | HTA11_1938_2000001011 | Human | Colorectum | AD | 1.43e-04 | 6.40e-01 | -0.0811 |
| 10099 | TSPAN3 | HTA11_78_2000001011 | Human | Colorectum | AD | 3.48e-05 | 5.98e-01 | -0.1088 |
| 10099 | TSPAN3 | HTA11_347_2000001011 | Human | Colorectum | AD | 6.19e-20 | 8.81e-01 | -0.1954 |
| 10099 | TSPAN3 | HTA11_411_2000001011 | Human | Colorectum | SER | 4.84e-12 | 1.88e+00 | -0.2602 |
| 10099 | TSPAN3 | HTA11_2112_2000001011 | Human | Colorectum | SER | 2.30e-09 | 1.22e+00 | -0.2196 |
| 10099 | TSPAN3 | HTA11_2992_2000001011 | Human | Colorectum | SER | 1.64e-06 | 9.56e-01 | -0.1706 |
| 10099 | TSPAN3 | HTA11_5212_2000001011 | Human | Colorectum | AD | 7.75e-15 | 1.64e+00 | -0.2061 |
| 10099 | TSPAN3 | HTA11_7469_2000001011 | Human | Colorectum | AD | 3.69e-04 | 8.91e-01 | -0.0124 |
| 10099 | TSPAN3 | HTA11_99999965104_69814 | Human | Colorectum | MSS | 2.06e-03 | 5.78e-01 | 0.281 |
| 10099 | TSPAN3 | HTA11_99999974143_84620 | Human | Colorectum | MSS | 8.10e-04 | -2.45e-01 | 0.3005 |
| 10099 | TSPAN3 | F007 | Human | Colorectum | FAP | 1.32e-02 | -2.54e-01 | 0.1176 |
| 10099 | TSPAN3 | A002-C-010 | Human | Colorectum | FAP | 2.69e-08 | -3.14e-01 | 0.242 |
| 10099 | TSPAN3 | A001-C-207 | Human | Colorectum | FAP | 2.84e-03 | -2.06e-01 | 0.1278 |
| 10099 | TSPAN3 | A015-C-203 | Human | Colorectum | FAP | 5.16e-29 | -4.37e-01 | -0.1294 |
| 10099 | TSPAN3 | A015-C-204 | Human | Colorectum | FAP | 1.69e-03 | -1.90e-01 | -0.0228 |
| 10099 | TSPAN3 | A014-C-040 | Human | Colorectum | FAP | 2.47e-04 | -4.66e-01 | -0.1184 |
| 10099 | TSPAN3 | A002-C-201 | Human | Colorectum | FAP | 9.40e-11 | -3.04e-01 | 0.0324 |
| 10099 | TSPAN3 | A002-C-203 | Human | Colorectum | FAP | 1.12e-05 | -1.74e-01 | 0.2786 |
| 10099 | TSPAN3 | A001-C-119 | Human | Colorectum | FAP | 2.38e-13 | -5.57e-01 | -0.1557 |
| Page: 1 2 3 4 5 6 7 8 9 10 11 12 13 |
| Tissue | Expression Dynamics | Abbreviation |
| Colorectum (GSE201348) |  | FAP: Familial adenomatous polyposis |
| CRC: Colorectal cancer | ||
| Colorectum (HTA11) |  | AD: Adenomas |
| SER: Sessile serrated lesions | ||
| MSI-H: Microsatellite-high colorectal cancer | ||
| MSS: Microsatellite stable colorectal cancer | ||
| Endometrium |  | AEH: Atypical endometrial hyperplasia |
| EEC: Endometrioid Cancer | ||
| Esophagus |  | ESCC: Esophageal squamous cell carcinoma |
| HGIN: High-grade intraepithelial neoplasias | ||
| LGIN: Low-grade intraepithelial neoplasias | ||
| GC | 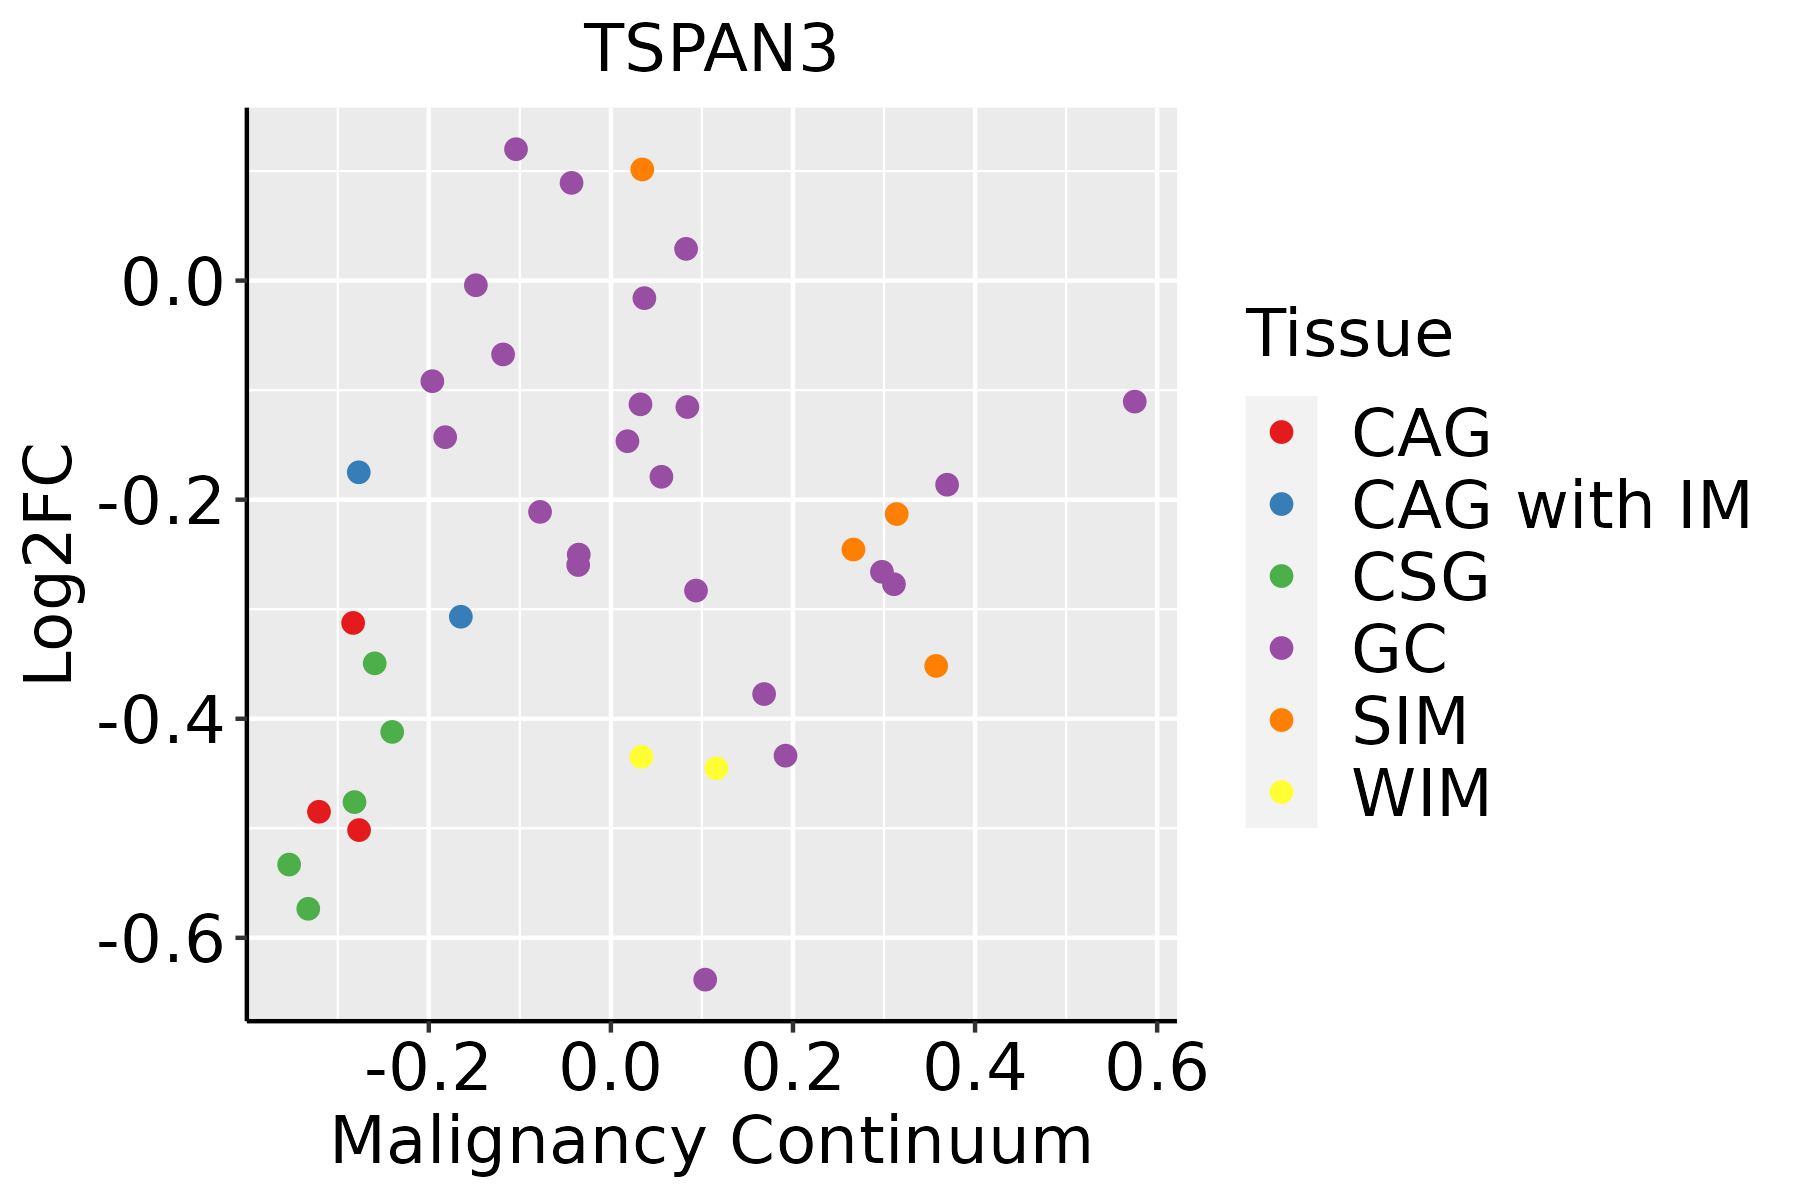 | CAG: Chronic atrophic gastritis |
| CAG with IM: Chronic atrophic gastritis with intestinal metaplasia | ||
| CSG: Chronic superficial gastritis | ||
| GC: Gastric cancer | ||
| SIM: Severe intestinal metaplasia | ||
| WIM: Wild intestinal metaplasia | ||
| Liver |  | HCC: Hepatocellular carcinoma |
| NAFLD: Non-alcoholic fatty liver disease | ||
| Lung | 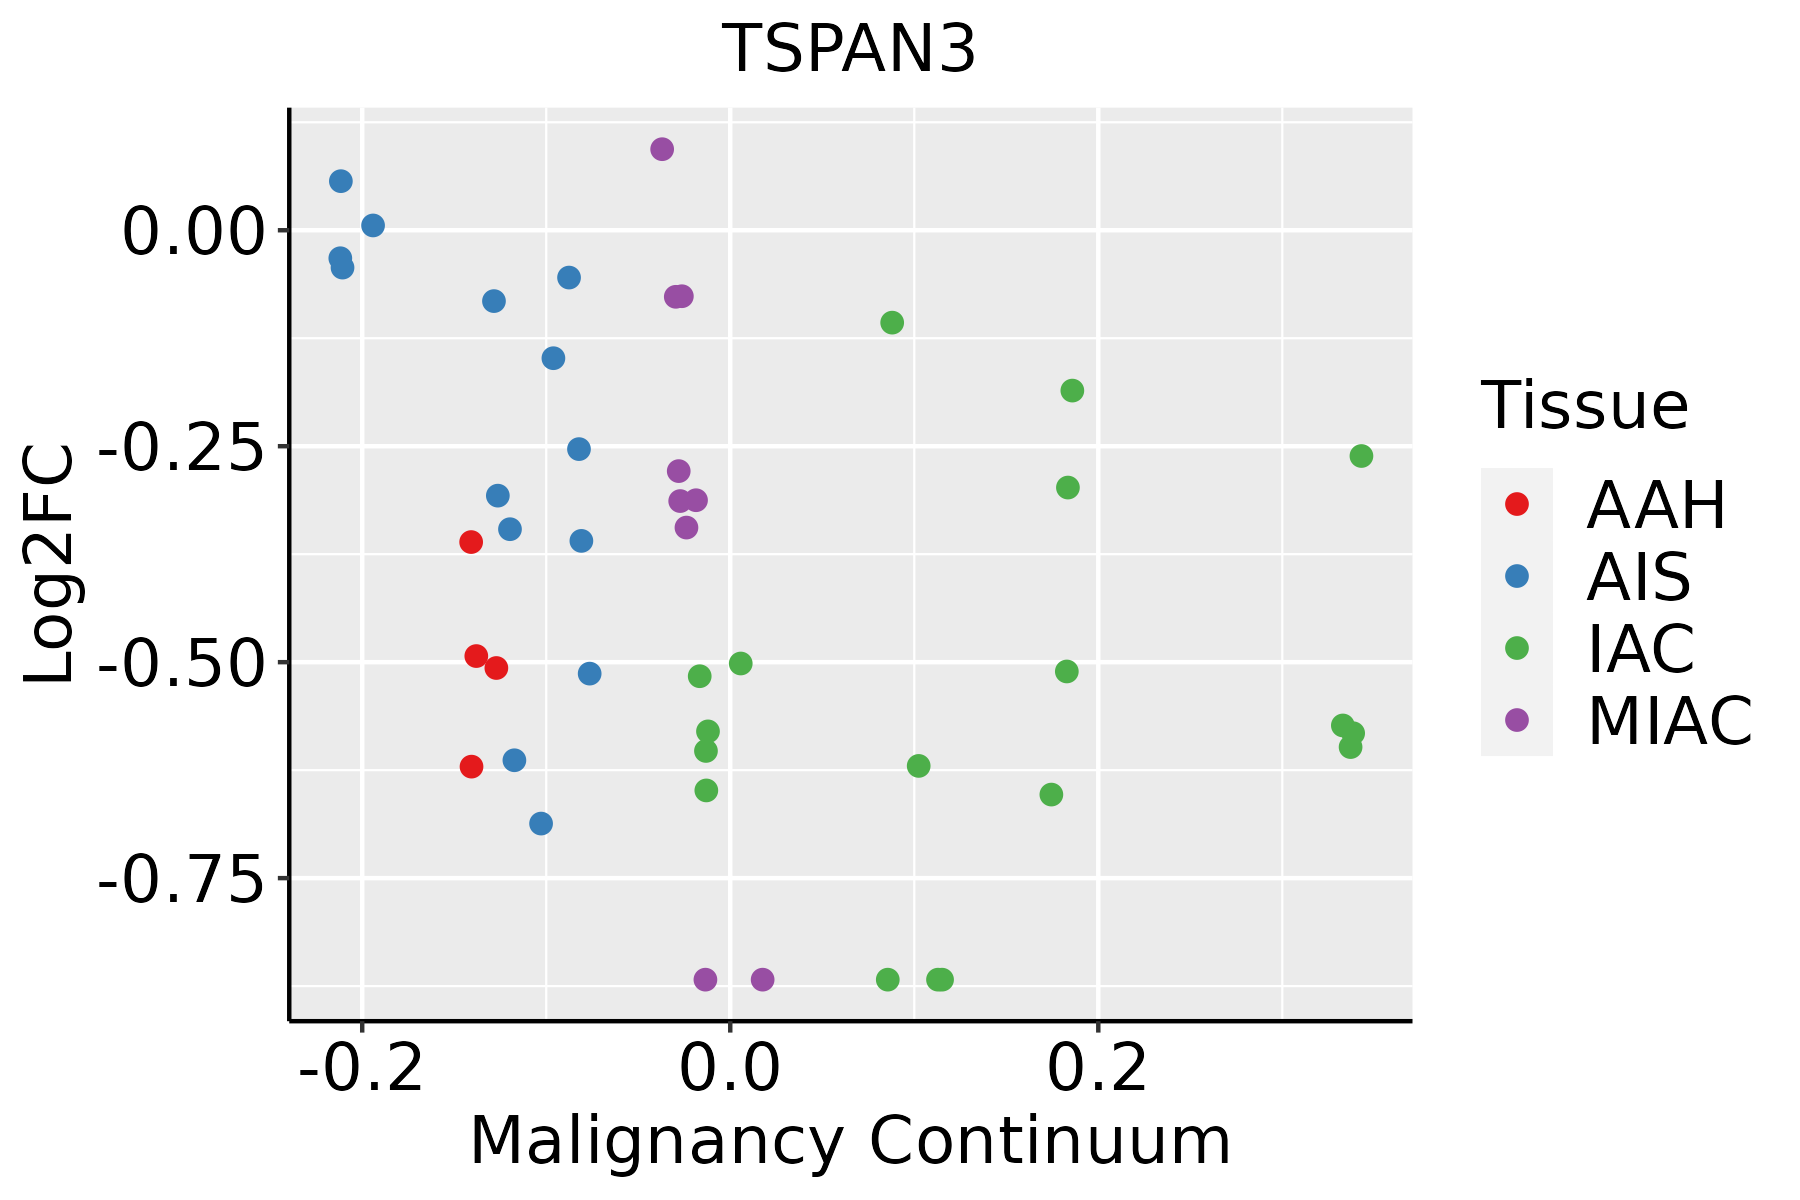 | AAH: Atypical adenomatous hyperplasia |
| AIS: Adenocarcinoma in situ | ||
| IAC: Invasive lung adenocarcinoma | ||
| MIA: Minimally invasive adenocarcinoma | ||
| Oral Cavity | 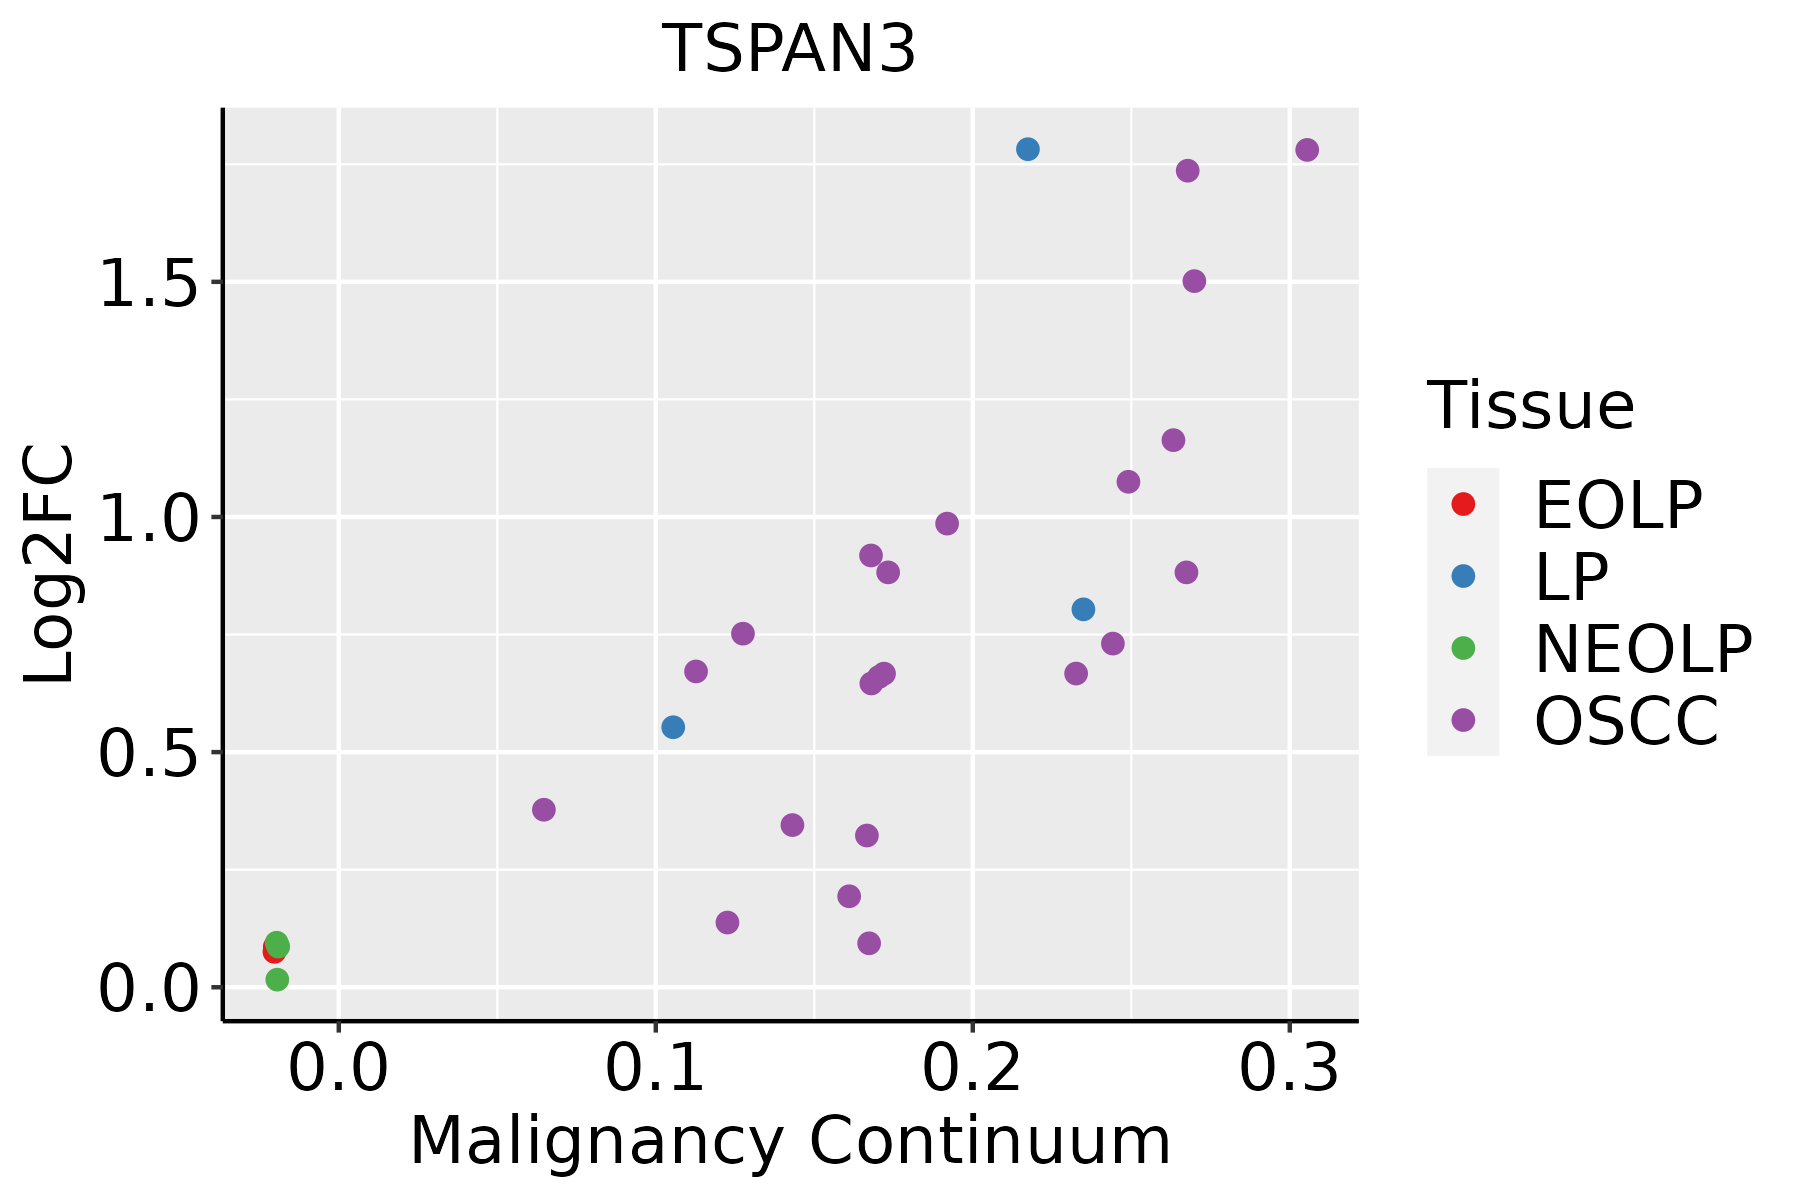 | EOLP: Erosive Oral lichen planus |
| LP: leukoplakia | ||
| NEOLP: Non-erosive oral lichen planus | ||
| OSCC: Oral squamous cell carcinoma | ||
| Prostate | 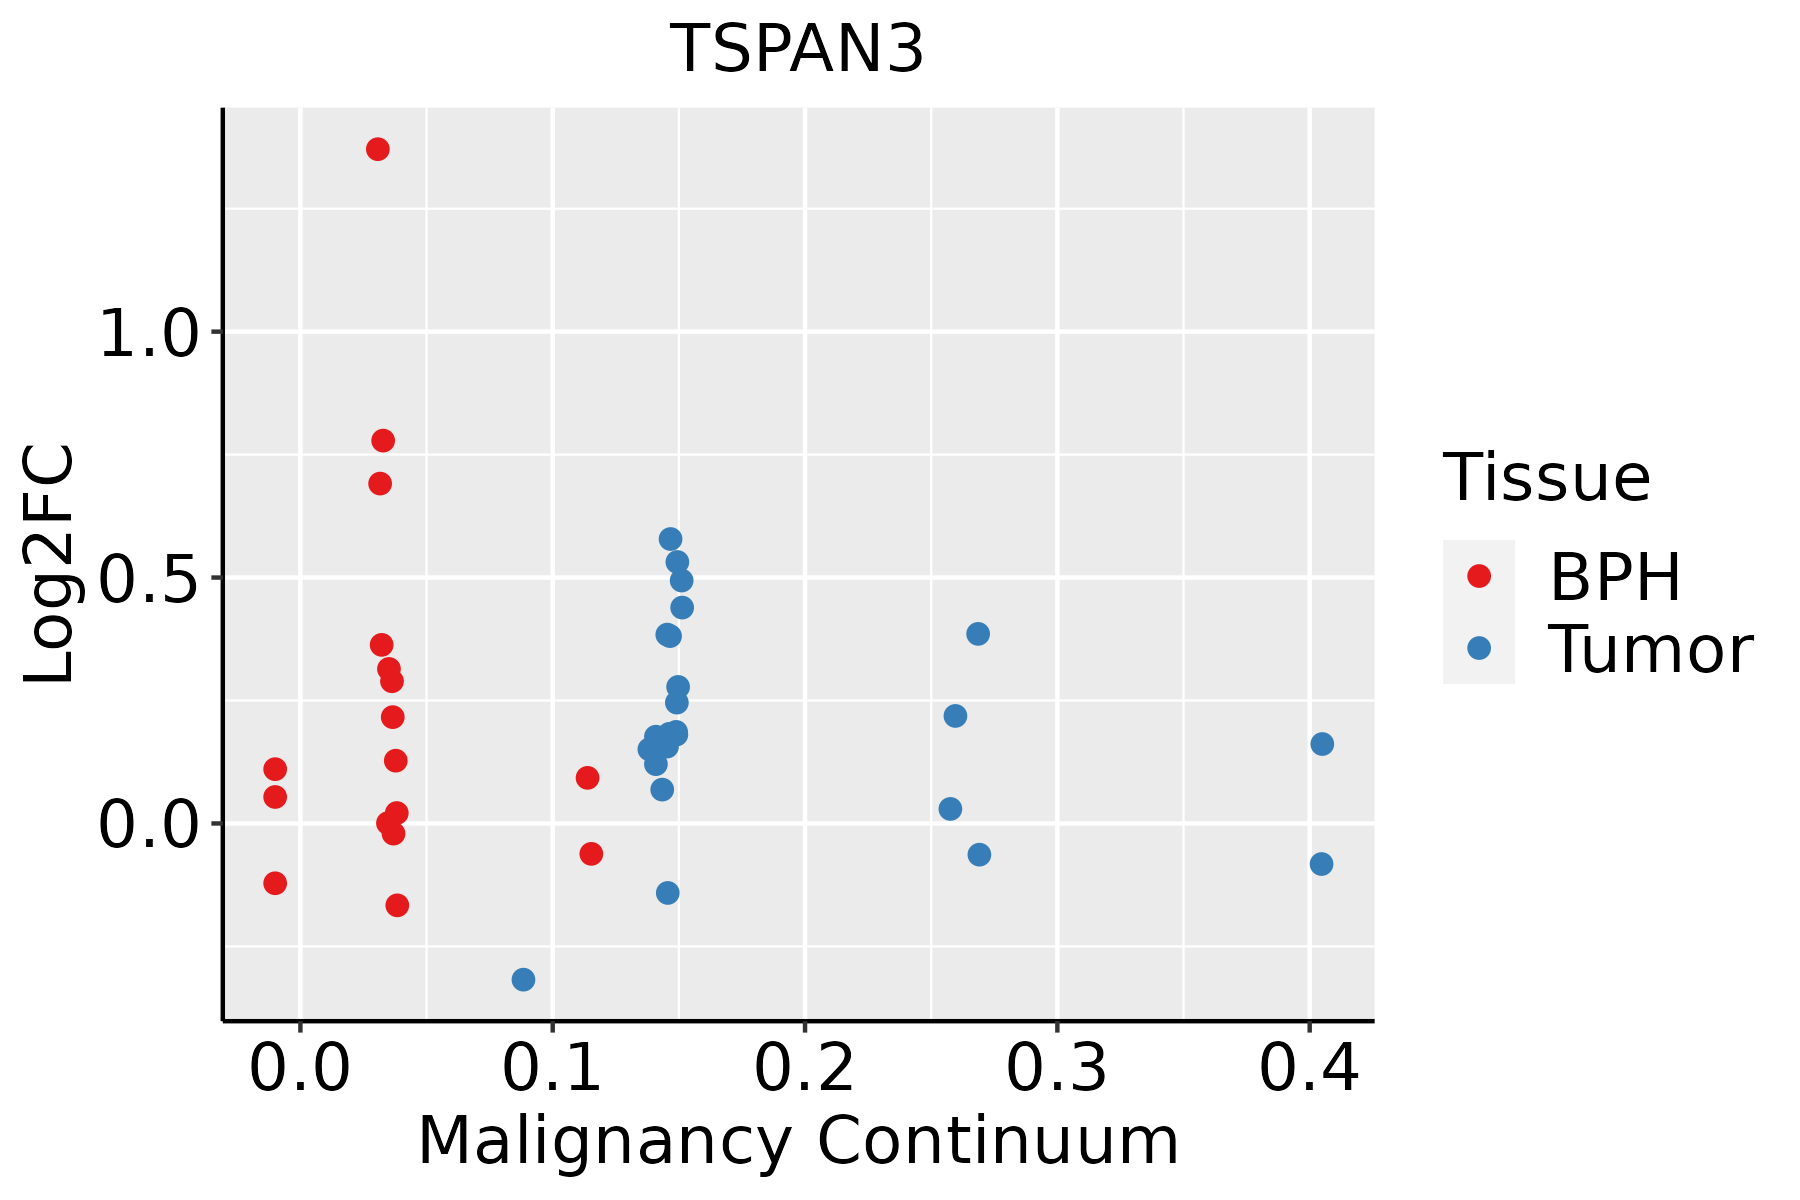 | BPH: Benign Prostatic Hyperplasia |
| Skin | 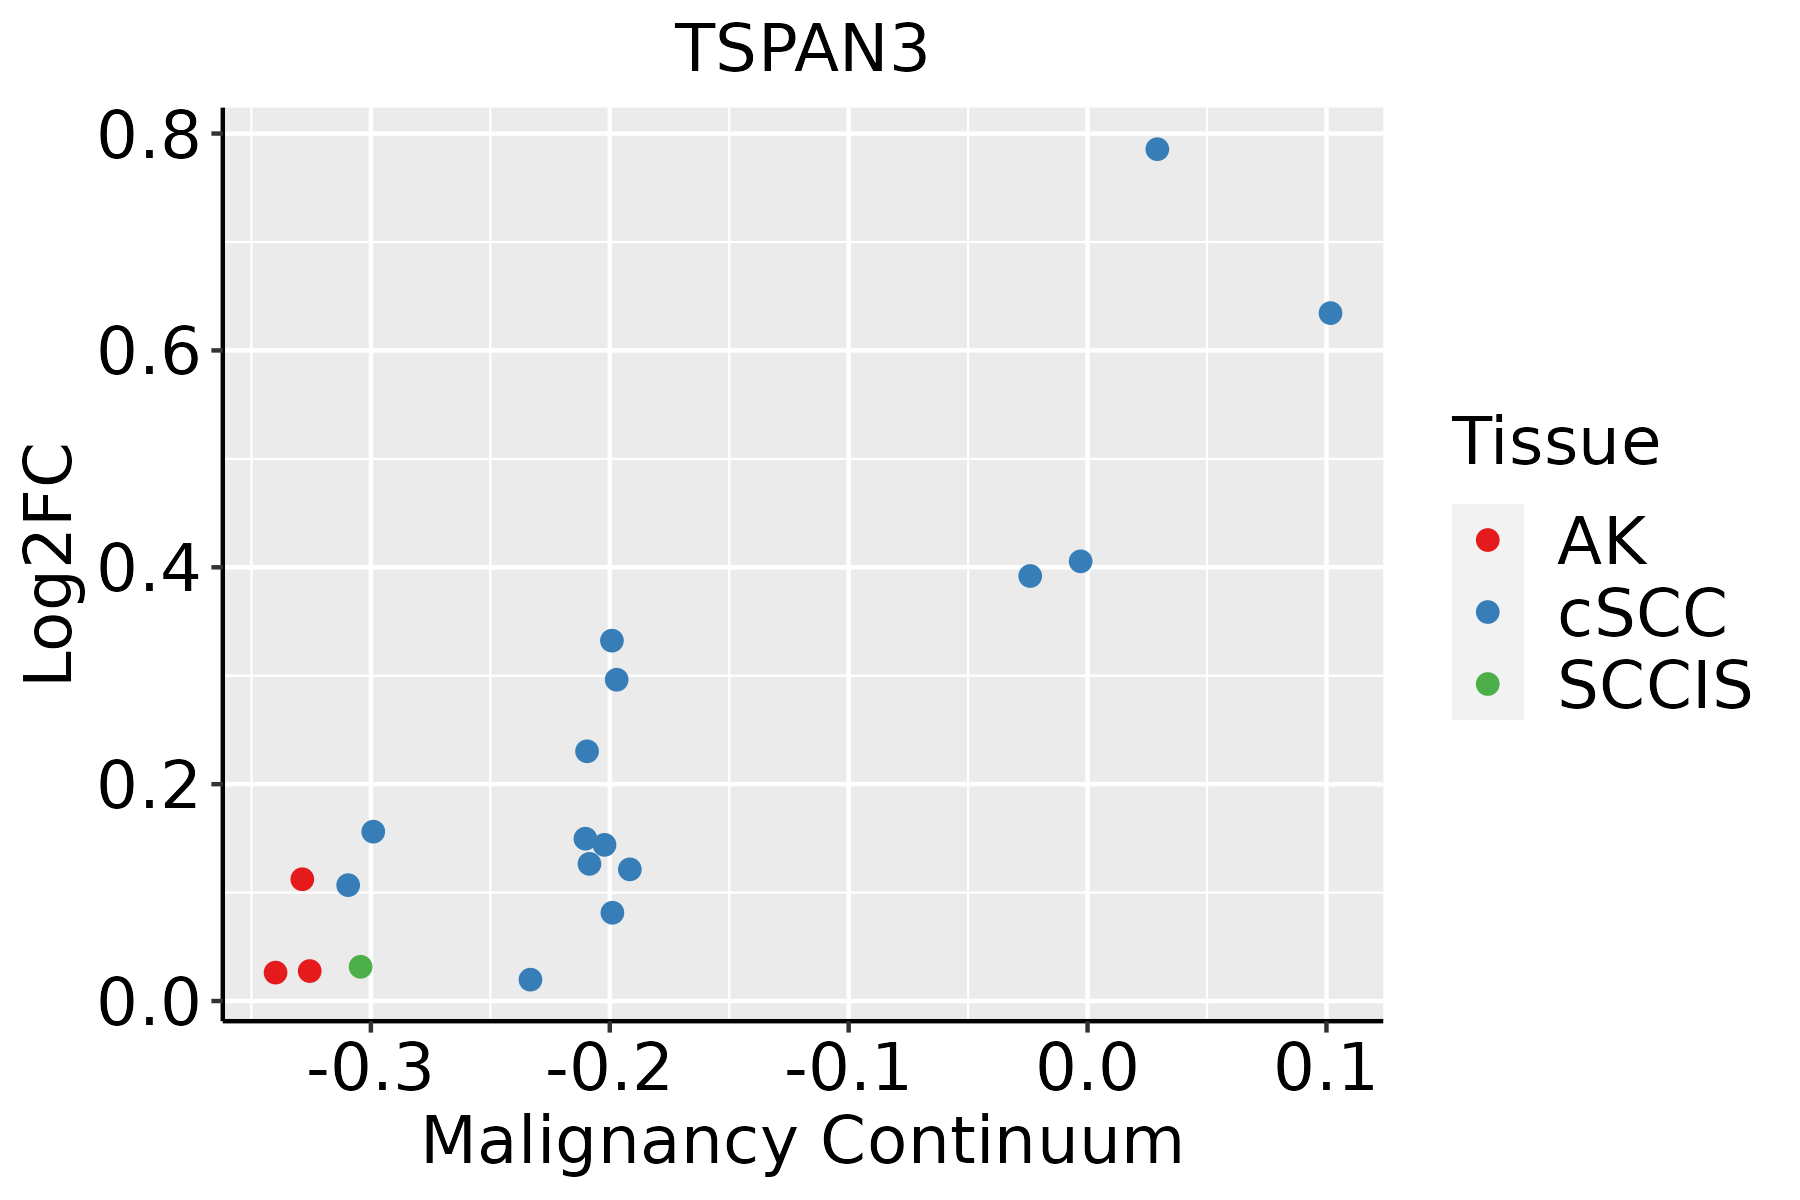 | AK: Actinic keratosis |
| cSCC: Cutaneous squamous cell carcinoma | ||
| SCCIS:squamous cell carcinoma in situ | ||
| Thyroid | 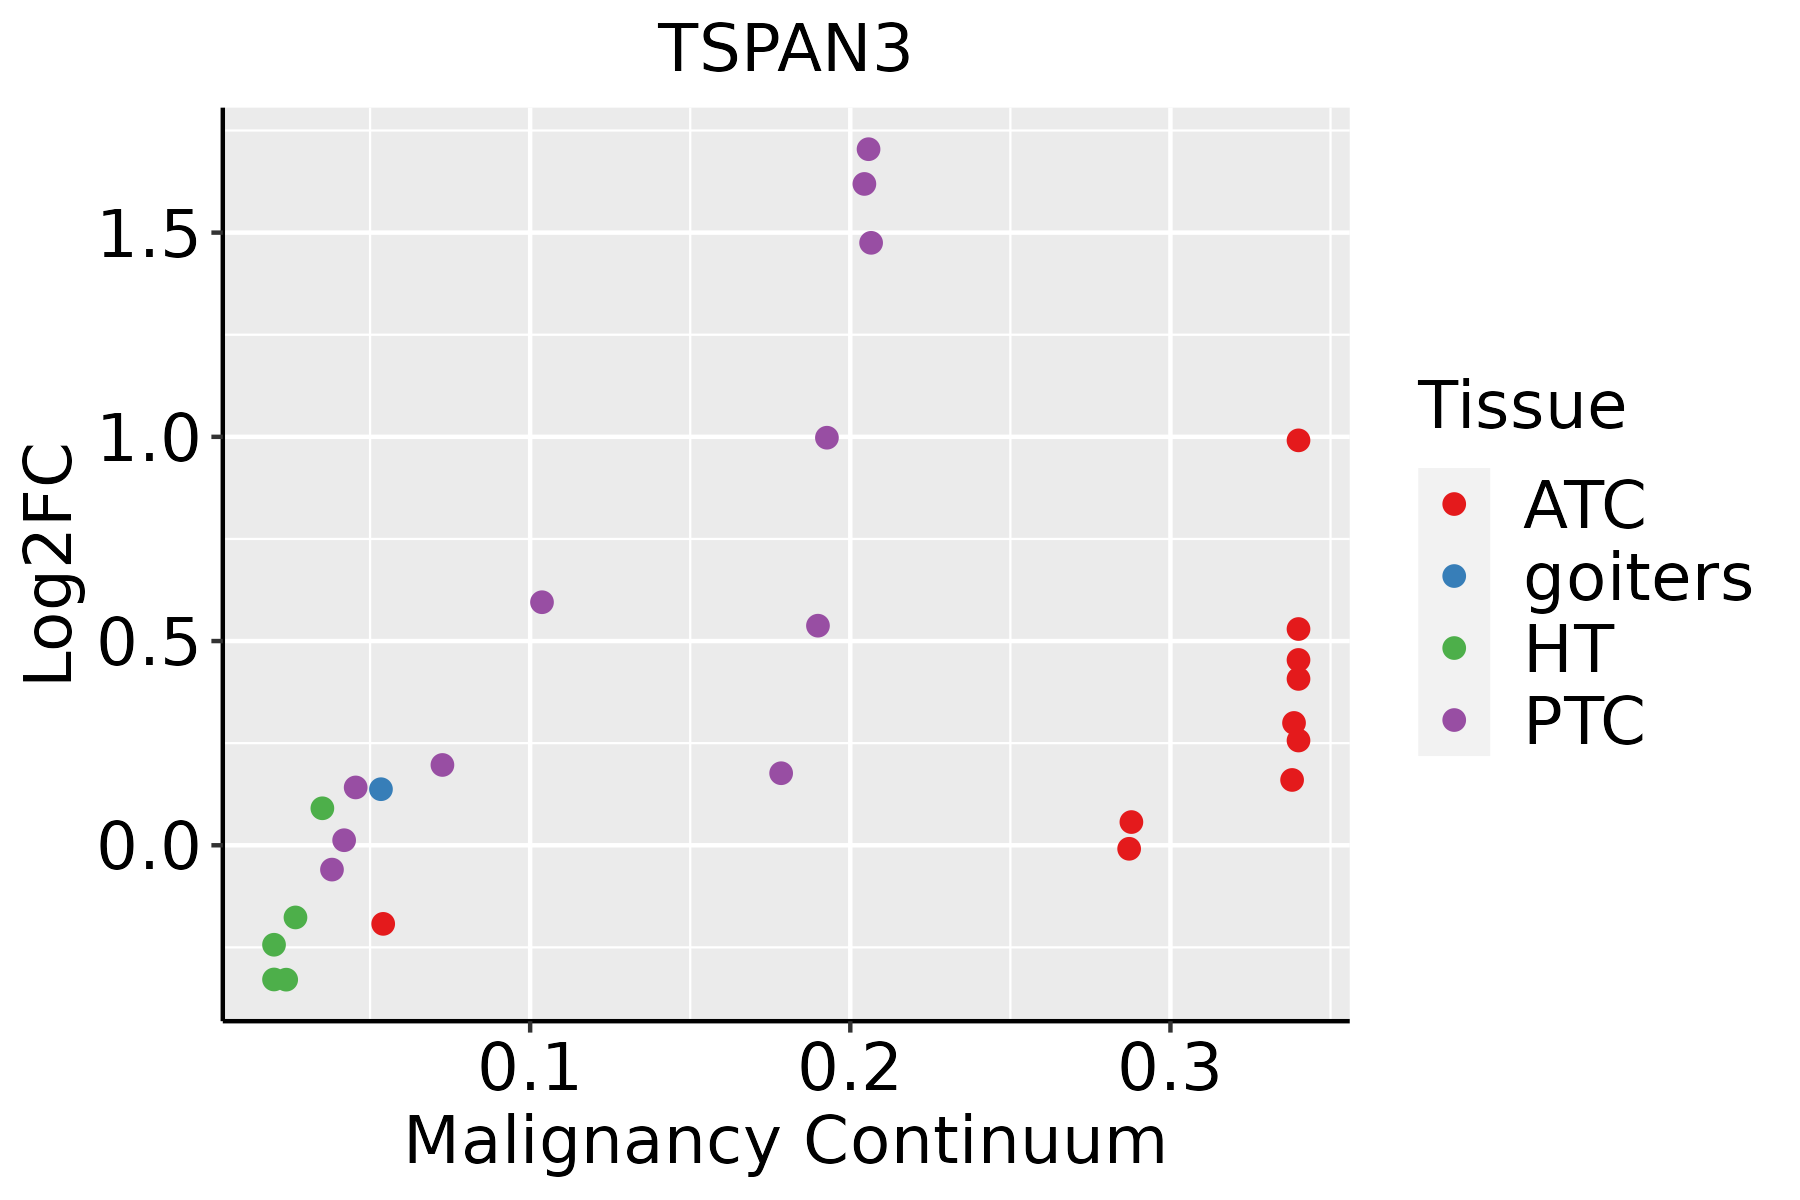 | ATC: Anaplastic thyroid cancer |
| HT: Hashimoto's thyroiditis | ||
| PTC: Papillary thyroid cancer |
| ∗log2FC in expression of this searched gene in stem-like cells from each diseased tissue sample relative to stem-like cells in normal samples in each tissue plotted against the malignancy continuum. Samples are colored based on if they are from different disease stage. |
Top |
Malignant transformation related pathway analysis |
| Find out the enriched GO biological processes and KEGG pathways involved in transition from healthy to precancer to cancer |
| Tissue | Disease Stage | Enriched GO biological Processes |
| Colorectum | AD |  |
| Colorectum | SER |  |
| Colorectum | MSS |  |
| Colorectum | MSI-H |  |
| Colorectum | FAP |  |
| ∗Top 15 enriched GO BP terms are showed in the bar plot of each disease state in each tissue. Each row represents a significant GO biological process which is colored according to the -log10(p.adjust). |
| Page: 1 2 3 4 5 6 7 8 9 |
| GO ID | Tissue | Disease Stage | Description | Gene Ratio | Bg Ratio | pvalue | p.adjust | Count |
| GO:007265921 | Liver | HCC | protein localization to plasma membrane | 177/7958 | 284/18723 | 1.02e-11 | 4.18e-10 | 177 |
| GO:199077821 | Liver | HCC | protein localization to cell periphery | 200/7958 | 333/18723 | 6.07e-11 | 2.23e-09 | 200 |
| GO:005160412 | Liver | HCC | protein maturation | 171/7958 | 294/18723 | 3.80e-08 | 8.30e-07 | 171 |
| GO:00469311 | Liver | HCC | pore complex assembly | 17/7958 | 20/18723 | 1.18e-04 | 9.87e-04 | 17 |
| Page: 1 |
| Pathway ID | Tissue | Disease Stage | Description | Gene Ratio | Bg Ratio | pvalue | p.adjust | qvalue | Count |
| Page: 1 |
Top |
Cell-cell communication analysis |
| Identification of potential cell-cell interactions between two cell types and their ligand-receptor pairs for different disease states |
| Ligand | Receptor | LRpair | Pathway | Tissue | Disease Stage |
| Page: 1 |
Top |
Single-cell gene regulatory network inference analysis |
| Find out the significant the regulons (TFs) and the target genes of each regulon across cell types for different disease states |
| TF | Cell Type | Tissue | Disease Stage | Target Gene | RSS | Regulon Activity |
| ∗The dot plots of a searched regulon are shown for all cell subpopulations in each disease state of each tissue based on the regulon specific score inferred using pySCENIC and by calculating the average expression. |
| Page: 1 |
Top |
Somatic mutation of malignant transformation related genes |
| Annotation of somatic variants for genes involved in malignant transformation |
| Hugo Symbol | Variant Class | Variant Classification | dbSNP RS | HGVSc | HGVSp | HGVSp Short | SWISSPROT | BIOTYPE | SIFT | PolyPhen | Tumor Sample Barcode | Tissue | Histology | Sex | Age | Stage | Therapy Types | Drugs | Outcome |
| TSPAN3 | SNV | Missense_Mutation | c.390N>A | p.Asn130Lys | p.N130K | O60637 | protein_coding | deleterious(0.03) | benign(0.142) | TCGA-E9-A1NF-01 | Breast | breast invasive carcinoma | Female | <65 | I/II | Chemotherapy | doxorubicin | PD | |
| TSPAN3 | SNV | Missense_Mutation | c.239G>A | p.Arg80His | p.R80H | O60637 | protein_coding | tolerated(0.1) | benign(0.12) | TCGA-AA-3852-01 | Colorectum | colon adenocarcinoma | Male | >=65 | I/II | Unknown | Unknown | PD | |
| TSPAN3 | SNV | Missense_Mutation | rs376931567 | c.238C>T | p.Arg80Cys | p.R80C | O60637 | protein_coding | tolerated(0.16) | benign(0.082) | TCGA-G4-6309-01 | Colorectum | colon adenocarcinoma | Female | <65 | III/IV | Chemotherapy | xeloda | PD |
| TSPAN3 | SNV | Missense_Mutation | rs749142832 | c.748N>A | p.Gly250Arg | p.G250R | O60637 | protein_coding | deleterious_low_confidence(0) | benign(0.312) | TCGA-EI-6507-01 | Colorectum | rectum adenocarcinoma | Male | <65 | I/II | Unknown | Unknown | SD |
| TSPAN3 | SNV | Missense_Mutation | novel | c.104T>G | p.Phe35Cys | p.F35C | O60637 | protein_coding | deleterious(0) | probably_damaging(0.976) | TCGA-AJ-A5DW-01 | Endometrium | uterine corpus endometrioid carcinoma | Female | <65 | I/II | Unknown | Unknown | SD |
| TSPAN3 | SNV | Missense_Mutation | novel | c.353N>A | p.Ser118Asn | p.S118N | O60637 | protein_coding | tolerated(0.09) | benign(0.015) | TCGA-AX-A06F-01 | Endometrium | uterine corpus endometrioid carcinoma | Female | <65 | III/IV | Chemotherapy | carboplatin | SD |
| TSPAN3 | SNV | Missense_Mutation | c.415G>T | p.Asp139Tyr | p.D139Y | O60637 | protein_coding | deleterious(0) | probably_damaging(1) | TCGA-AX-A0J0-01 | Endometrium | uterine corpus endometrioid carcinoma | Female | <65 | I/II | Unknown | Unknown | SD | |
| TSPAN3 | SNV | Missense_Mutation | rs375306231 | c.350N>A | p.Arg117His | p.R117H | O60637 | protein_coding | tolerated(0.57) | benign(0.005) | TCGA-AX-A2HD-01 | Endometrium | uterine corpus endometrioid carcinoma | Female | >=65 | III/IV | Unknown | Unknown | SD |
| TSPAN3 | SNV | Missense_Mutation | c.257T>C | p.Phe86Ser | p.F86S | O60637 | protein_coding | deleterious(0) | probably_damaging(0.999) | TCGA-EO-A22R-01 | Endometrium | uterine corpus endometrioid carcinoma | Female | <65 | I/II | Unknown | Unknown | SD | |
| TSPAN3 | SNV | Missense_Mutation | c.257N>A | p.Phe86Tyr | p.F86Y | O60637 | protein_coding | deleterious(0) | probably_damaging(0.968) | TCGA-55-1594-01 | Lung | lung adenocarcinoma | Male | >=65 | III/IV | Unknown | Unknown | SD |
| Page: 1 2 |
Top |
Related drugs of malignant transformation related genes |
| Identification of chemicals and drugs interact with genes involved in malignant transfromation |
| (DGIdb 4.0) |
| Entrez ID | Symbol | Category | Interaction Types | Drug Claim Name | Drug Name | PMIDs |
| Page: 1 |

Copyright 2023-Present -The University of Texas Health Science Center at Houston |