
|
|||||
|
 | |
| |
| |
| |
| |
| |
|
Gene: TSPAN2 |
Gene summary for TSPAN2 |
| Gene information | Species | Human | Gene symbol | TSPAN2 | Gene ID | 10100 |
| Gene name | tetraspanin 2 | |
| Gene Alias | NET3 | |
| Cytomap | 1p13.2 | |
| Gene Type | protein-coding | GO ID | GO:0002376 | UniProtAcc | B1AKP1 |
Top |
Malignant transformation analysis |
| Identification of the aberrant gene expression in precancerous and cancerous lesions by comparing the gene expression of stem-like cells in diseased tissues with normal stem cells |
| Entrez ID | Symbol | Replicates | Species | Organ | Tissue | Adj P-value | Log2FC | Malignancy |
| 10100 | TSPAN2 | P2T-E | Human | Esophagus | ESCC | 3.58e-28 | 3.90e-01 | 0.1177 |
| 10100 | TSPAN2 | P5T-E | Human | Esophagus | ESCC | 2.05e-07 | 1.92e-01 | 0.1327 |
| 10100 | TSPAN2 | P10T-E | Human | Esophagus | ESCC | 1.47e-14 | 2.94e-01 | 0.116 |
| 10100 | TSPAN2 | P11T-E | Human | Esophagus | ESCC | 2.46e-02 | 1.39e-01 | 0.1426 |
| 10100 | TSPAN2 | P16T-E | Human | Esophagus | ESCC | 8.40e-04 | 1.29e-01 | 0.1153 |
| 10100 | TSPAN2 | P19T-E | Human | Esophagus | ESCC | 7.48e-03 | 6.89e-01 | 0.1662 |
| 10100 | TSPAN2 | P21T-E | Human | Esophagus | ESCC | 2.28e-35 | 8.89e-01 | 0.1617 |
| 10100 | TSPAN2 | P31T-E | Human | Esophagus | ESCC | 1.78e-03 | 1.36e-01 | 0.1251 |
| 10100 | TSPAN2 | P32T-E | Human | Esophagus | ESCC | 9.20e-06 | 1.54e-01 | 0.1666 |
| 10100 | TSPAN2 | P37T-E | Human | Esophagus | ESCC | 4.27e-06 | 2.01e-01 | 0.1371 |
| 10100 | TSPAN2 | P56T-E | Human | Esophagus | ESCC | 5.84e-10 | 6.29e-01 | 0.1613 |
| 10100 | TSPAN2 | P57T-E | Human | Esophagus | ESCC | 1.78e-03 | 1.03e-01 | 0.0926 |
| 10100 | TSPAN2 | P61T-E | Human | Esophagus | ESCC | 4.84e-16 | 4.02e-01 | 0.099 |
| 10100 | TSPAN2 | P74T-E | Human | Esophagus | ESCC | 3.23e-09 | 2.96e-01 | 0.1479 |
| 10100 | TSPAN2 | P75T-E | Human | Esophagus | ESCC | 3.75e-03 | 1.57e-01 | 0.1125 |
| 10100 | TSPAN2 | P76T-E | Human | Esophagus | ESCC | 1.62e-13 | 3.49e-01 | 0.1207 |
| 10100 | TSPAN2 | P79T-E | Human | Esophagus | ESCC | 1.76e-12 | 2.71e-01 | 0.1154 |
| 10100 | TSPAN2 | P83T-E | Human | Esophagus | ESCC | 3.17e-02 | 1.08e-01 | 0.1738 |
| 10100 | TSPAN2 | P130T-E | Human | Esophagus | ESCC | 3.75e-03 | 1.10e-01 | 0.1676 |
| Page: 1 |
| Tissue | Expression Dynamics | Abbreviation |
| Esophagus | 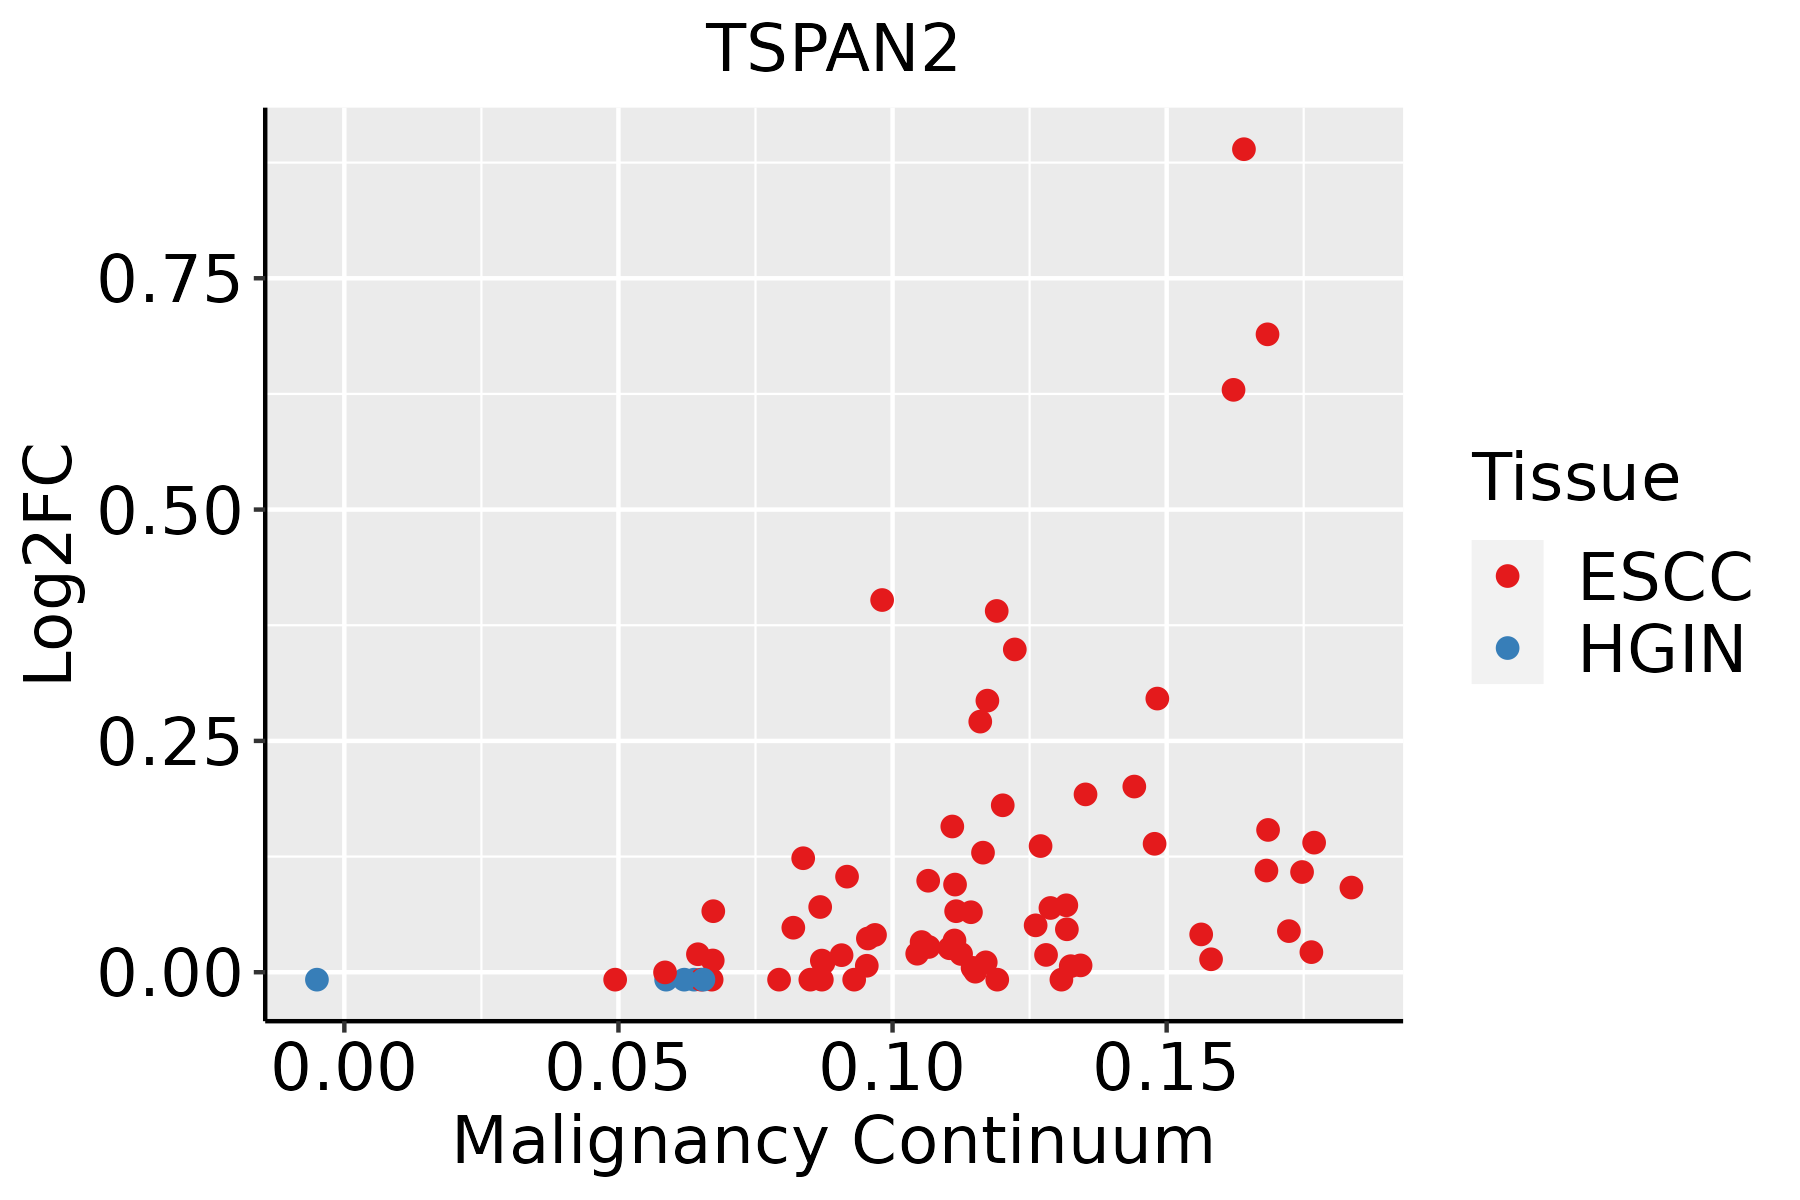 | ESCC: Esophageal squamous cell carcinoma |
| HGIN: High-grade intraepithelial neoplasias | ||
| LGIN: Low-grade intraepithelial neoplasias |
| ∗log2FC in expression of this searched gene in stem-like cells from each diseased tissue sample relative to stem-like cells in normal samples in each tissue plotted against the malignancy continuum. Samples are colored based on if they are from different disease stage. |
Top |
Malignant transformation related pathway analysis |
| Find out the enriched GO biological processes and KEGG pathways involved in transition from healthy to precancer to cancer |
| Tissue | Disease Stage | Enriched GO biological Processes |
| Colorectum | AD |  |
| Colorectum | SER |  |
| Colorectum | MSS |  |
| Colorectum | MSI-H |  |
| Colorectum | FAP |  |
| ∗Top 15 enriched GO BP terms are showed in the bar plot of each disease state in each tissue. Each row represents a significant GO biological process which is colored according to the -log10(p.adjust). |
| Page: 1 2 3 4 5 6 7 8 9 |
| GO ID | Tissue | Disease Stage | Description | Gene Ratio | Bg Ratio | pvalue | p.adjust | Count |
| GO:0030099111 | Esophagus | ESCC | myeloid cell differentiation | 232/8552 | 381/18723 | 1.22e-09 | 2.90e-08 | 232 |
| GO:000257317 | Esophagus | ESCC | myeloid leukocyte differentiation | 128/8552 | 208/18723 | 2.75e-06 | 3.15e-05 | 128 |
| GO:00425524 | Esophagus | ESCC | myelination | 85/8552 | 134/18723 | 2.51e-05 | 2.13e-04 | 85 |
| GO:00072724 | Esophagus | ESCC | ensheathment of neurons | 86/8552 | 136/18723 | 2.68e-05 | 2.24e-04 | 86 |
| GO:00083664 | Esophagus | ESCC | axon ensheathment | 86/8552 | 136/18723 | 2.68e-05 | 2.24e-04 | 86 |
| GO:00420636 | Esophagus | ESCC | gliogenesis | 172/8552 | 301/18723 | 3.75e-05 | 3.04e-04 | 172 |
| GO:006156415 | Esophagus | ESCC | axon development | 251/8552 | 467/18723 | 2.41e-04 | 1.49e-03 | 251 |
| GO:00100016 | Esophagus | ESCC | glial cell differentiation | 129/8552 | 225/18723 | 2.73e-04 | 1.65e-03 | 129 |
| GO:00487092 | Esophagus | ESCC | oligodendrocyte differentiation | 55/8552 | 95/18723 | 1.10e-02 | 3.72e-02 | 55 |
| Page: 1 |
| Pathway ID | Tissue | Disease Stage | Description | Gene Ratio | Bg Ratio | pvalue | p.adjust | qvalue | Count |
| Page: 1 |
Top |
Cell-cell communication analysis |
| Identification of potential cell-cell interactions between two cell types and their ligand-receptor pairs for different disease states |
| Ligand | Receptor | LRpair | Pathway | Tissue | Disease Stage |
| Page: 1 |
Top |
Single-cell gene regulatory network inference analysis |
| Find out the significant the regulons (TFs) and the target genes of each regulon across cell types for different disease states |
| TF | Cell Type | Tissue | Disease Stage | Target Gene | RSS | Regulon Activity |
| ∗The dot plots of a searched regulon are shown for all cell subpopulations in each disease state of each tissue based on the regulon specific score inferred using pySCENIC and by calculating the average expression. |
| Page: 1 |
Top |
Somatic mutation of malignant transformation related genes |
| Annotation of somatic variants for genes involved in malignant transformation |
| Hugo Symbol | Variant Class | Variant Classification | dbSNP RS | HGVSc | HGVSp | HGVSp Short | SWISSPROT | BIOTYPE | SIFT | PolyPhen | Tumor Sample Barcode | Tissue | Histology | Sex | Age | Stage | Therapy Types | Drugs | Outcome |
| TSPAN2 | SNV | Missense_Mutation | novel | c.470N>T | p.Ser157Phe | p.S157F | O60636 | protein_coding | tolerated(0.33) | possibly_damaging(0.526) | TCGA-A7-A6VY-01 | Breast | breast invasive carcinoma | Female | <65 | I/II | Chemotherapy | cyclophosphamide | CR |
| TSPAN2 | SNV | Missense_Mutation | c.14N>A | p.Arg5His | p.R5H | O60636 | protein_coding | deleterious(0.01) | benign(0.107) | TCGA-B6-A0IB-01 | Breast | breast invasive carcinoma | Female | <65 | III/IV | Unknown | Unknown | PD | |
| TSPAN2 | insertion | Nonsense_Mutation | novel | c.312_313insTAGAAGGGAAAGATGTCTATCACACAGAGTTCA | p.Thr104_Thr105insTer | p.T104_T105ins* | O60636 | protein_coding | TCGA-A8-A07J-01 | Breast | breast invasive carcinoma | Female | <65 | I/II | Chemotherapy | 5-fluorouracil | CR | ||
| TSPAN2 | SNV | Missense_Mutation | c.440N>T | p.Ser147Leu | p.S147L | O60636 | protein_coding | tolerated(0.55) | benign(0.019) | TCGA-C5-A1BQ-01 | Cervix | cervical & endocervical cancer | Female | >=65 | III/IV | Chemotherapy | cisplatin | CR | |
| TSPAN2 | SNV | Missense_Mutation | c.365N>G | p.Thr122Ser | p.T122S | O60636 | protein_coding | tolerated(0.69) | benign(0) | TCGA-AA-3713-01 | Colorectum | colon adenocarcinoma | Male | >=65 | III/IV | Chemotherapy | 5-fluorouracil | PR | |
| TSPAN2 | SNV | Missense_Mutation | c.251N>T | p.Ser84Leu | p.S84L | O60636 | protein_coding | deleterious(0) | probably_damaging(1) | TCGA-AA-3811-01 | Colorectum | colon adenocarcinoma | Female | >=65 | III/IV | Unknown | Unknown | PD | |
| TSPAN2 | SNV | Missense_Mutation | rs777331815 | c.599C>T | p.Thr200Met | p.T200M | O60636 | protein_coding | tolerated(1) | benign(0.371) | TCGA-D5-6931-01 | Colorectum | colon adenocarcinoma | Male | >=65 | III/IV | Unknown | Unknown | SD |
| TSPAN2 | SNV | Missense_Mutation | rs777331815 | c.599C>T | p.Thr200Met | p.T200M | O60636 | protein_coding | tolerated(1) | benign(0.371) | TCGA-G4-6627-01 | Colorectum | colon adenocarcinoma | Male | >=65 | I/II | Unknown | Unknown | PD |
| TSPAN2 | SNV | Missense_Mutation | c.644N>T | p.Arg215Leu | p.R215L | O60636 | protein_coding | deleterious(0.03) | probably_damaging(0.91) | TCGA-NH-A50U-01 | Colorectum | colon adenocarcinoma | Male | <65 | I/II | Ancillary | leucovorin | PD | |
| TSPAN2 | SNV | Missense_Mutation | rs777153817 | c.644G>A | p.Arg215Gln | p.R215Q | O60636 | protein_coding | deleterious(0) | possibly_damaging(0.809) | TCGA-F5-6814-01 | Colorectum | rectum adenocarcinoma | Male | <65 | I/II | Unknown | Unknown | SD |
| Page: 1 2 3 |
Top |
Related drugs of malignant transformation related genes |
| Identification of chemicals and drugs interact with genes involved in malignant transfromation |
| (DGIdb 4.0) |
| Entrez ID | Symbol | Category | Interaction Types | Drug Claim Name | Drug Name | PMIDs |
| Page: 1 |

Copyright 2023-Present -The University of Texas Health Science Center at Houston |