Schematic overview of the cellular and molecular mechanisms involved in the cancer progression, including the proposed cellular and molecular mechanisms in cancer cells trajectory. AT1: alveolar type 1 cells; AT2: alveolar type 2 cells; AAH: atypical adenomatous hyperplasia; AIS: adenocarcinoma in situ; MIA: minimally invasive adenocarcinoma; IA: invasive adenocarcinoma; EMT: epithelial-mesenchymal transition

Home

Download

Statistics

Help

Contact

Center for Computational Systems Medicine
leaf

Gene summary

leaf

Malignant transformation analysis

leaf

Malignant transformation related pathway analysis

leaf

Cell-cell communication analysis

leaf

Single-cell gene regulatory network inference analysis

leaf

Somatic mutation of malignant transformation related genes

leaf

Related drugs of malignant transformation related genes

Gene: TSPAN15

Gene summary for TSPAN15

check button Gene summary.

Gene informationSpeciesHuman
Gene symbol

TSPAN15

Gene ID

23555

Gene nametetraspanin 15
Gene Alias2700063A19Rik
Cytomap10q22.1
Gene Typeprotein-coding
GO ID

GO:0006807

UniProtAcc

O95858


Top

Malignant transformation analysis

check button Identification of the aberrant gene expression in precancerous and cancerous lesions by comparing the gene expression of stem-like cells in diseased tissues with normal stem cells
check button Malignant transformation involving gene list.
Entrez IDSymbolReplicatesSpeciesOrganTissueAdj P-valueLog2FCMalignancy
23555TSPAN15HTA11_1938_2000001011HumanColorectumAD6.12e-086.27e-01-0.0811
23555TSPAN15HTA11_78_2000001011HumanColorectumAD4.18e-044.16e-01-0.1088
23555TSPAN15HTA11_347_2000001011HumanColorectumAD1.50e-105.15e-01-0.1954
23555TSPAN15HTA11_83_2000001011HumanColorectumSER1.26e-055.96e-01-0.1526
23555TSPAN15HTA11_696_2000001011HumanColorectumAD6.90e-033.89e-01-0.1464
23555TSPAN15HTA11_866_2000001011HumanColorectumAD1.44e-024.41e-01-0.1001
23555TSPAN15HTA11_1391_2000001011HumanColorectumAD3.91e-096.13e-01-0.059
23555TSPAN15HTA11_10711_2000001011HumanColorectumAD1.97e-034.00e-010.0338
23555TSPAN15HTA11_7696_3000711011HumanColorectumAD4.61e-023.51e-010.0674
23555TSPAN15A015-C-203HumanColorectumFAP1.26e-11-2.20e-01-0.1294
23555TSPAN15A001-C-119HumanColorectumFAP6.93e-03-2.52e-01-0.1557
23555TSPAN15A001-C-108HumanColorectumFAP2.71e-05-1.99e-01-0.0272
23555TSPAN15A002-C-205HumanColorectumFAP3.74e-06-2.18e-01-0.1236
23555TSPAN15A015-C-006HumanColorectumFAP5.46e-05-2.72e-01-0.0994
23555TSPAN15A015-C-106HumanColorectumFAP1.45e-04-1.75e-01-0.0511
23555TSPAN15A002-C-114HumanColorectumFAP5.24e-05-2.41e-01-0.1561
23555TSPAN15A015-C-104HumanColorectumFAP7.07e-13-2.56e-01-0.1899
23555TSPAN15A001-C-014HumanColorectumFAP9.32e-06-1.61e-010.0135
23555TSPAN15A002-C-016HumanColorectumFAP1.21e-08-1.74e-010.0521
23555TSPAN15A015-C-002HumanColorectumFAP2.45e-02-2.43e-01-0.0763
Page: 1 2 3 4 5 6 7 

check button Transcriptomic changes along malignancy continuum.
TissueExpression DynamicsAbbreviation
Colorectum (GSE201348)The image shows the transcriptomic changes along malignancy continuum.log2FC in expression of this searched gene in stem-like cells from each diseased tissue sample relative to stem-like cells in normal samples in each tissue plotted against the malignancy continuum. Samples are colored based on if they are from different disease stage.FAP: Familial adenomatous polyposis
CRC: Colorectal cancer
Colorectum (HTA11)The image shows the transcriptomic changes along malignancy continuum.log2FC in expression of this searched gene in stem-like cells from each diseased tissue sample relative to stem-like cells in normal samples in each tissue plotted against the malignancy continuum. Samples are colored based on if they are from different disease stage.AD: Adenomas
SER: Sessile serrated lesions
MSI-H: Microsatellite-high colorectal cancer
MSS: Microsatellite stable colorectal cancer
EsophagusThe image shows the transcriptomic changes along malignancy continuum.log2FC in expression of this searched gene in stem-like cells from each diseased tissue sample relative to stem-like cells in normal samples in each tissue plotted against the malignancy continuum. Samples are colored based on if they are from different disease stage.
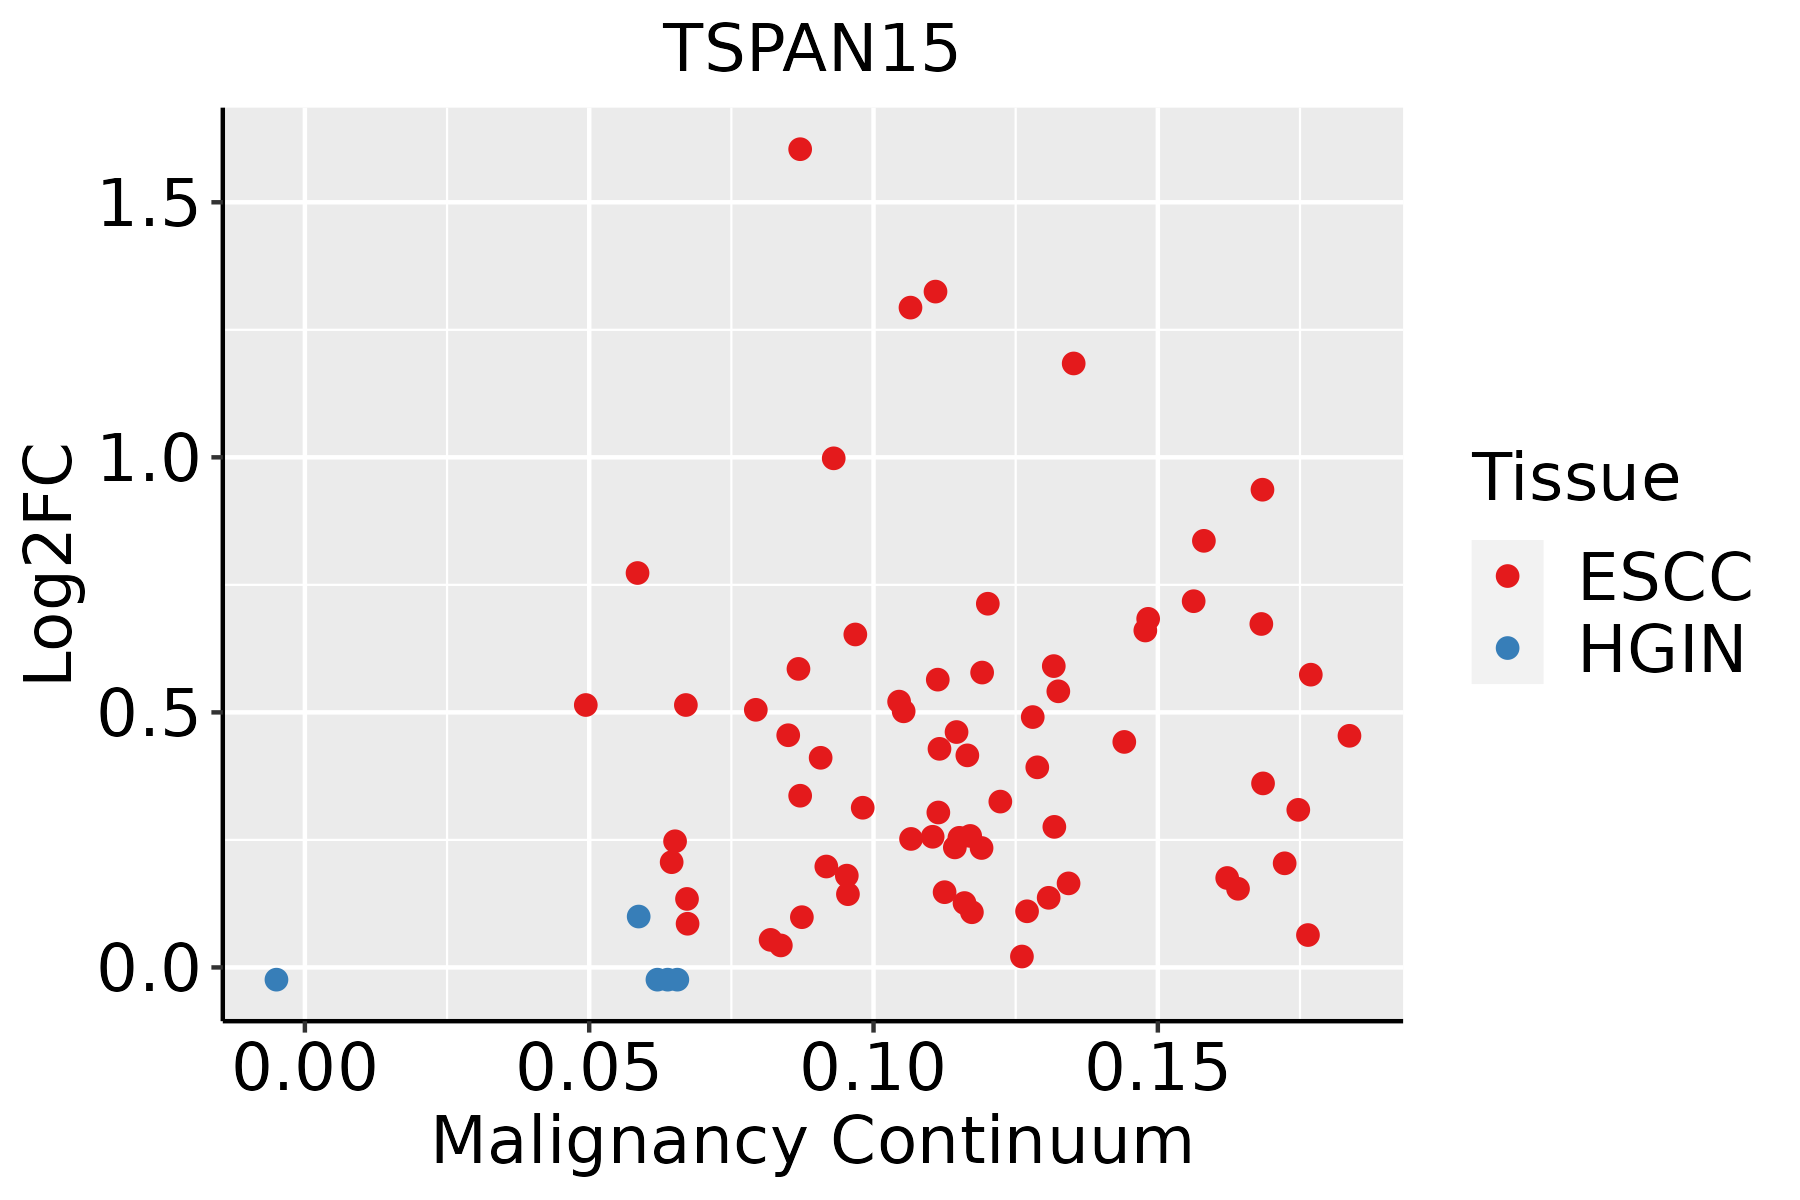
ESCC: Esophageal squamous cell carcinoma
HGIN: High-grade intraepithelial neoplasias
LGIN: Low-grade intraepithelial neoplasias
GCThe image shows the transcriptomic changes along malignancy continuum.log2FC in expression of this searched gene in stem-like cells from each diseased tissue sample relative to stem-like cells in normal samples in each tissue plotted against the malignancy continuum. Samples are colored based on if they are from different disease stage.
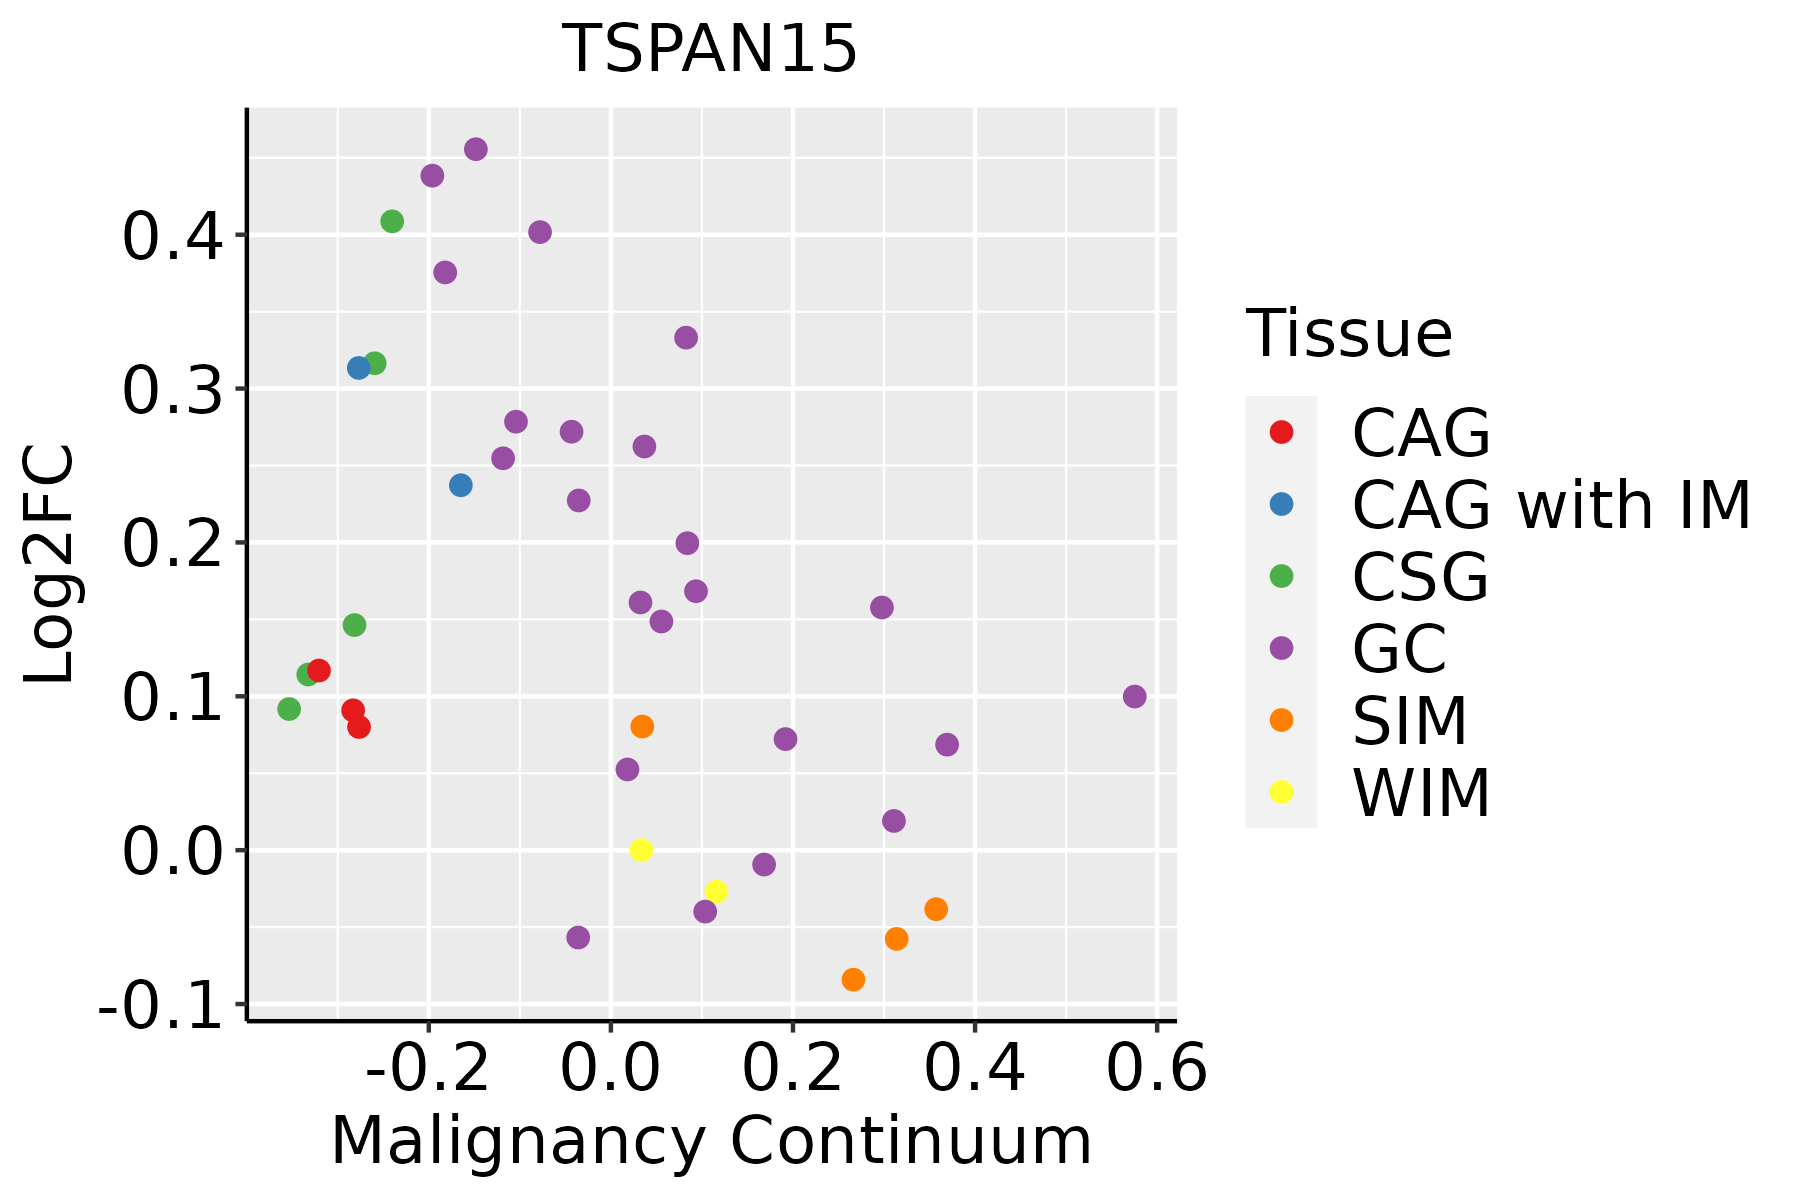
CAG: Chronic atrophic gastritis
CAG with IM: Chronic atrophic gastritis with intestinal metaplasia
CSG: Chronic superficial gastritis
GC: Gastric cancer
SIM: Severe intestinal metaplasia
WIM: Wild intestinal metaplasia
LiverThe image shows the transcriptomic changes along malignancy continuum.log2FC in expression of this searched gene in stem-like cells from each diseased tissue sample relative to stem-like cells in normal samples in each tissue plotted against the malignancy continuum. Samples are colored based on if they are from different disease stage.
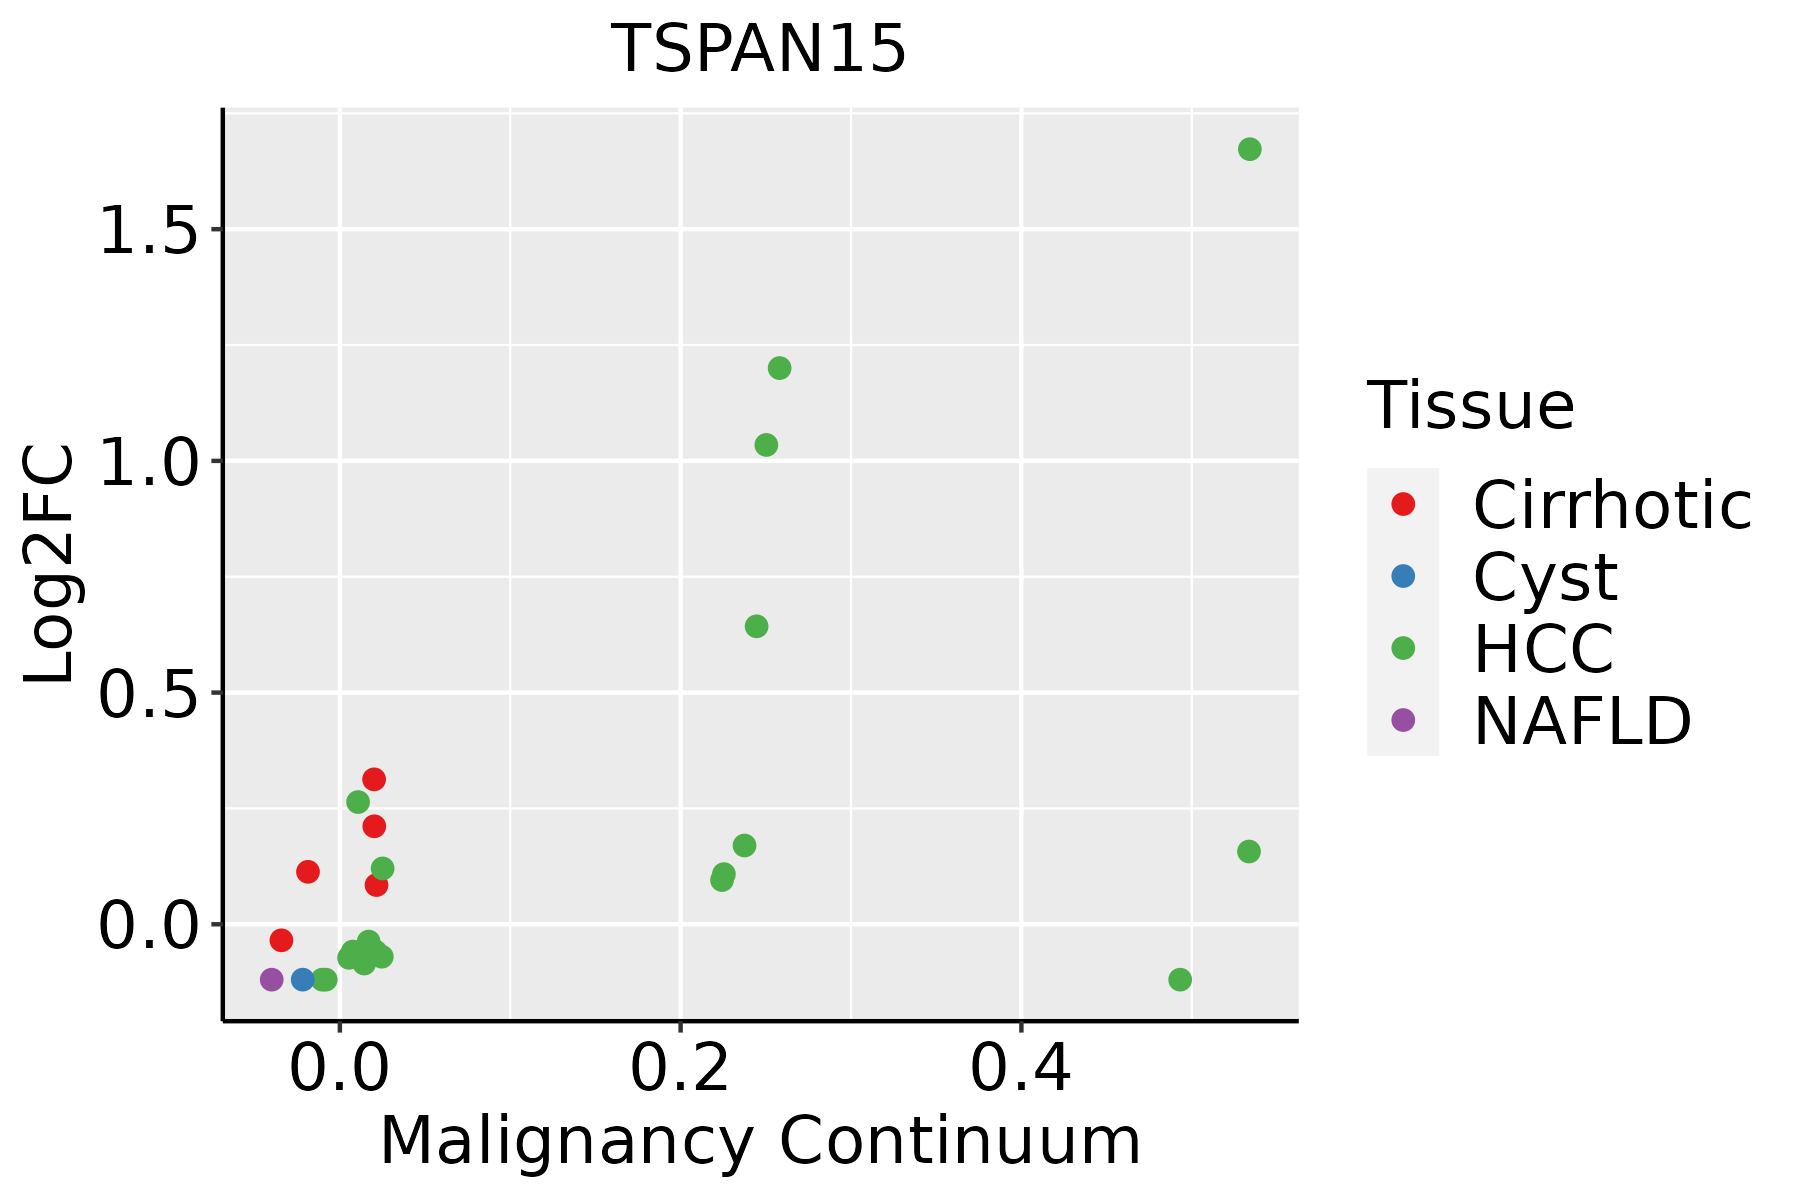
HCC: Hepatocellular carcinoma
NAFLD: Non-alcoholic fatty liver disease
Oral CavityThe image shows the transcriptomic changes along malignancy continuum.log2FC in expression of this searched gene in stem-like cells from each diseased tissue sample relative to stem-like cells in normal samples in each tissue plotted against the malignancy continuum. Samples are colored based on if they are from different disease stage.
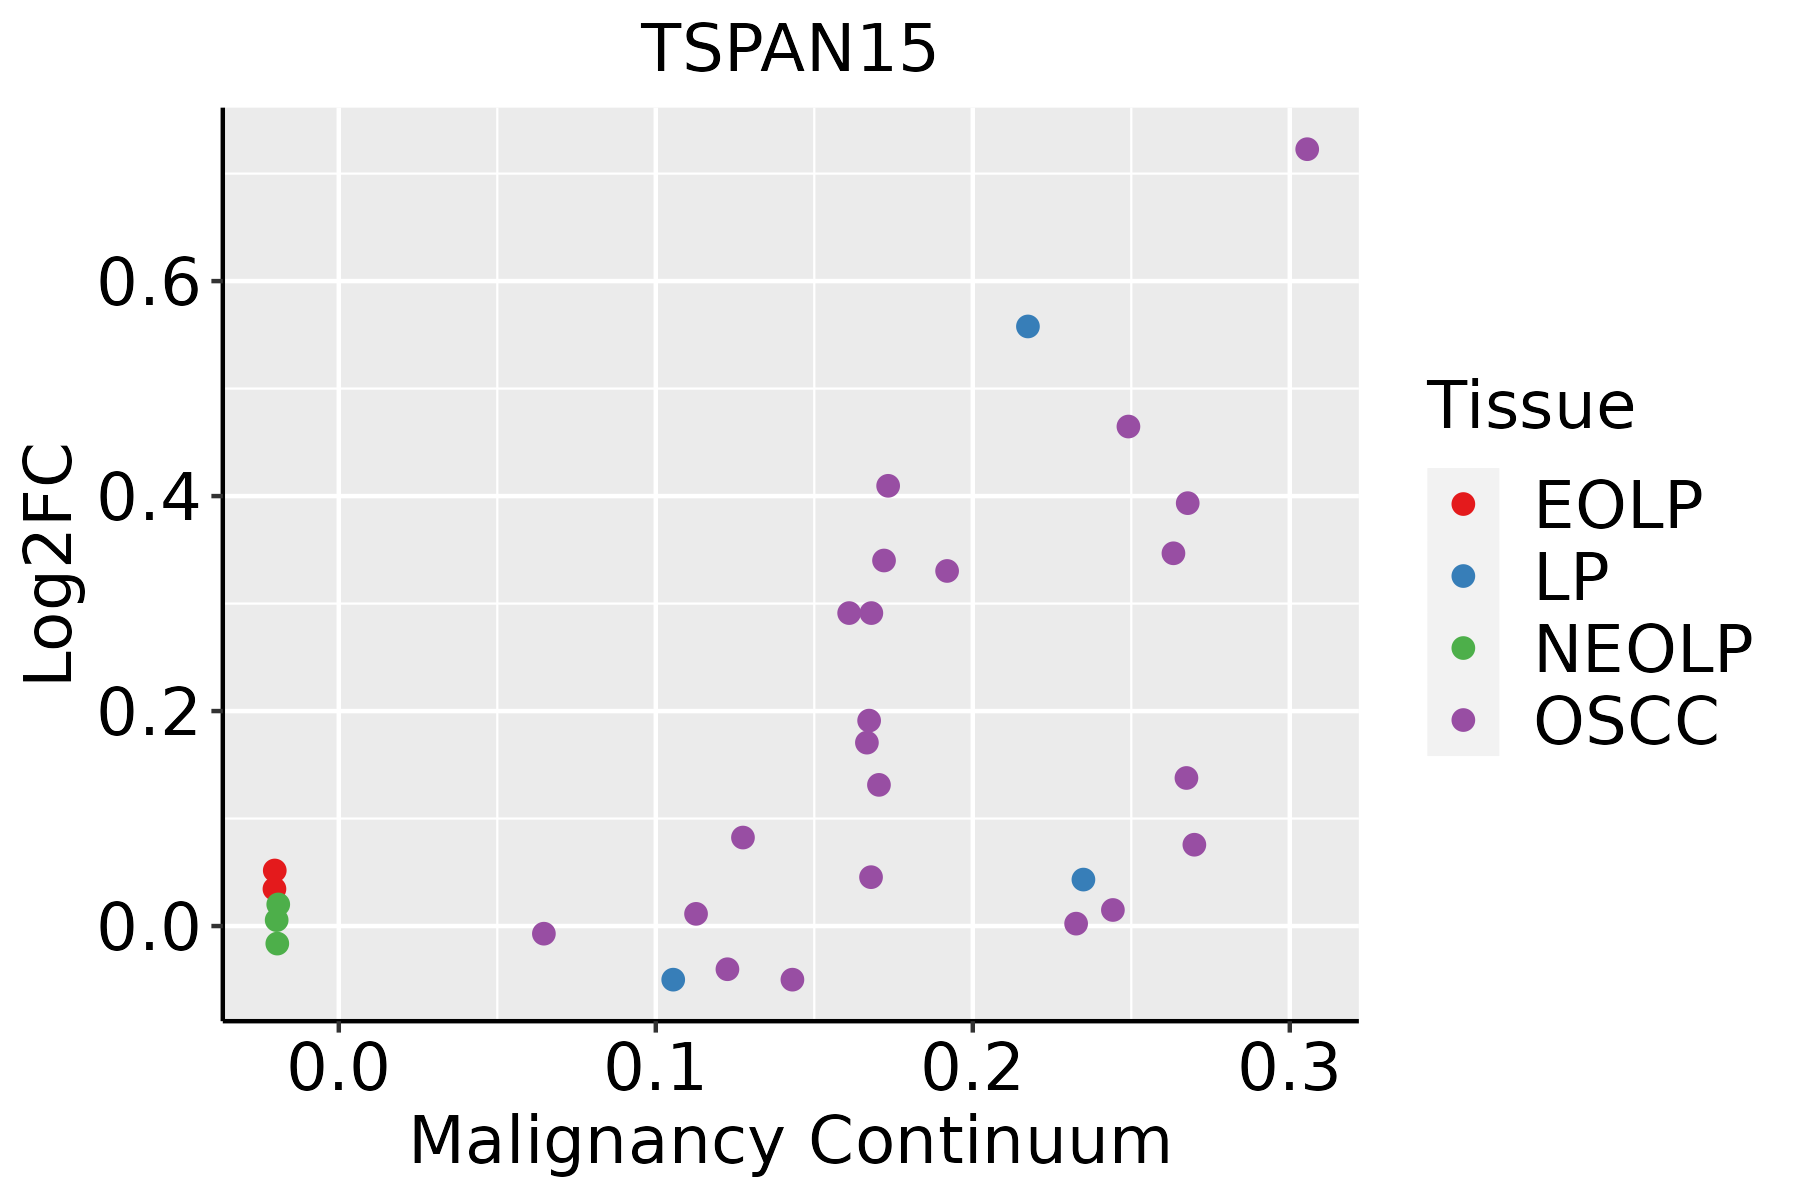
EOLP: Erosive Oral lichen planus
LP: leukoplakia
NEOLP: Non-erosive oral lichen planus
OSCC: Oral squamous cell carcinoma
∗log2FC in expression of this searched gene in stem-like cells from each diseased tissue sample relative to stem-like cells in normal samples in each tissue plotted against the malignancy continuum. Samples are colored based on if they are from different disease stage.

Top

Malignant transformation related pathway analysis

check buttonFind out the enriched GO biological processes and KEGG pathways involved in transition from healthy to precancer to cancer
check button Figure of enriched GO biological processes.
TissueDisease StageEnriched GO biological Processes
ColorectumADGO analysis - Figure of enriched GO biological processes: Top 15 enriched GO BP terms are showed in the bar plot of each disease state in each tissue. Each row represents a significant GO biological process which is colored according to the -log10(p.adjust).
ColorectumSERGO analysis - Figure of enriched GO biological processes: Top 15 enriched GO BP terms are showed in the bar plot of each disease state in each tissue. Each row represents a significant GO biological process which is colored according to the -log10(p.adjust).
ColorectumMSSGO analysis - Figure of enriched GO biological processes: Top 15 enriched GO BP terms are showed in the bar plot of each disease state in each tissue. Each row represents a significant GO biological process which is colored according to the -log10(p.adjust).
ColorectumMSI-HGO analysis - Figure of enriched GO biological processes: Top 15 enriched GO BP terms are showed in the bar plot of each disease state in each tissue. Each row represents a significant GO biological process which is colored according to the -log10(p.adjust).
ColorectumFAPGO analysis - Figure of enriched GO biological processes: Top 15 enriched GO BP terms are showed in the bar plot of each disease state in each tissue. Each row represents a significant GO biological process which is colored according to the -log10(p.adjust).
∗Top 15 enriched GO BP terms are showed in the bar plot of each disease state in each tissue. Each row represents a significant GO biological process which is colored according to the -log10(p.adjust).
Page: 1 2 3 4 5 6 7 8 9 

check button Enriched GO biological processes.
GO IDTissueDisease StageDescriptionGene RatioBg Ratiopvaluep.adjustCount
GO:0072659ColorectumADprotein localization to plasma membrane122/3918284/187232.86e-171.49e-14122
GO:1990778ColorectumADprotein localization to cell periphery129/3918333/187235.51e-141.15e-11129
GO:0051604ColorectumADprotein maturation85/3918294/187236.73e-046.91e-0385
GO:0007219ColorectumADNotch signaling pathway50/3918172/187236.92e-034.26e-0250
GO:00726591ColorectumSERprotein localization to plasma membrane92/2897284/187236.36e-131.86e-1092
GO:19907781ColorectumSERprotein localization to cell periphery98/2897333/187236.09e-119.57e-0998
GO:00516041ColorectumSERprotein maturation73/2897294/187231.82e-055.38e-0473
GO:00726594ColorectumFAPprotein localization to plasma membrane95/2622284/187234.86e-179.93e-1495
GO:19907784ColorectumFAPprotein localization to cell periphery100/2622333/187232.19e-142.68e-11100
GO:00072191ColorectumFAPNotch signaling pathway38/2622172/187232.56e-032.01e-0238
GO:00726595ColorectumCRCprotein localization to plasma membrane80/2078284/187231.36e-154.07e-1280
GO:19907785ColorectumCRCprotein localization to cell periphery85/2078333/187238.75e-141.05e-1085
GO:00072192ColorectumCRCNotch signaling pathway36/2078172/187231.26e-042.42e-0336
GO:0008593ColorectumCRCregulation of Notch signaling pathway21/207895/187231.48e-031.58e-0221
GO:00516044ColorectumCRCprotein maturation47/2078294/187236.52e-034.70e-0247
GO:0072659110EsophagusESCCprotein localization to plasma membrane193/8552284/187231.95e-141.03e-12193
GO:199077819EsophagusESCCprotein localization to cell periphery217/8552333/187234.08e-131.88e-11217
GO:005160418EsophagusESCCprotein maturation189/8552294/187237.64e-112.39e-09189
GO:00072197EsophagusESCCNotch signaling pathway106/8552172/187231.74e-051.55e-04106
GO:0045746EsophagusESCCnegative regulation of Notch signaling pathway28/855236/187238.62e-056.22e-0428
Page: 1 2 3 

check button Enriched KEGG pathways.
Pathway IDTissueDisease StageDescriptionGene RatioBg Ratiopvaluep.adjustqvalueCount
Page: 1 

Top

Cell-cell communication analysis

check buttonIdentification of potential cell-cell interactions between two cell types and their ligand-receptor pairs for different disease states
LigandReceptorLRpairPathwayTissueDisease Stage
Page: 1 

Top

Single-cell gene regulatory network inference analysis

check buttonFind out the significant the regulons (TFs) and the target genes of each regulon across cell types for different disease states
TFCell TypeTissueDisease StageTarget GeneRSSRegulon Activity
∗The dot plots of a searched regulon are shown for all cell subpopulations in each disease state of each tissue based on the regulon specific score inferred using pySCENIC and by calculating the average expression.
Page: 1 

Top

Somatic mutation of malignant transformation related genes

check buttonAnnotation of somatic variants for genes involved in malignant transformation
Hugo SymbolVariant ClassVariant ClassificationdbSNP RSHGVScHGVSpHGVSp ShortSWISSPROTBIOTYPESIFTPolyPhenTumor Sample BarcodeTissueHistologySexAgeStageTherapy TypesDrugsOutcome
TSPAN15SNVMissense_Mutationc.369N>Ap.Phe123Leup.F123LO95858protein_codingtolerated(1)benign(0.001)TCGA-EW-A1J5-01Breastbreast invasive carcinomaFemale<65I/IIChemotherapyadriamycinSD
TSPAN15SNVMissense_Mutationnovelc.634N>Tp.Asp212Tyrp.D212YO95858protein_codingdeleterious(0.01)possibly_damaging(0.724)TCGA-Z7-A8R6-01Breastbreast invasive carcinomaFemale<65I/IIChemotherapytaxolCR
TSPAN15insertionIn_Frame_Insnovelc.220_221insGGGAGTTGCCTGCCAGGCTGCTGGGAGGGTTGGGGTGGCAGCp.Phe74delinsTrpGluLeuProAlaArgLeuLeuGlyGlyLeuGlyTrpGlnLeup.F74delinsWELPARLLGGLGWQLO95858protein_codingTCGA-A2-A0CU-01Breastbreast invasive carcinomaFemale>=65I/IIHormone TherapytamoxiphenSD
TSPAN15insertionFrame_Shift_Insnovelc.432_433insTTp.Met145LeufsTer80p.M145Lfs*80O95858protein_codingTCGA-AN-A0FS-01Breastbreast invasive carcinomaFemale<65I/IIUnknownUnknownSD
TSPAN15insertionNonsense_Mutationnovelc.434_435insCTCAACTGCATAAGAp.Met145delinsIleSerThrAlaTerGlup.M145delinsISTA*EO95858protein_codingTCGA-AN-A0FS-01Breastbreast invasive carcinomaFemale<65I/IIUnknownUnknownSD
TSPAN15SNVMissense_Mutationc.389N>Cp.Arg130Thrp.R130TO95858protein_codingdeleterious(0.03)benign(0.324)TCGA-EK-A2PG-01Cervixcervical & endocervical cancerFemale>=65I/IIUnknownUnknownSD
TSPAN15SNVMissense_Mutationnovelc.83N>Tp.Ser28Phep.S28FO95858protein_codingdeleterious(0)possibly_damaging(0.828)TCGA-ZJ-AB0H-01Cervixcervical & endocervical cancerFemale<65III/IVUnknownUnknownSD
TSPAN15SNVMissense_Mutationc.704N>Tp.Ala235Valp.A235VO95858protein_codingtolerated(0.42)benign(0.343)TCGA-AA-3870-01Colorectumcolon adenocarcinomaFemale>=65III/IVChemotherapyfolinicCR
TSPAN15SNVMissense_Mutationrs772047337c.214N>Ap.Val72Ilep.V72IO95858protein_codingtolerated(0.73)benign(0.009)TCGA-A5-A0G1-01Endometriumuterine corpus endometrioid carcinomaFemale>=65I/IIUnknownUnknownSD
TSPAN15SNVMissense_Mutationc.347T>Ap.Phe116Tyrp.F116YO95858protein_codingdeleterious(0.01)probably_damaging(1)TCGA-AP-A056-01Endometriumuterine corpus endometrioid carcinomaFemale<65I/IIUnknownUnknownSD
Page: 1 2 3 

Top

Related drugs of malignant transformation related genes

check buttonIdentification of chemicals and drugs interact with genes involved in malignant transfromation
(DGIdb 4.0)
Entrez IDSymbolCategoryInteraction TypesDrug Claim NameDrug NamePMIDs
Page: 1