
|
|||||
|
 | |
| |
| |
| |
| |
| |
|
Gene: TSPAN14 |
Gene summary for TSPAN14 |
| Gene information | Species | Human | Gene symbol | TSPAN14 | Gene ID | 81619 |
| Gene name | tetraspanin 14 | |
| Gene Alias | DC-TM4F2 | |
| Cytomap | 10q23.1 | |
| Gene Type | protein-coding | GO ID | GO:0006807 | UniProtAcc | Q8NG11 |
Top |
Malignant transformation analysis |
| Identification of the aberrant gene expression in precancerous and cancerous lesions by comparing the gene expression of stem-like cells in diseased tissues with normal stem cells |
| Entrez ID | Symbol | Replicates | Species | Organ | Tissue | Adj P-value | Log2FC | Malignancy |
| 81619 | TSPAN14 | HTA11_347_2000001011 | Human | Colorectum | AD | 2.06e-09 | 3.80e-01 | -0.1954 |
| 81619 | TSPAN14 | HTA11_1391_2000001011 | Human | Colorectum | AD | 1.94e-02 | 3.56e-01 | -0.059 |
| 81619 | TSPAN14 | A015-C-203 | Human | Colorectum | FAP | 5.07e-11 | -2.06e-01 | -0.1294 |
| 81619 | TSPAN14 | A001-C-108 | Human | Colorectum | FAP | 6.68e-06 | -1.27e-01 | -0.0272 |
| 81619 | TSPAN14 | A002-C-205 | Human | Colorectum | FAP | 5.14e-04 | -1.72e-01 | -0.1236 |
| 81619 | TSPAN14 | A015-C-006 | Human | Colorectum | FAP | 1.55e-02 | -1.96e-01 | -0.0994 |
| 81619 | TSPAN14 | A015-C-106 | Human | Colorectum | FAP | 8.28e-06 | -1.18e-01 | -0.0511 |
| 81619 | TSPAN14 | A002-C-114 | Human | Colorectum | FAP | 3.19e-03 | -1.76e-01 | -0.1561 |
| 81619 | TSPAN14 | A015-C-104 | Human | Colorectum | FAP | 3.15e-11 | -2.12e-01 | -0.1899 |
| 81619 | TSPAN14 | A001-C-014 | Human | Colorectum | FAP | 4.59e-02 | -8.95e-02 | 0.0135 |
| 81619 | TSPAN14 | A002-C-016 | Human | Colorectum | FAP | 2.97e-06 | -1.47e-01 | 0.0521 |
| 81619 | TSPAN14 | A001-C-203 | Human | Colorectum | FAP | 1.07e-03 | -3.47e-02 | -0.0481 |
| 81619 | TSPAN14 | A002-C-116 | Human | Colorectum | FAP | 2.01e-11 | -2.12e-01 | -0.0452 |
| 81619 | TSPAN14 | A014-C-008 | Human | Colorectum | FAP | 4.40e-02 | -1.61e-01 | -0.191 |
| 81619 | TSPAN14 | A018-E-020 | Human | Colorectum | FAP | 3.94e-03 | -1.65e-01 | -0.2034 |
| 81619 | TSPAN14 | F034 | Human | Colorectum | FAP | 4.29e-04 | -7.27e-02 | -0.0665 |
| 81619 | TSPAN14 | F072B | Human | Colorectum | FAP | 2.58e-02 | -1.36e-01 | 0.257 |
| 81619 | TSPAN14 | CRC-1-8810 | Human | Colorectum | CRC | 1.33e-04 | -2.07e-01 | 0.6257 |
| 81619 | TSPAN14 | CRC-3-11773 | Human | Colorectum | CRC | 6.63e-04 | -1.04e-01 | 0.2564 |
| 81619 | TSPAN14 | LZE4T | Human | Esophagus | ESCC | 1.23e-10 | 5.16e-01 | 0.0811 |
| Page: 1 2 3 4 5 6 7 |
| Tissue | Expression Dynamics | Abbreviation |
| Colorectum (GSE201348) |  | FAP: Familial adenomatous polyposis |
| CRC: Colorectal cancer | ||
| Colorectum (HTA11) |  | AD: Adenomas |
| SER: Sessile serrated lesions | ||
| MSI-H: Microsatellite-high colorectal cancer | ||
| MSS: Microsatellite stable colorectal cancer | ||
| Esophagus |  | ESCC: Esophageal squamous cell carcinoma |
| HGIN: High-grade intraepithelial neoplasias | ||
| LGIN: Low-grade intraepithelial neoplasias | ||
| Liver | 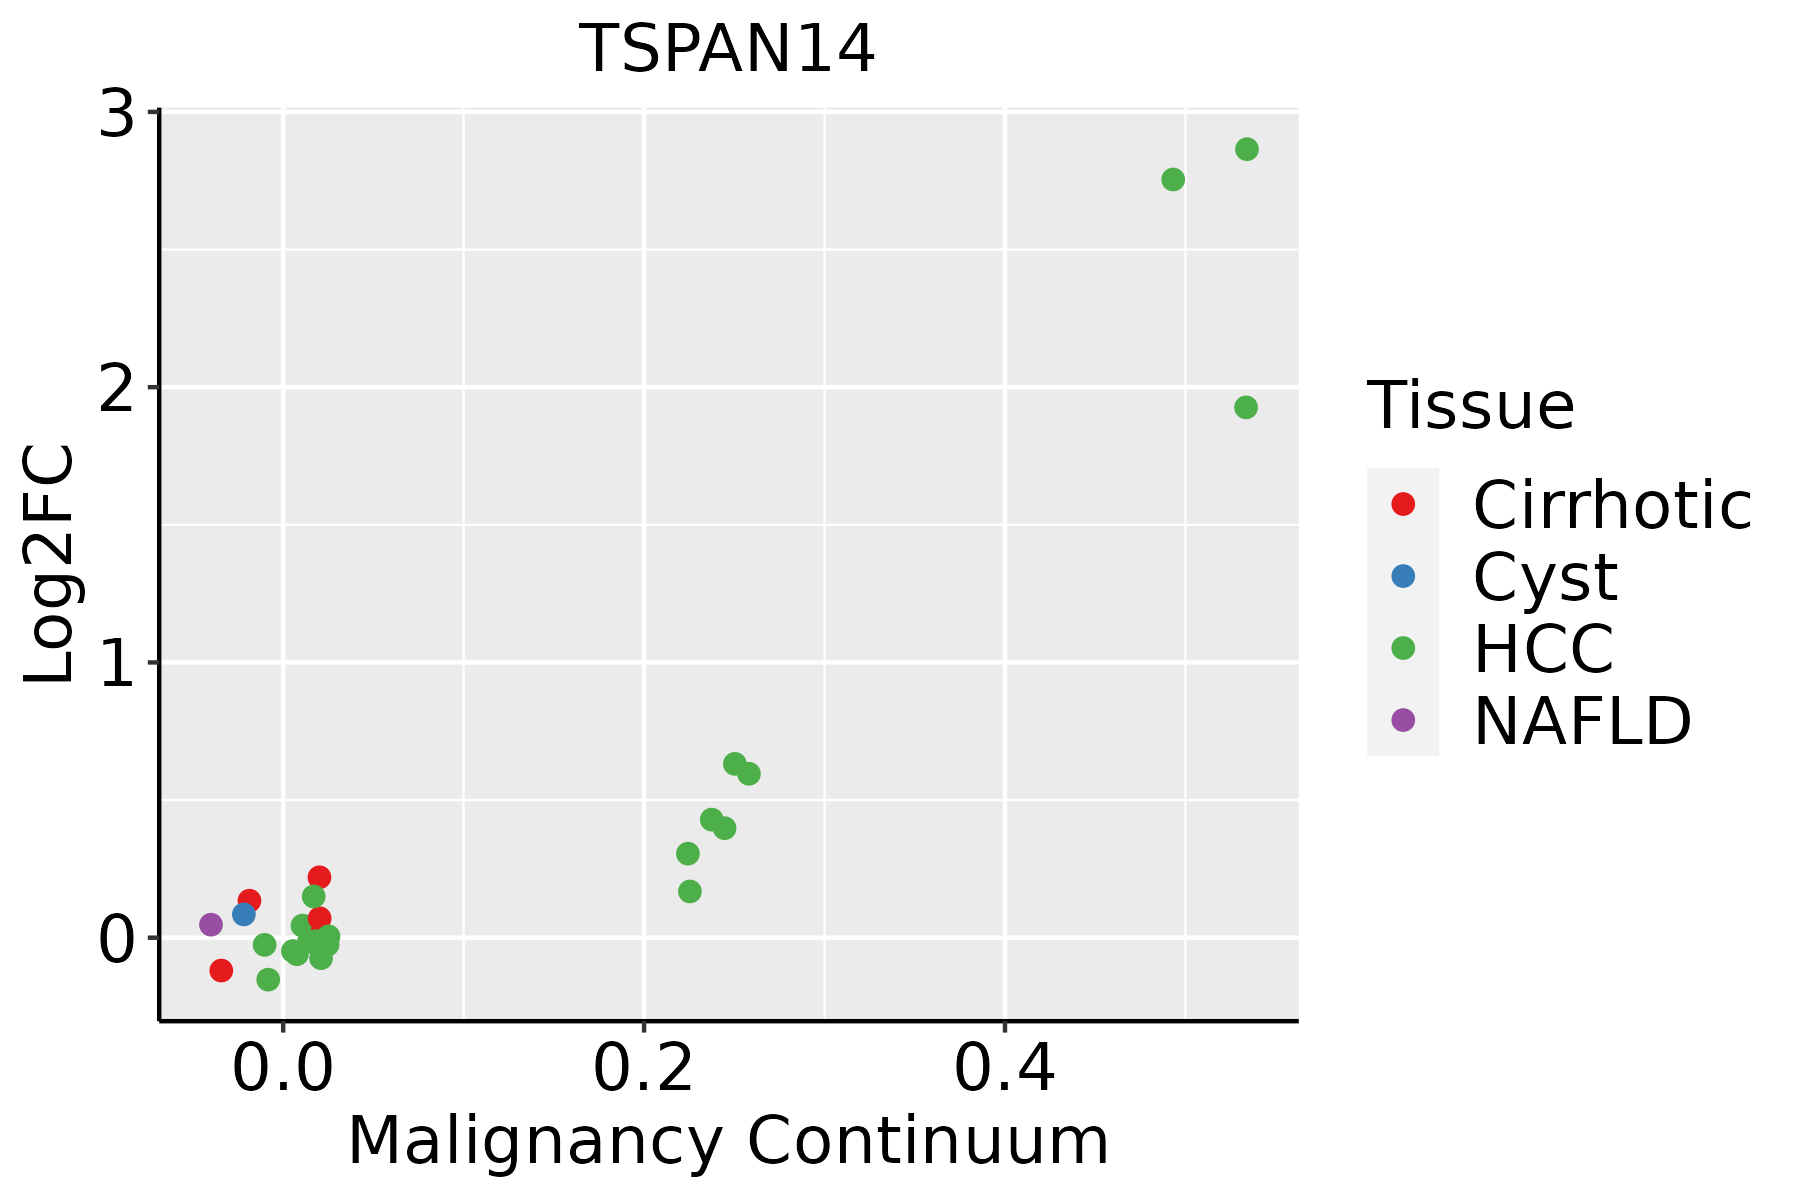 | HCC: Hepatocellular carcinoma |
| NAFLD: Non-alcoholic fatty liver disease | ||
| Oral Cavity |  | EOLP: Erosive Oral lichen planus |
| LP: leukoplakia | ||
| NEOLP: Non-erosive oral lichen planus | ||
| OSCC: Oral squamous cell carcinoma | ||
| Skin | 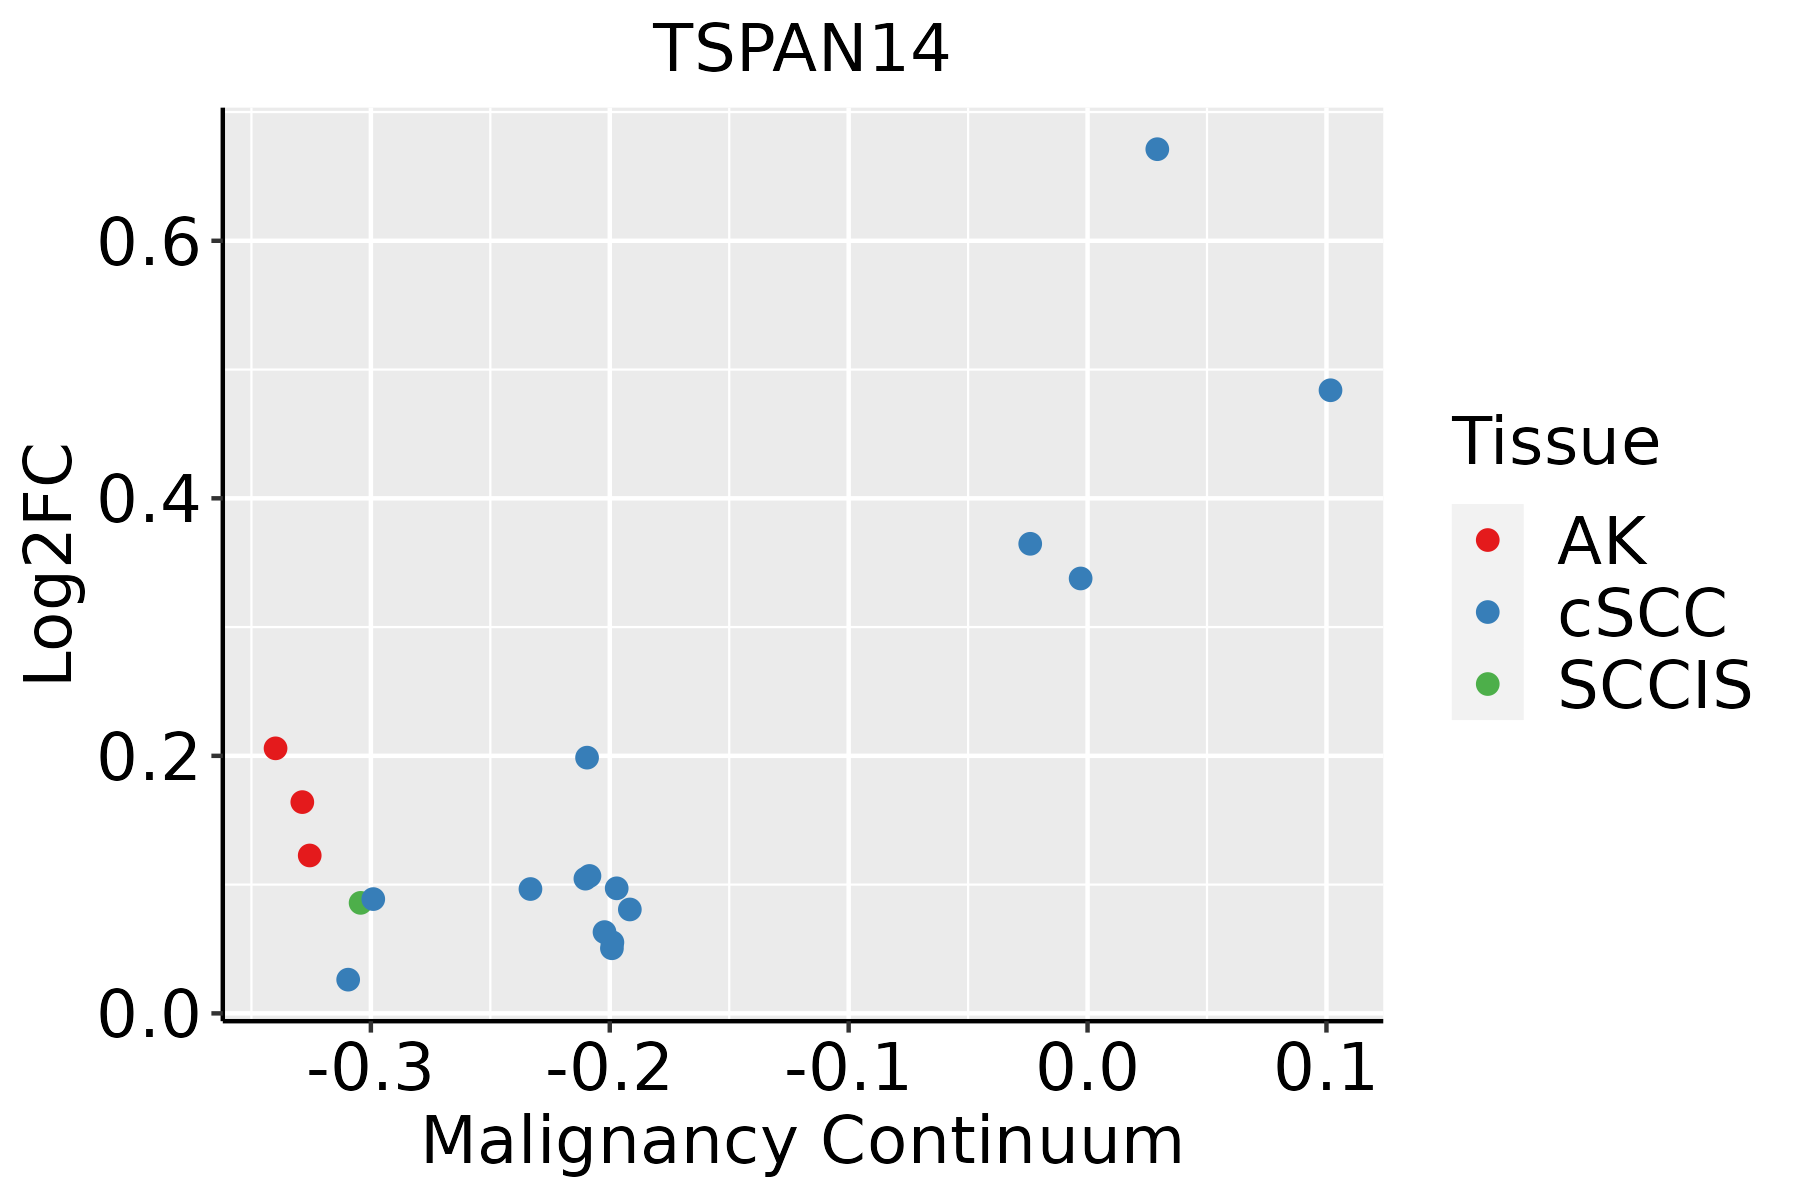 | AK: Actinic keratosis |
| cSCC: Cutaneous squamous cell carcinoma | ||
| SCCIS:squamous cell carcinoma in situ | ||
| Thyroid | 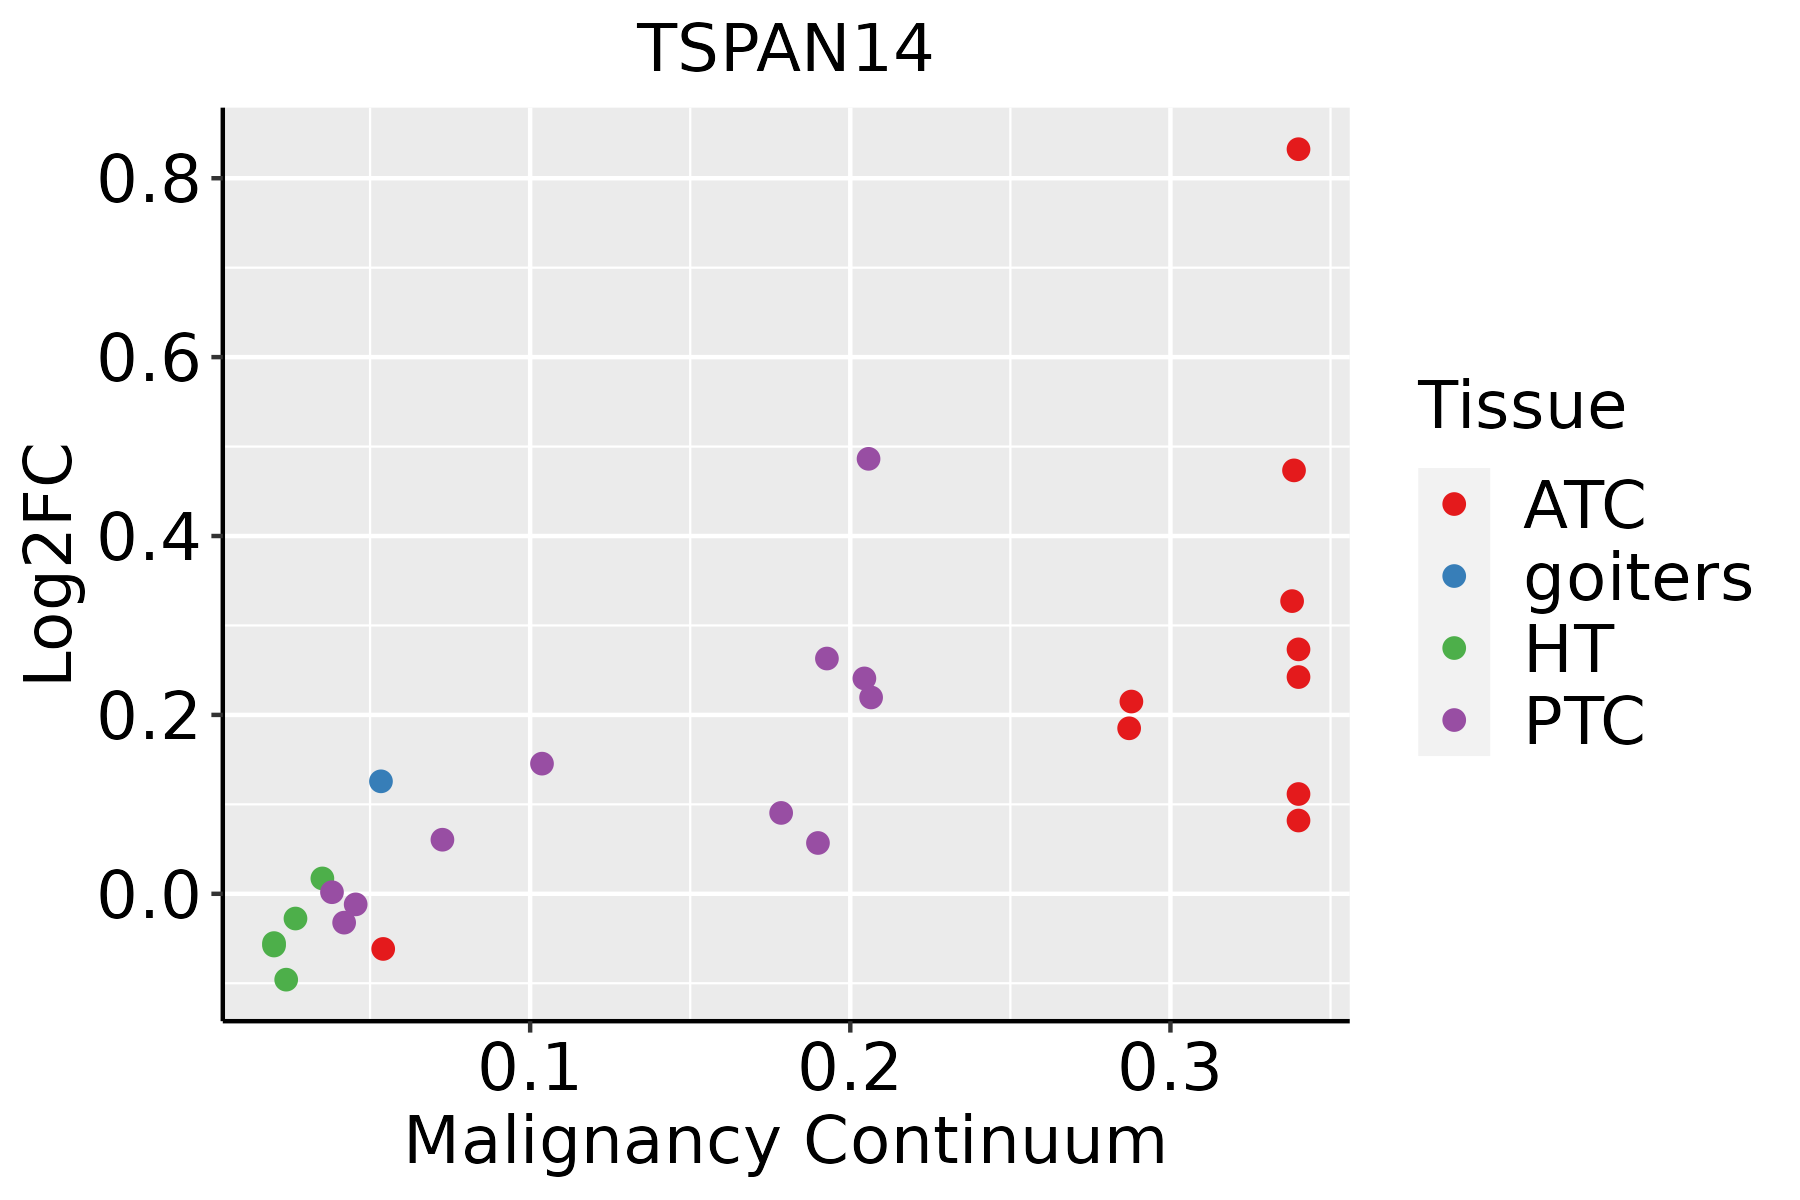 | ATC: Anaplastic thyroid cancer |
| HT: Hashimoto's thyroiditis | ||
| PTC: Papillary thyroid cancer |
| ∗log2FC in expression of this searched gene in stem-like cells from each diseased tissue sample relative to stem-like cells in normal samples in each tissue plotted against the malignancy continuum. Samples are colored based on if they are from different disease stage. |
Top |
Malignant transformation related pathway analysis |
| Find out the enriched GO biological processes and KEGG pathways involved in transition from healthy to precancer to cancer |
| Tissue | Disease Stage | Enriched GO biological Processes |
| Colorectum | AD |  |
| Colorectum | SER |  |
| Colorectum | MSS |  |
| Colorectum | MSI-H |  |
| Colorectum | FAP |  |
| ∗Top 15 enriched GO BP terms are showed in the bar plot of each disease state in each tissue. Each row represents a significant GO biological process which is colored according to the -log10(p.adjust). |
| Page: 1 2 3 4 5 6 7 8 9 |
| GO ID | Tissue | Disease Stage | Description | Gene Ratio | Bg Ratio | pvalue | p.adjust | Count |
| GO:0072659 | Colorectum | AD | protein localization to plasma membrane | 122/3918 | 284/18723 | 2.86e-17 | 1.49e-14 | 122 |
| GO:1990778 | Colorectum | AD | protein localization to cell periphery | 129/3918 | 333/18723 | 5.51e-14 | 1.15e-11 | 129 |
| GO:0051604 | Colorectum | AD | protein maturation | 85/3918 | 294/18723 | 6.73e-04 | 6.91e-03 | 85 |
| GO:0007219 | Colorectum | AD | Notch signaling pathway | 50/3918 | 172/18723 | 6.92e-03 | 4.26e-02 | 50 |
| GO:00726594 | Colorectum | FAP | protein localization to plasma membrane | 95/2622 | 284/18723 | 4.86e-17 | 9.93e-14 | 95 |
| GO:19907784 | Colorectum | FAP | protein localization to cell periphery | 100/2622 | 333/18723 | 2.19e-14 | 2.68e-11 | 100 |
| GO:00072191 | Colorectum | FAP | Notch signaling pathway | 38/2622 | 172/18723 | 2.56e-03 | 2.01e-02 | 38 |
| GO:00726595 | Colorectum | CRC | protein localization to plasma membrane | 80/2078 | 284/18723 | 1.36e-15 | 4.07e-12 | 80 |
| GO:19907785 | Colorectum | CRC | protein localization to cell periphery | 85/2078 | 333/18723 | 8.75e-14 | 1.05e-10 | 85 |
| GO:00072192 | Colorectum | CRC | Notch signaling pathway | 36/2078 | 172/18723 | 1.26e-04 | 2.42e-03 | 36 |
| GO:0008593 | Colorectum | CRC | regulation of Notch signaling pathway | 21/2078 | 95/18723 | 1.48e-03 | 1.58e-02 | 21 |
| GO:00516044 | Colorectum | CRC | protein maturation | 47/2078 | 294/18723 | 6.52e-03 | 4.70e-02 | 47 |
| GO:0072659110 | Esophagus | ESCC | protein localization to plasma membrane | 193/8552 | 284/18723 | 1.95e-14 | 1.03e-12 | 193 |
| GO:199077819 | Esophagus | ESCC | protein localization to cell periphery | 217/8552 | 333/18723 | 4.08e-13 | 1.88e-11 | 217 |
| GO:005160418 | Esophagus | ESCC | protein maturation | 189/8552 | 294/18723 | 7.64e-11 | 2.39e-09 | 189 |
| GO:00072197 | Esophagus | ESCC | Notch signaling pathway | 106/8552 | 172/18723 | 1.74e-05 | 1.55e-04 | 106 |
| GO:00085935 | Esophagus | ESCC | regulation of Notch signaling pathway | 59/8552 | 95/18723 | 9.12e-04 | 4.65e-03 | 59 |
| GO:199077811 | Liver | Cirrhotic | protein localization to cell periphery | 135/4634 | 333/18723 | 1.18e-10 | 6.21e-09 | 135 |
| GO:007265911 | Liver | Cirrhotic | protein localization to plasma membrane | 119/4634 | 284/18723 | 1.30e-10 | 6.80e-09 | 119 |
| GO:00516046 | Liver | Cirrhotic | protein maturation | 121/4634 | 294/18723 | 3.54e-10 | 1.68e-08 | 121 |
| Page: 1 2 3 |
| Pathway ID | Tissue | Disease Stage | Description | Gene Ratio | Bg Ratio | pvalue | p.adjust | qvalue | Count |
| Page: 1 |
Top |
Cell-cell communication analysis |
| Identification of potential cell-cell interactions between two cell types and their ligand-receptor pairs for different disease states |
| Ligand | Receptor | LRpair | Pathway | Tissue | Disease Stage |
| Page: 1 |
Top |
Single-cell gene regulatory network inference analysis |
| Find out the significant the regulons (TFs) and the target genes of each regulon across cell types for different disease states |
| TF | Cell Type | Tissue | Disease Stage | Target Gene | RSS | Regulon Activity |
| ∗The dot plots of a searched regulon are shown for all cell subpopulations in each disease state of each tissue based on the regulon specific score inferred using pySCENIC and by calculating the average expression. |
| Page: 1 |
Top |
Somatic mutation of malignant transformation related genes |
| Annotation of somatic variants for genes involved in malignant transformation |
| Hugo Symbol | Variant Class | Variant Classification | dbSNP RS | HGVSc | HGVSp | HGVSp Short | SWISSPROT | BIOTYPE | SIFT | PolyPhen | Tumor Sample Barcode | Tissue | Histology | Sex | Age | Stage | Therapy Types | Drugs | Outcome |
| TSPAN14 | deletion | Frame_Shift_Del | novel | c.81+1delG | Q8NG11 | protein_coding | TCGA-EW-A2FV-01 | Breast | breast invasive carcinoma | Female | <65 | III/IV | Chemotherapy | docetaxel | SD | ||||
| TSPAN14 | SNV | Missense_Mutation | novel | c.720N>A | p.Phe240Leu | p.F240L | Q8NG11 | protein_coding | tolerated(0.06) | benign(0.082) | TCGA-MY-A913-01 | Cervix | cervical & endocervical cancer | Female | <65 | I/II | Chemotherapy | cisplatin | CR |
| TSPAN14 | SNV | Missense_Mutation | c.143N>T | p.Ser48Phe | p.S48F | Q8NG11 | protein_coding | deleterious(0.02) | possibly_damaging(0.781) | TCGA-AA-3494-01 | Colorectum | colon adenocarcinoma | Male | <65 | III/IV | Chemotherapy | folinic | PR | |
| TSPAN14 | SNV | Missense_Mutation | rs746320441 | c.724N>A | p.Ala242Thr | p.A242T | Q8NG11 | protein_coding | tolerated(0.27) | benign(0.072) | TCGA-AZ-4313-01 | Colorectum | colon adenocarcinoma | Female | <65 | I/II | Unknown | Unknown | SD |
| TSPAN14 | SNV | Missense_Mutation | c.476N>A | p.Pro159His | p.P159H | Q8NG11 | protein_coding | deleterious(0.01) | probably_damaging(0.918) | TCGA-CM-6171-01 | Colorectum | colon adenocarcinoma | Female | >=65 | I/II | Unknown | Unknown | SD | |
| TSPAN14 | SNV | Missense_Mutation | novel | c.235N>T | p.Gly79Cys | p.G79C | Q8NG11 | protein_coding | deleterious(0) | probably_damaging(1) | TCGA-A5-A0G2-01 | Endometrium | uterine corpus endometrioid carcinoma | Female | <65 | III/IV | Unknown | Unknown | SD |
| TSPAN14 | SNV | Missense_Mutation | novel | c.415N>A | p.Asp139Asn | p.D139N | Q8NG11 | protein_coding | deleterious(0) | probably_damaging(0.954) | TCGA-A5-A0G2-01 | Endometrium | uterine corpus endometrioid carcinoma | Female | <65 | III/IV | Unknown | Unknown | SD |
| TSPAN14 | SNV | Missense_Mutation | c.493N>C | p.Asn165His | p.N165H | Q8NG11 | protein_coding | deleterious(0) | probably_damaging(0.996) | TCGA-A5-A0G2-01 | Endometrium | uterine corpus endometrioid carcinoma | Female | <65 | III/IV | Unknown | Unknown | SD | |
| TSPAN14 | SNV | Missense_Mutation | novel | c.25G>A | p.Ala9Thr | p.A9T | Q8NG11 | protein_coding | tolerated(0.38) | benign(0.009) | TCGA-AJ-A5DW-01 | Endometrium | uterine corpus endometrioid carcinoma | Female | <65 | I/II | Unknown | Unknown | SD |
| TSPAN14 | SNV | Missense_Mutation | rs868739186 | c.787N>A | p.Ala263Thr | p.A263T | Q8NG11 | protein_coding | tolerated(0.11) | benign(0.196) | TCGA-AP-A051-01 | Endometrium | uterine corpus endometrioid carcinoma | Female | >=65 | I/II | Unknown | Unknown | SD |
| Page: 1 2 3 4 |
Top |
Related drugs of malignant transformation related genes |
| Identification of chemicals and drugs interact with genes involved in malignant transfromation |
| (DGIdb 4.0) |
| Entrez ID | Symbol | Category | Interaction Types | Drug Claim Name | Drug Name | PMIDs |
| Page: 1 |

Copyright 2023-Present -The University of Texas Health Science Center at Houston |