
|
|||||
|
 | |
| |
| |
| |
| |
| |
|
Gene: TSPAN10 |
Gene summary for TSPAN10 |
| Gene information | Species | Human | Gene symbol | TSPAN10 | Gene ID | 83882 |
| Gene name | tetraspanin 10 | |
| Gene Alias | OCSP | |
| Cytomap | 17q25.3 | |
| Gene Type | protein-coding | GO ID | GO:0008104 | UniProtAcc | A0A087WWT4 |
Top |
Malignant transformation analysis |
| Identification of the aberrant gene expression in precancerous and cancerous lesions by comparing the gene expression of stem-like cells in diseased tissues with normal stem cells |
| Entrez ID | Symbol | Replicates | Species | Organ | Tissue | Adj P-value | Log2FC | Malignancy |
| 83882 | TSPAN10 | C04 | Human | Oral cavity | OSCC | 4.18e-22 | 8.52e-01 | 0.2633 |
| 83882 | TSPAN10 | C21 | Human | Oral cavity | OSCC | 6.50e-35 | 9.11e-01 | 0.2678 |
| 83882 | TSPAN10 | C30 | Human | Oral cavity | OSCC | 1.13e-25 | 1.01e+00 | 0.3055 |
| 83882 | TSPAN10 | C46 | Human | Oral cavity | OSCC | 6.27e-03 | 8.35e-02 | 0.1673 |
| 83882 | TSPAN10 | C51 | Human | Oral cavity | OSCC | 1.37e-06 | 4.45e-01 | 0.2674 |
| 83882 | TSPAN10 | C06 | Human | Oral cavity | OSCC | 7.37e-07 | 4.33e-01 | 0.2699 |
| 83882 | TSPAN10 | C07 | Human | Oral cavity | OSCC | 2.66e-02 | 5.93e-01 | 0.2491 |
| 83882 | TSPAN10 | C08 | Human | Oral cavity | OSCC | 3.32e-06 | 2.07e-01 | 0.1919 |
| 83882 | TSPAN10 | C09 | Human | Oral cavity | OSCC | 7.46e-04 | 8.02e-02 | 0.1431 |
| 83882 | TSPAN10 | LP15 | Human | Oral cavity | LP | 1.87e-04 | 4.51e-01 | 0.2174 |
| 83882 | TSPAN10 | LP17 | Human | Oral cavity | LP | 3.21e-06 | 4.71e-01 | 0.2349 |
| 83882 | TSPAN10 | SYSMH3 | Human | Oral cavity | OSCC | 6.11e-12 | 3.35e-01 | 0.2442 |
| 83882 | TSPAN10 | SYSMH5 | Human | Oral cavity | OSCC | 4.68e-04 | 1.81e-01 | 0.0647 |
| Page: 1 |
| Tissue | Expression Dynamics | Abbreviation |
| Oral Cavity | 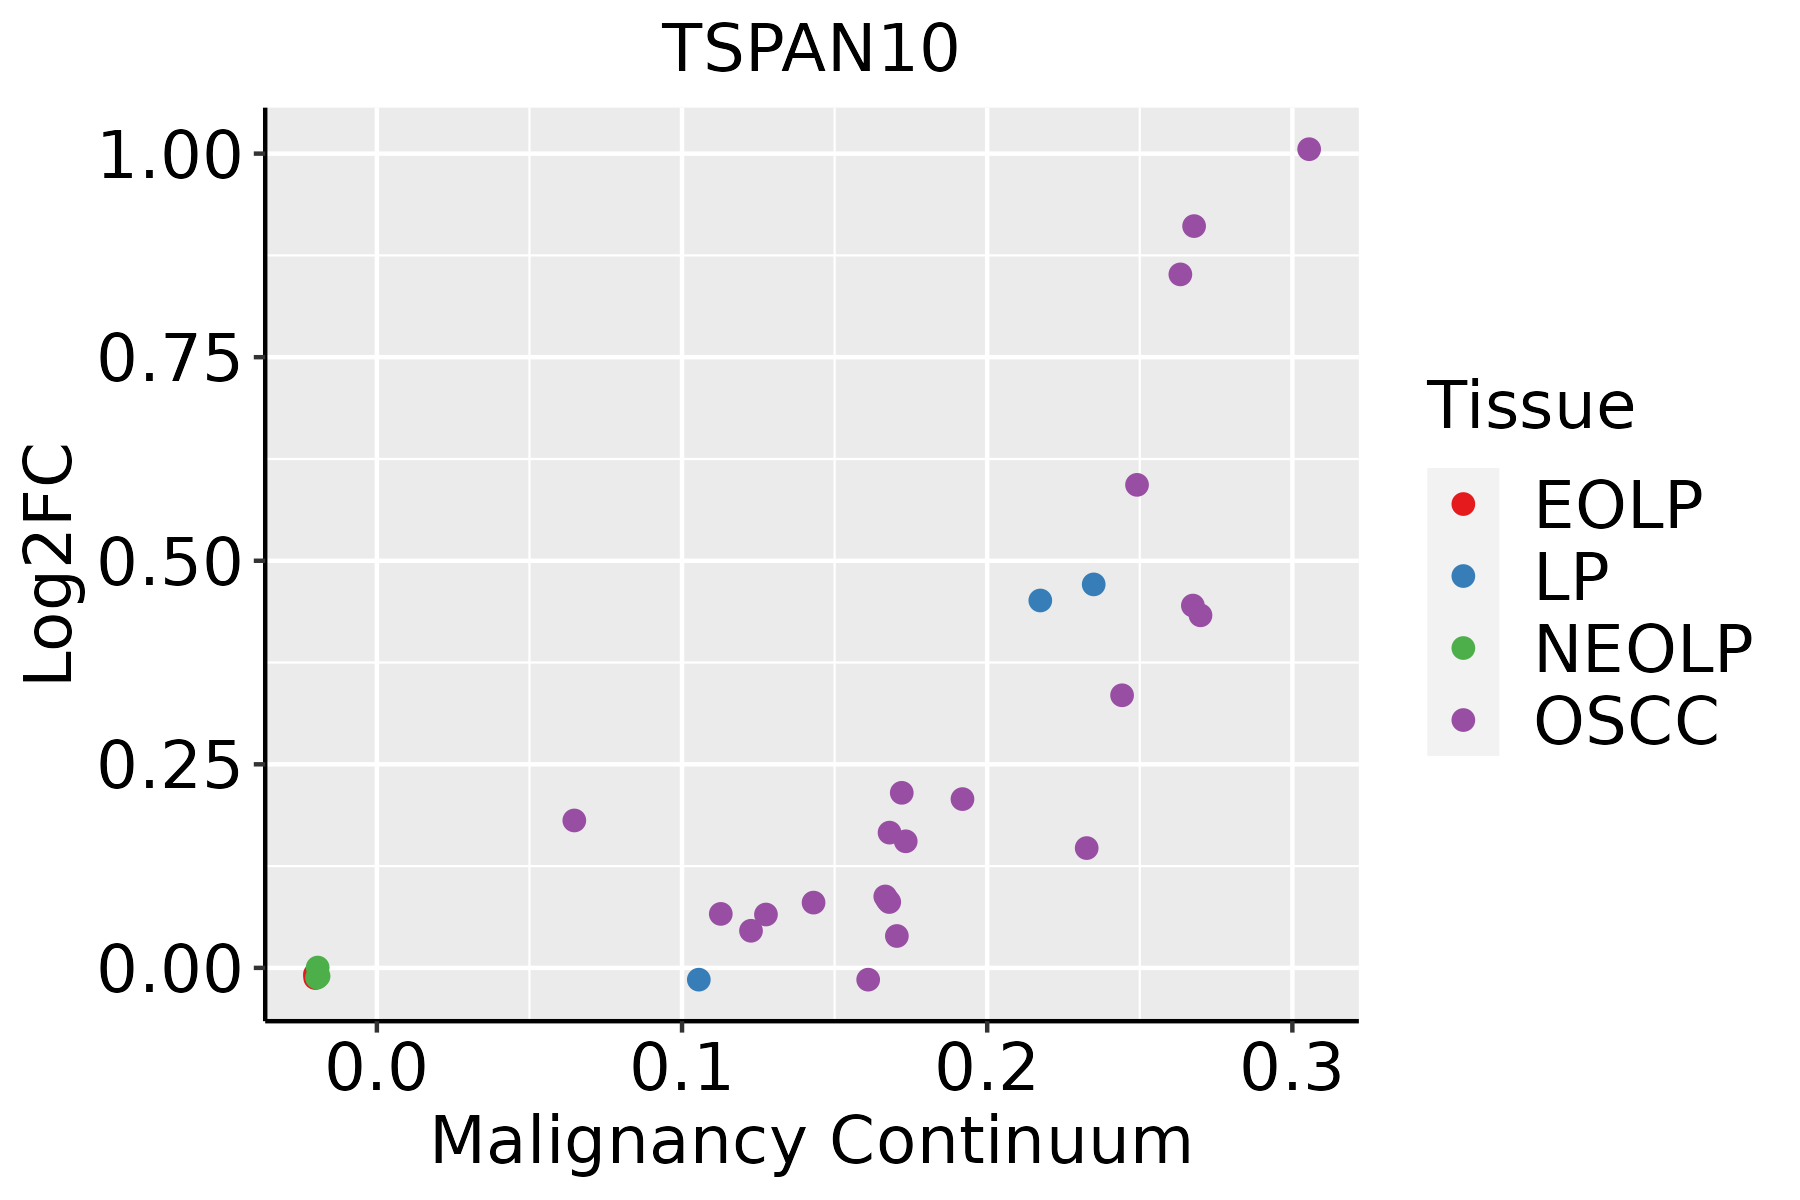 | EOLP: Erosive Oral lichen planus |
| LP: leukoplakia | ||
| NEOLP: Non-erosive oral lichen planus | ||
| OSCC: Oral squamous cell carcinoma |
| ∗log2FC in expression of this searched gene in stem-like cells from each diseased tissue sample relative to stem-like cells in normal samples in each tissue plotted against the malignancy continuum. Samples are colored based on if they are from different disease stage. |
Top |
Malignant transformation related pathway analysis |
| Find out the enriched GO biological processes and KEGG pathways involved in transition from healthy to precancer to cancer |
| Tissue | Disease Stage | Enriched GO biological Processes |
| Colorectum | AD |  |
| Colorectum | SER |  |
| Colorectum | MSS |  |
| Colorectum | MSI-H |  |
| Colorectum | FAP |  |
| ∗Top 15 enriched GO BP terms are showed in the bar plot of each disease state in each tissue. Each row represents a significant GO biological process which is colored according to the -log10(p.adjust). |
| Page: 1 2 3 4 5 6 7 8 9 |
| GO ID | Tissue | Disease Stage | Description | Gene Ratio | Bg Ratio | pvalue | p.adjust | Count |
| GO:007259418 | Oral cavity | OSCC | establishment of protein localization to organelle | 284/7305 | 422/18723 | 1.50e-32 | 1.35e-29 | 284 |
| GO:007259419 | Oral cavity | LP | establishment of protein localization to organelle | 205/4623 | 422/18723 | 6.76e-27 | 3.85e-24 | 205 |
| Page: 1 |
| Pathway ID | Tissue | Disease Stage | Description | Gene Ratio | Bg Ratio | pvalue | p.adjust | qvalue | Count |
| Page: 1 |
Top |
Cell-cell communication analysis |
| Identification of potential cell-cell interactions between two cell types and their ligand-receptor pairs for different disease states |
| Ligand | Receptor | LRpair | Pathway | Tissue | Disease Stage |
| Page: 1 |
Top |
Single-cell gene regulatory network inference analysis |
| Find out the significant the regulons (TFs) and the target genes of each regulon across cell types for different disease states |
| TF | Cell Type | Tissue | Disease Stage | Target Gene | RSS | Regulon Activity |
| ∗The dot plots of a searched regulon are shown for all cell subpopulations in each disease state of each tissue based on the regulon specific score inferred using pySCENIC and by calculating the average expression. |
| Page: 1 |
Top |
Somatic mutation of malignant transformation related genes |
| Annotation of somatic variants for genes involved in malignant transformation |
| Hugo Symbol | Variant Class | Variant Classification | dbSNP RS | HGVSc | HGVSp | HGVSp Short | SWISSPROT | BIOTYPE | SIFT | PolyPhen | Tumor Sample Barcode | Tissue | Histology | Sex | Age | Stage | Therapy Types | Drugs | Outcome |
| TSPAN10 | SNV | Missense_Mutation | rs374329590 | c.610N>A | p.Val204Met | p.V204M | protein_coding | tolerated(0.11) | benign(0.134) | TCGA-EA-A3HS-01 | Cervix | cervical & endocervical cancer | Female | <65 | I/II | Unknown | Unknown | SD | |
| TSPAN10 | SNV | Missense_Mutation | rs753180923 | c.457N>G | p.Pro153Ala | p.P153A | protein_coding | tolerated(0.71) | benign(0.023) | TCGA-A6-2686-01 | Colorectum | colon adenocarcinoma | Female | >=65 | I/II | Unknown | Unknown | SD | |
| TSPAN10 | SNV | Missense_Mutation | rs543859014 | c.65C>T | p.Ala22Val | p.A22V | protein_coding | tolerated_low_confidence(0.23) | benign(0.068) | TCGA-CK-5916-01 | Colorectum | colon adenocarcinoma | Female | >=65 | I/II | Unknown | Unknown | PD | |
| TSPAN10 | SNV | Missense_Mutation | novel | c.343A>G | p.Lys115Glu | p.K115E | protein_coding | deleterious(0) | probably_damaging(0.976) | TCGA-CK-5916-01 | Colorectum | colon adenocarcinoma | Female | >=65 | I/II | Unknown | Unknown | PD | |
| TSPAN10 | SNV | Missense_Mutation | rs771337272 | c.76C>T | p.Arg26Trp | p.R26W | protein_coding | deleterious_low_confidence(0.02) | benign(0) | TCGA-G4-6320-01 | Colorectum | colon adenocarcinoma | Male | >=65 | III/IV | Chemotherapy | oxaliplatin | SD | |
| TSPAN10 | SNV | Missense_Mutation | rs753180923 | c.457N>G | p.Pro153Ala | p.P153A | protein_coding | tolerated(0.71) | benign(0.023) | TCGA-NH-A50V-01 | Colorectum | colon adenocarcinoma | Male | >=65 | III/IV | Chemotherapy | fluorouracil | CR | |
| TSPAN10 | SNV | Missense_Mutation | rs776886068 | c.448N>A | p.Leu150Met | p.L150M | protein_coding | tolerated(0.07) | possibly_damaging(0.905) | TCGA-F5-6814-01 | Colorectum | rectum adenocarcinoma | Male | <65 | I/II | Unknown | Unknown | SD | |
| TSPAN10 | insertion | In_Frame_Ins | novel | c.186_187insCCA | p.Pro64dup | p.P64dup | protein_coding | TCGA-5M-AAT4-01 | Colorectum | colon adenocarcinoma | Male | >=65 | III/IV | Unknown | Unknown | PD | |||
| TSPAN10 | deletion | Frame_Shift_Del | rs774620230 | c.450delN | p.Leu154CysfsTer19 | p.L154Cfs*19 | protein_coding | TCGA-AD-6964-01 | Colorectum | colon adenocarcinoma | Male | <65 | III/IV | Chemotherapy | folfox | PD | |||
| TSPAN10 | deletion | Frame_Shift_Del | rs774620230 | c.456delG | p.Leu154CysfsTer19 | p.L154Cfs*19 | protein_coding | TCGA-AM-5821-01 | Colorectum | colon adenocarcinoma | Female | >=65 | I/II | Unknown | Unknown | SD |
| Page: 1 2 3 4 |
Top |
Related drugs of malignant transformation related genes |
| Identification of chemicals and drugs interact with genes involved in malignant transfromation |
| (DGIdb 4.0) |
| Entrez ID | Symbol | Category | Interaction Types | Drug Claim Name | Drug Name | PMIDs |
| Page: 1 |

Copyright 2023-Present -The University of Texas Health Science Center at Houston |