
|
|||||
|
 | |
| |
| |
| |
| |
| |
|
Gene: TSNARE1 |
Gene summary for TSNARE1 |
| Gene information | Species | Human | Gene symbol | TSNARE1 | Gene ID | 203062 |
| Gene name | t-SNARE domain containing 1 | |
| Gene Alias | TSNARE1 | |
| Cytomap | 8q24.3 | |
| Gene Type | protein-coding | GO ID | GO:0006810 | UniProtAcc | E5RHT3 |
Top |
Malignant transformation analysis |
| Identification of the aberrant gene expression in precancerous and cancerous lesions by comparing the gene expression of stem-like cells in diseased tissues with normal stem cells |
| Entrez ID | Symbol | Replicates | Species | Organ | Tissue | Adj P-value | Log2FC | Malignancy |
| 203062 | TSNARE1 | LZE7T | Human | Esophagus | ESCC | 2.59e-03 | 2.43e-01 | 0.0667 |
| 203062 | TSNARE1 | LZE24T | Human | Esophagus | ESCC | 7.82e-03 | 1.43e-01 | 0.0596 |
| 203062 | TSNARE1 | P2T-E | Human | Esophagus | ESCC | 2.29e-02 | 9.82e-02 | 0.1177 |
| 203062 | TSNARE1 | P5T-E | Human | Esophagus | ESCC | 2.24e-03 | 1.01e-01 | 0.1327 |
| 203062 | TSNARE1 | P10T-E | Human | Esophagus | ESCC | 5.48e-06 | 1.52e-01 | 0.116 |
| 203062 | TSNARE1 | P12T-E | Human | Esophagus | ESCC | 8.05e-04 | 1.26e-01 | 0.1122 |
| 203062 | TSNARE1 | P15T-E | Human | Esophagus | ESCC | 1.10e-06 | 2.13e-01 | 0.1149 |
| 203062 | TSNARE1 | P16T-E | Human | Esophagus | ESCC | 2.82e-15 | 3.20e-01 | 0.1153 |
| 203062 | TSNARE1 | P21T-E | Human | Esophagus | ESCC | 1.45e-09 | 2.29e-01 | 0.1617 |
| 203062 | TSNARE1 | P26T-E | Human | Esophagus | ESCC | 1.59e-09 | 2.13e-01 | 0.1276 |
| 203062 | TSNARE1 | P27T-E | Human | Esophagus | ESCC | 1.74e-07 | 1.77e-01 | 0.1055 |
| 203062 | TSNARE1 | P28T-E | Human | Esophagus | ESCC | 1.06e-07 | 1.68e-01 | 0.1149 |
| 203062 | TSNARE1 | P30T-E | Human | Esophagus | ESCC | 2.44e-05 | 2.62e-01 | 0.137 |
| 203062 | TSNARE1 | P31T-E | Human | Esophagus | ESCC | 2.77e-05 | 1.17e-01 | 0.1251 |
| 203062 | TSNARE1 | P32T-E | Human | Esophagus | ESCC | 3.21e-02 | 7.28e-02 | 0.1666 |
| 203062 | TSNARE1 | P36T-E | Human | Esophagus | ESCC | 1.43e-03 | 1.92e-01 | 0.1187 |
| 203062 | TSNARE1 | P37T-E | Human | Esophagus | ESCC | 1.42e-03 | 1.28e-01 | 0.1371 |
| 203062 | TSNARE1 | P42T-E | Human | Esophagus | ESCC | 3.13e-02 | 1.20e-01 | 0.1175 |
| 203062 | TSNARE1 | P47T-E | Human | Esophagus | ESCC | 8.82e-04 | 6.63e-02 | 0.1067 |
| 203062 | TSNARE1 | P48T-E | Human | Esophagus | ESCC | 1.05e-03 | 7.85e-02 | 0.0959 |
| Page: 1 2 |
| Tissue | Expression Dynamics | Abbreviation |
| Esophagus | 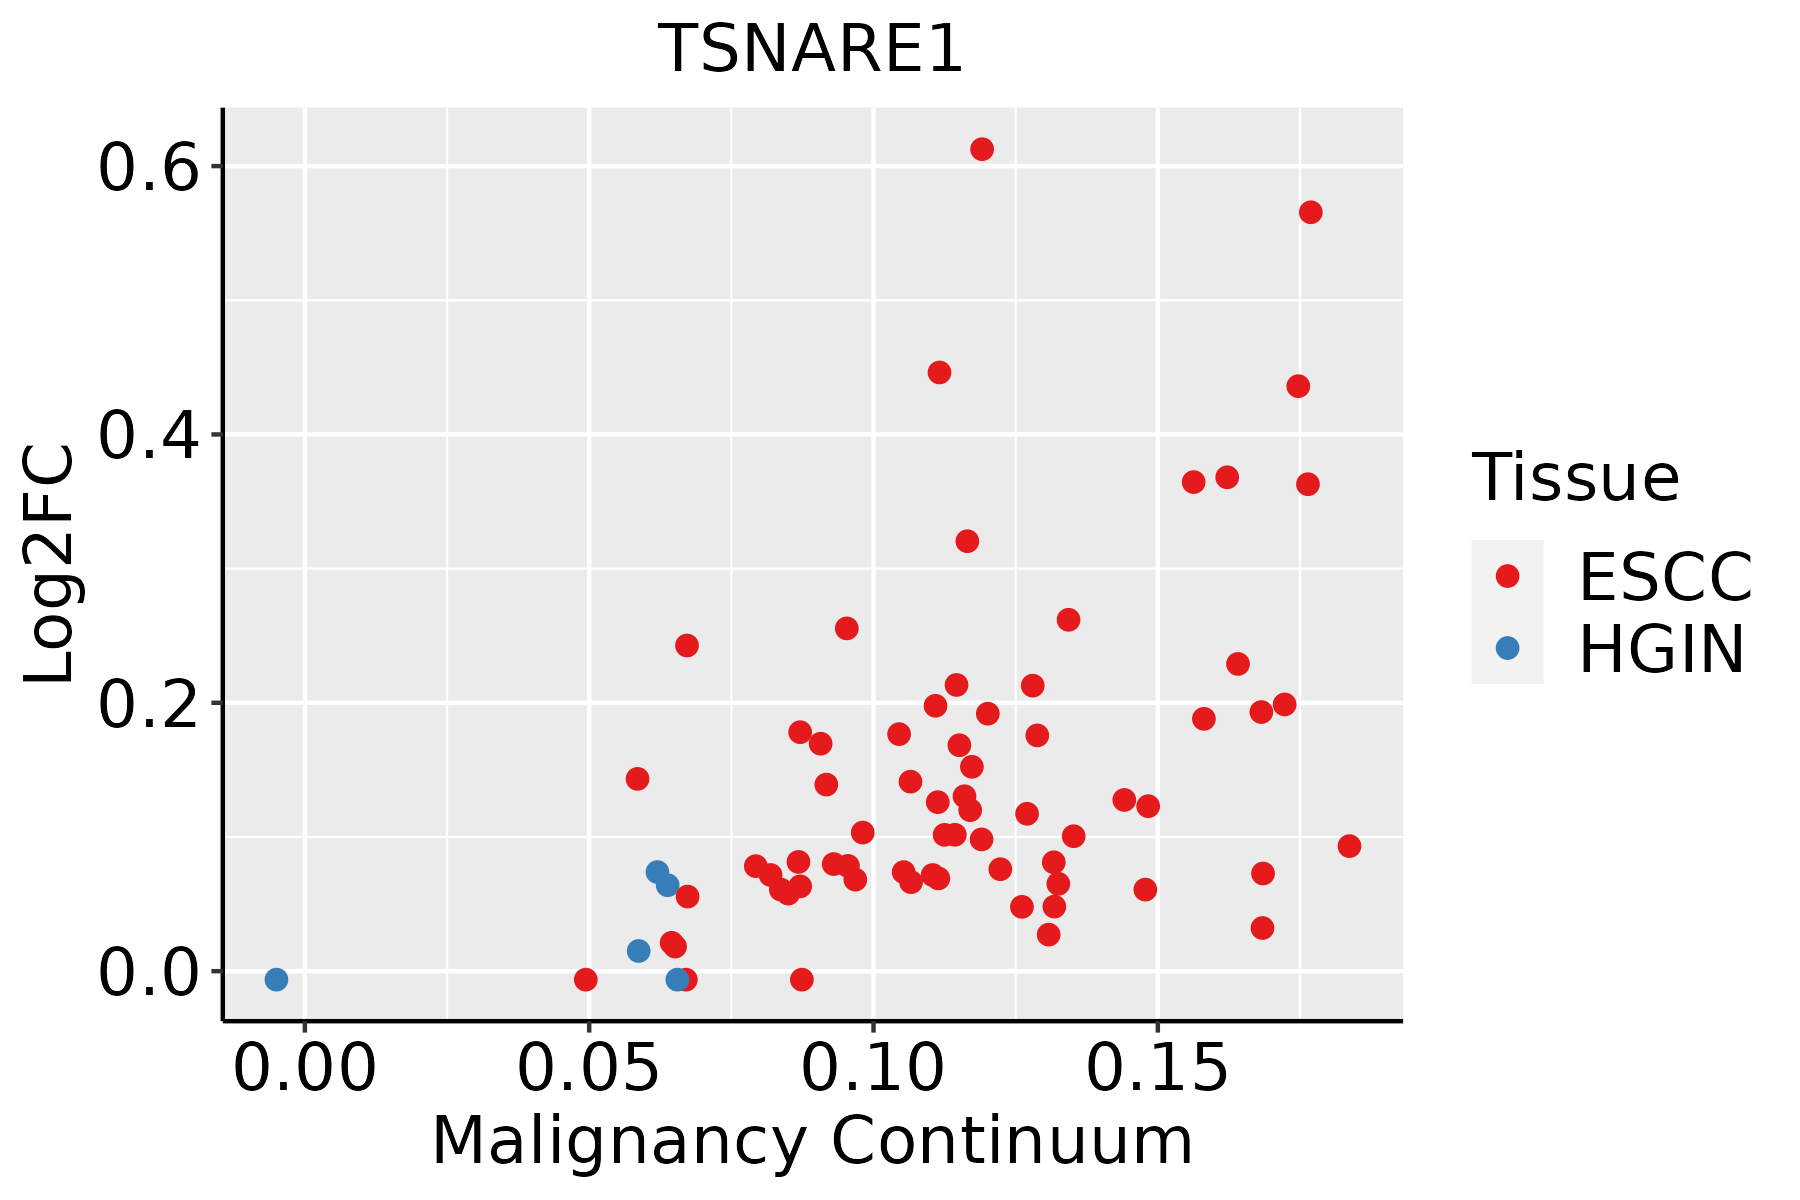 | ESCC: Esophageal squamous cell carcinoma |
| HGIN: High-grade intraepithelial neoplasias | ||
| LGIN: Low-grade intraepithelial neoplasias |
| ∗log2FC in expression of this searched gene in stem-like cells from each diseased tissue sample relative to stem-like cells in normal samples in each tissue plotted against the malignancy continuum. Samples are colored based on if they are from different disease stage. |
Top |
Malignant transformation related pathway analysis |
| Find out the enriched GO biological processes and KEGG pathways involved in transition from healthy to precancer to cancer |
| Tissue | Disease Stage | Enriched GO biological Processes |
| Colorectum | AD |  |
| Colorectum | SER |  |
| Colorectum | MSS |  |
| Colorectum | MSI-H |  |
| Colorectum | FAP |  |
| ∗Top 15 enriched GO BP terms are showed in the bar plot of each disease state in each tissue. Each row represents a significant GO biological process which is colored according to the -log10(p.adjust). |
| Page: 1 2 3 4 5 6 7 8 9 |
| GO ID | Tissue | Disease Stage | Description | Gene Ratio | Bg Ratio | pvalue | p.adjust | Count |
| GO:001605014 | Esophagus | ESCC | vesicle organization | 211/8552 | 300/18723 | 2.85e-18 | 2.87e-16 | 211 |
| GO:00482844 | Esophagus | ESCC | organelle fusion | 94/8552 | 141/18723 | 3.72e-07 | 5.16e-06 | 94 |
| GO:00224069 | Esophagus | ESCC | membrane docking | 62/8552 | 86/18723 | 5.93e-07 | 7.79e-06 | 62 |
| GO:00901743 | Esophagus | ESCC | organelle membrane fusion | 73/8552 | 110/18723 | 9.29e-06 | 8.88e-05 | 73 |
| GO:00069063 | Esophagus | ESCC | vesicle fusion | 70/8552 | 106/18723 | 1.82e-05 | 1.60e-04 | 70 |
| GO:01400567 | Esophagus | ESCC | organelle localization by membrane tethering | 53/8552 | 77/18723 | 3.33e-05 | 2.74e-04 | 53 |
| GO:00610254 | Esophagus | ESCC | membrane fusion | 98/8552 | 163/18723 | 1.39e-04 | 9.41e-04 | 98 |
| GO:00482781 | Esophagus | ESCC | vesicle docking | 38/8552 | 59/18723 | 2.86e-03 | 1.21e-02 | 38 |
| Page: 1 |
| Pathway ID | Tissue | Disease Stage | Description | Gene Ratio | Bg Ratio | pvalue | p.adjust | qvalue | Count |
| Page: 1 |
Top |
Cell-cell communication analysis |
| Identification of potential cell-cell interactions between two cell types and their ligand-receptor pairs for different disease states |
| Ligand | Receptor | LRpair | Pathway | Tissue | Disease Stage |
| Page: 1 |
Top |
Single-cell gene regulatory network inference analysis |
| Find out the significant the regulons (TFs) and the target genes of each regulon across cell types for different disease states |
| TF | Cell Type | Tissue | Disease Stage | Target Gene | RSS | Regulon Activity |
| ∗The dot plots of a searched regulon are shown for all cell subpopulations in each disease state of each tissue based on the regulon specific score inferred using pySCENIC and by calculating the average expression. |
| Page: 1 |
Top |
Somatic mutation of malignant transformation related genes |
| Annotation of somatic variants for genes involved in malignant transformation |
| Hugo Symbol | Variant Class | Variant Classification | dbSNP RS | HGVSc | HGVSp | HGVSp Short | SWISSPROT | BIOTYPE | SIFT | PolyPhen | Tumor Sample Barcode | Tissue | Histology | Sex | Age | Stage | Therapy Types | Drugs | Outcome |
| TSNARE1 | SNV | Missense_Mutation | rs752925283 | c.65C>T | p.Ser22Leu | p.S22L | Q96NA8 | protein_coding | deleterious_low_confidence(0.03) | benign(0.147) | TCGA-A1-A0SM-01 | Breast | breast invasive carcinoma | Male | >=65 | I/II | Unknown | Unknown | SD |
| TSNARE1 | SNV | Missense_Mutation | c.1430N>A | p.Gly477Glu | p.G477E | Q96NA8 | protein_coding | tolerated(0.22) | possibly_damaging(0.677) | TCGA-A2-A04N-01 | Breast | breast invasive carcinoma | Female | >=65 | I/II | Chemotherapy | cytoxan | SD | |
| TSNARE1 | SNV | Missense_Mutation | novel | c.1004A>G | p.Glu335Gly | p.E335G | Q96NA8 | protein_coding | deleterious(0.02) | possibly_damaging(0.868) | TCGA-AC-A62X-01 | Breast | breast invasive carcinoma | Female | >=65 | I/II | Unknown | Unknown | SD |
| TSNARE1 | SNV | Missense_Mutation | rs555325950 | c.475C>T | p.Arg159Cys | p.R159C | Q96NA8 | protein_coding | tolerated_low_confidence(0.07) | benign(0.009) | TCGA-BH-A0E2-01 | Breast | breast invasive carcinoma | Female | <65 | III/IV | Chemotherapy | doxorubicin | SD |
| TSNARE1 | SNV | Missense_Mutation | c.1406N>C | p.Glu469Ala | p.E469A | Q96NA8 | protein_coding | tolerated(0.09) | benign(0.255) | TCGA-E2-A159-01 | Breast | breast invasive carcinoma | Female | <65 | I/II | Chemotherapy | cyclophosphamide | SD | |
| TSNARE1 | SNV | Missense_Mutation | c.743N>C | p.Arg248Thr | p.R248T | Q96NA8 | protein_coding | tolerated(0.22) | benign(0.012) | TCGA-C5-A3HE-01 | Cervix | cervical & endocervical cancer | Female | <65 | I/II | Unknown | Unknown | PD | |
| TSNARE1 | SNV | Missense_Mutation | novel | c.365N>G | p.Lys122Arg | p.K122R | Q96NA8 | protein_coding | tolerated_low_confidence(0.07) | benign(0.043) | TCGA-EA-A1QS-01 | Cervix | cervical & endocervical cancer | Female | <65 | I/II | Unknown | Unknown | SD |
| TSNARE1 | SNV | Missense_Mutation | c.170N>C | p.Val57Ala | p.V57A | Q96NA8 | protein_coding | deleterious_low_confidence(0.02) | benign(0.029) | TCGA-AA-3672-01 | Colorectum | colon adenocarcinoma | Female | >=65 | III/IV | Unknown | Unknown | SD | |
| TSNARE1 | SNV | Missense_Mutation | rs769143604 | c.341N>T | p.Ala114Val | p.A114V | Q96NA8 | protein_coding | tolerated_low_confidence(0.26) | benign(0.368) | TCGA-AA-3947-01 | Colorectum | colon adenocarcinoma | Female | <65 | I/II | Unknown | Unknown | SD |
| TSNARE1 | SNV | Missense_Mutation | c.169G>A | p.Val57Met | p.V57M | Q96NA8 | protein_coding | tolerated_low_confidence(0.06) | possibly_damaging(0.56) | TCGA-CM-6168-01 | Colorectum | colon adenocarcinoma | Female | >=65 | I/II | Unknown | Unknown | SD |
| Page: 1 2 3 4 5 6 |
Top |
Related drugs of malignant transformation related genes |
| Identification of chemicals and drugs interact with genes involved in malignant transfromation |
| (DGIdb 4.0) |
| Entrez ID | Symbol | Category | Interaction Types | Drug Claim Name | Drug Name | PMIDs |
| Page: 1 |

Copyright 2023-Present -The University of Texas Health Science Center at Houston |