Schematic overview of the cellular and molecular mechanisms involved in the cancer progression, including the proposed cellular and molecular mechanisms in cancer cells trajectory. AT1: alveolar type 1 cells; AT2: alveolar type 2 cells; AAH: atypical adenomatous hyperplasia; AIS: adenocarcinoma in situ; MIA: minimally invasive adenocarcinoma; IA: invasive adenocarcinoma; EMT: epithelial-mesenchymal transition

Home

Download

Statistics

Help

Contact

Center for Computational Systems Medicine
leaf

Gene summary

leaf

Malignant transformation analysis

leaf

Malignant transformation related pathway analysis

leaf

Cell-cell communication analysis

leaf

Single-cell gene regulatory network inference analysis

leaf

Somatic mutation of malignant transformation related genes

leaf

Related drugs of malignant transformation related genes

Gene: TSN

Gene summary for TSN

check button Gene summary.

Gene informationSpeciesHuman
Gene symbol

TSN

Gene ID

7247

Gene nametranslin
Gene AliasBCLF-1
Cytomap2q14.3
Gene Typeprotein-coding
GO ID

GO:0006139

UniProtAcc

B3KRM8


Top

Malignant transformation analysis

check button Identification of the aberrant gene expression in precancerous and cancerous lesions by comparing the gene expression of stem-like cells in diseased tissues with normal stem cells
check button Malignant transformation involving gene list.
Entrez IDSymbolReplicatesSpeciesOrganTissueAdj P-valueLog2FCMalignancy
7247TSNLZE2THumanEsophagusESCC1.59e-066.31e-010.082
7247TSNLZE4THumanEsophagusESCC2.82e-155.49e-010.0811
7247TSNLZE5THumanEsophagusESCC4.63e-022.43e-010.0514
7247TSNLZE7THumanEsophagusESCC8.07e-118.11e-010.0667
7247TSNLZE8THumanEsophagusESCC2.49e-052.78e-010.067
7247TSNLZE20THumanEsophagusESCC3.48e-031.95e-010.0662
7247TSNLZE22D1HumanEsophagusHGIN7.11e-039.13e-020.0595
7247TSNLZE22THumanEsophagusESCC4.76e-035.49e-010.068
7247TSNLZE24THumanEsophagusESCC2.69e-214.09e-010.0596
7247TSNLZE21THumanEsophagusESCC5.63e-053.23e-010.0655
7247TSNLZE6THumanEsophagusESCC1.14e-143.18e-010.0845
7247TSNP1T-EHumanEsophagusESCC7.41e-092.35e-010.0875
7247TSNP2T-EHumanEsophagusESCC3.26e-325.99e-010.1177
7247TSNP4T-EHumanEsophagusESCC1.28e-378.04e-010.1323
7247TSNP5T-EHumanEsophagusESCC5.12e-285.25e-010.1327
7247TSNP8T-EHumanEsophagusESCC1.63e-294.87e-010.0889
7247TSNP9T-EHumanEsophagusESCC2.38e-102.09e-010.1131
7247TSNP10T-EHumanEsophagusESCC5.38e-661.04e+000.116
7247TSNP11T-EHumanEsophagusESCC1.67e-218.62e-010.1426
7247TSNP12T-EHumanEsophagusESCC9.28e-911.68e+000.1122
Page: 1 2 3 4 5 6 

check button Transcriptomic changes along malignancy continuum.
TissueExpression DynamicsAbbreviation
EsophagusThe image shows the transcriptomic changes along malignancy continuum.log2FC in expression of this searched gene in stem-like cells from each diseased tissue sample relative to stem-like cells in normal samples in each tissue plotted against the malignancy continuum. Samples are colored based on if they are from different disease stage.ESCC: Esophageal squamous cell carcinoma
HGIN: High-grade intraepithelial neoplasias
LGIN: Low-grade intraepithelial neoplasias
LiverThe image shows the transcriptomic changes along malignancy continuum.log2FC in expression of this searched gene in stem-like cells from each diseased tissue sample relative to stem-like cells in normal samples in each tissue plotted against the malignancy continuum. Samples are colored based on if they are from different disease stage.
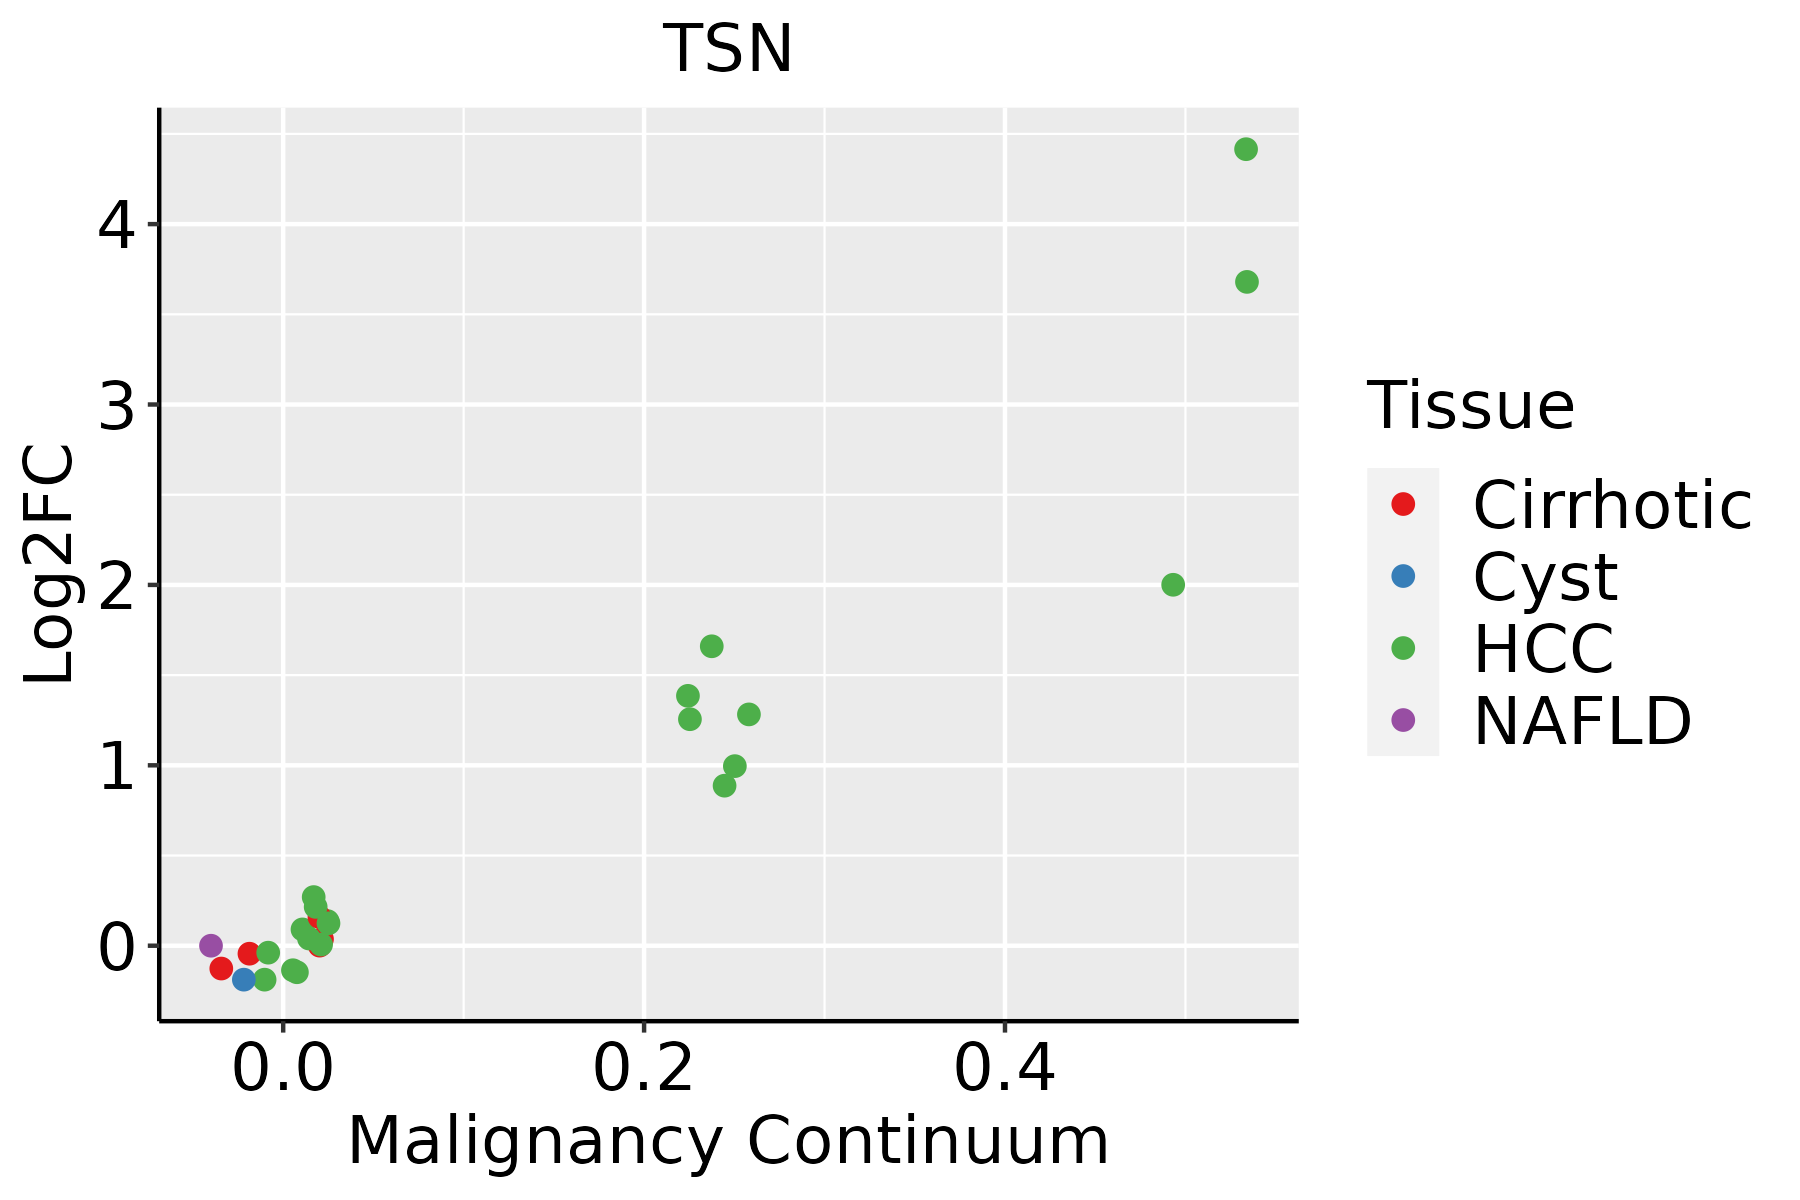
HCC: Hepatocellular carcinoma
NAFLD: Non-alcoholic fatty liver disease
Oral CavityThe image shows the transcriptomic changes along malignancy continuum.log2FC in expression of this searched gene in stem-like cells from each diseased tissue sample relative to stem-like cells in normal samples in each tissue plotted against the malignancy continuum. Samples are colored based on if they are from different disease stage.EOLP: Erosive Oral lichen planus
LP: leukoplakia
NEOLP: Non-erosive oral lichen planus
OSCC: Oral squamous cell carcinoma
SkinThe image shows the transcriptomic changes along malignancy continuum.log2FC in expression of this searched gene in stem-like cells from each diseased tissue sample relative to stem-like cells in normal samples in each tissue plotted against the malignancy continuum. Samples are colored based on if they are from different disease stage.AK: Actinic keratosis
cSCC: Cutaneous squamous cell carcinoma
SCCIS:squamous cell carcinoma in situ
ThyroidThe image shows the transcriptomic changes along malignancy continuum.log2FC in expression of this searched gene in stem-like cells from each diseased tissue sample relative to stem-like cells in normal samples in each tissue plotted against the malignancy continuum. Samples are colored based on if they are from different disease stage.
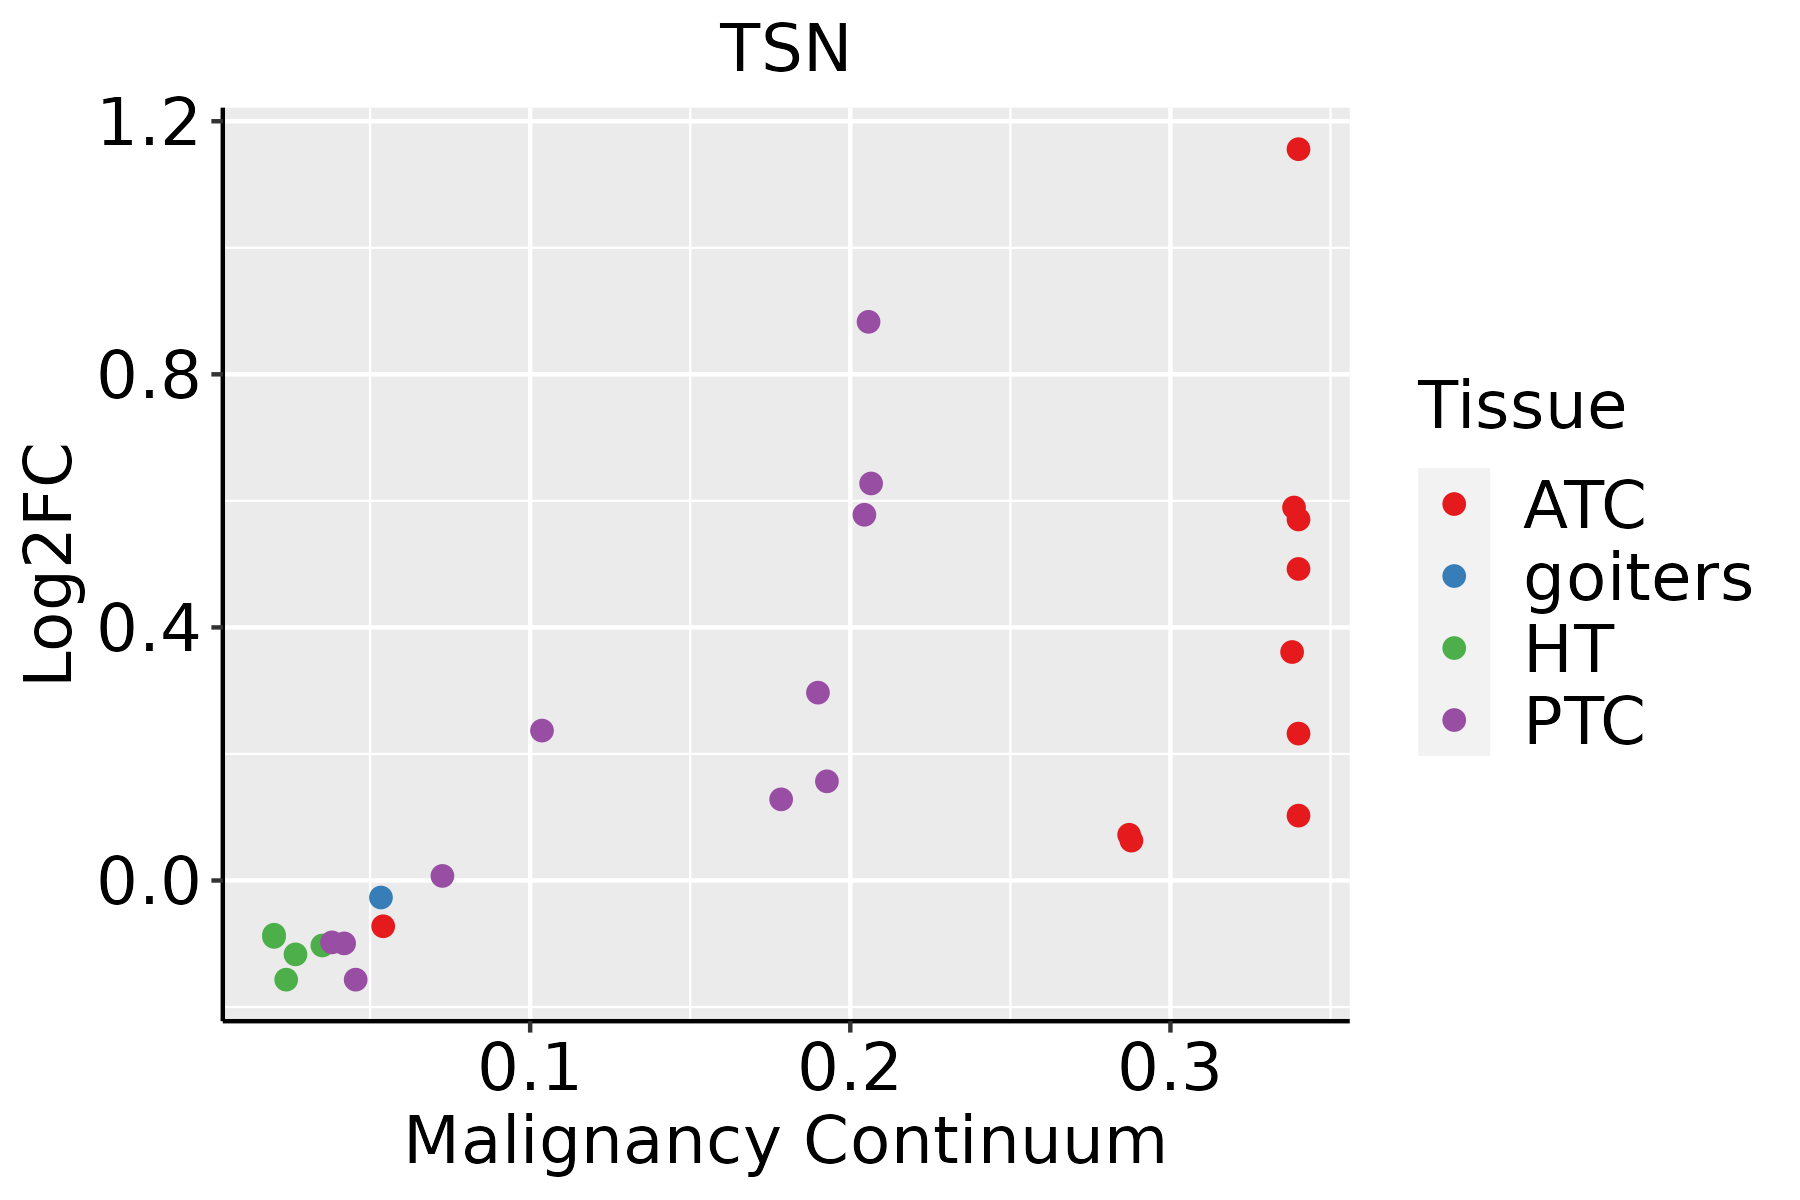
ATC: Anaplastic thyroid cancer
HT: Hashimoto's thyroiditis
PTC: Papillary thyroid cancer
∗log2FC in expression of this searched gene in stem-like cells from each diseased tissue sample relative to stem-like cells in normal samples in each tissue plotted against the malignancy continuum. Samples are colored based on if they are from different disease stage.

Top

Malignant transformation related pathway analysis

check buttonFind out the enriched GO biological processes and KEGG pathways involved in transition from healthy to precancer to cancer
check button Figure of enriched GO biological processes.
TissueDisease StageEnriched GO biological Processes
ColorectumADGO analysis - Figure of enriched GO biological processes: Top 15 enriched GO BP terms are showed in the bar plot of each disease state in each tissue. Each row represents a significant GO biological process which is colored according to the -log10(p.adjust).
ColorectumSERGO analysis - Figure of enriched GO biological processes: Top 15 enriched GO BP terms are showed in the bar plot of each disease state in each tissue. Each row represents a significant GO biological process which is colored according to the -log10(p.adjust).
ColorectumMSSGO analysis - Figure of enriched GO biological processes: Top 15 enriched GO BP terms are showed in the bar plot of each disease state in each tissue. Each row represents a significant GO biological process which is colored according to the -log10(p.adjust).
ColorectumMSI-HGO analysis - Figure of enriched GO biological processes: Top 15 enriched GO BP terms are showed in the bar plot of each disease state in each tissue. Each row represents a significant GO biological process which is colored according to the -log10(p.adjust).
ColorectumFAPGO analysis - Figure of enriched GO biological processes: Top 15 enriched GO BP terms are showed in the bar plot of each disease state in each tissue. Each row represents a significant GO biological process which is colored according to the -log10(p.adjust).
∗Top 15 enriched GO BP terms are showed in the bar plot of each disease state in each tissue. Each row represents a significant GO biological process which is colored according to the -log10(p.adjust).
Page: 1 2 3 4 5 6 7 8 9 

check button Enriched GO biological processes.
GO IDTissueDisease StageDescriptionGene RatioBg Ratiopvaluep.adjustCount
GO:002260410CervixCCregulation of cell morphogenesis84/2311309/187231.00e-124.29e-1084
GO:00510566CervixCCregulation of small GTPase mediated signal transduction75/2311302/187231.54e-091.74e-0775
GO:00163587CervixCCdendrite development58/2311243/187234.52e-071.76e-0558
GO:00160498CervixCCcell growth92/2311482/187231.16e-052.49e-0492
GO:00609965CervixCCdendritic spine development28/231199/187231.61e-053.15e-0428
GO:00068987CervixCCreceptor-mediated endocytosis53/2311244/187232.52e-054.29e-0453
GO:00301008CervixCCregulation of endocytosis47/2311211/187233.65e-055.82e-0447
GO:00458077CervixCCpositive regulation of endocytosis27/2311100/187235.55e-058.10e-0427
GO:00725836CervixCCclathrin-dependent endocytosis16/231147/187239.56e-051.25e-0316
GO:00459277CervixCCpositive regulation of growth53/2311259/187231.33e-041.64e-0353
GO:00015588CervixCCregulation of cell growth77/2311414/187231.40e-041.70e-0377
GO:00161977CervixCCendosomal transport48/2311230/187231.65e-041.97e-0348
GO:00609984CervixCCregulation of dendritic spine development18/231161/187232.84e-043.07e-0318
GO:00995322CervixCCsynaptic vesicle endosomal processing6/231110/187234.73e-044.68e-036
GO:00303077CervixCCpositive regulation of cell growth36/2311166/187234.84e-044.75e-0336
GO:00486386CervixCCregulation of developmental growth61/2311330/187237.69e-046.85e-0361
GO:00605606CervixCCdevelopmental growth involved in morphogenesis46/2311234/187238.82e-047.63e-0346
GO:19052442CervixCCregulation of modification of synaptic structure6/231113/187232.78e-031.87e-026
GO:00484883CervixCCsynaptic vesicle endocytosis16/231162/187232.87e-031.91e-0216
GO:01402383CervixCCpresynaptic endocytosis16/231162/187232.87e-031.91e-0216
Page: 1 2 3 4 5 6 7 8 9 10 11 12 13 14 15 16 17 18 19 20 21 22 23 24 

check button Enriched KEGG pathways.
Pathway IDTissueDisease StageDescriptionGene RatioBg Ratiopvaluep.adjustqvalueCount
Page: 1 

Top

Cell-cell communication analysis

check buttonIdentification of potential cell-cell interactions between two cell types and their ligand-receptor pairs for different disease states
LigandReceptorLRpairPathwayTissueDisease Stage
Page: 1 

Top

Single-cell gene regulatory network inference analysis

check buttonFind out the significant the regulons (TFs) and the target genes of each regulon across cell types for different disease states
TFCell TypeTissueDisease StageTarget GeneRSSRegulon Activity
TSNCD8TCMColorectumADCHI3L2,SPARCL1,TIPRL, etc.7.32e-02The dot plots of a searched regulon are shown for all cell subpopulations in each disease state of each tissue based on the regulon specific score inferred using pySCENIC and by calculating the average expression.
TSNMASTColorectumADJCHI3L2,SPARCL1,TIPRL, etc.9.13e-02The dot plots of a searched regulon are shown for all cell subpopulations in each disease state of each tissue based on the regulon specific score inferred using pySCENIC and by calculating the average expression.
TSNCD8TCMColorectumADJCHI3L2,SPARCL1,TIPRL, etc.3.24e-02The dot plots of a searched regulon are shown for all cell subpopulations in each disease state of each tissue based on the regulon specific score inferred using pySCENIC and by calculating the average expression.
TSNCD8TCMColorectumFAPCHI3L2,SPARCL1,TIPRL, etc.5.36e-02The dot plots of a searched regulon are shown for all cell subpopulations in each disease state of each tissue based on the regulon specific score inferred using pySCENIC and by calculating the average expression.
TSNGCColorectumMSI-HCHI3L2,SPARCL1,TIPRL, etc.7.18e-02The dot plots of a searched regulon are shown for all cell subpopulations in each disease state of each tissue based on the regulon specific score inferred using pySCENIC and by calculating the average expression.
TSNGCColorectumSERCHI3L2,SPARCL1,TIPRL, etc.3.22e-02The dot plots of a searched regulon are shown for all cell subpopulations in each disease state of each tissue based on the regulon specific score inferred using pySCENIC and by calculating the average expression.
TSNDIFFEsophagusHealthyMSMO1,NMU,RHEB, etc.1.12e-01The dot plots of a searched regulon are shown for all cell subpopulations in each disease state of each tissue based on the regulon specific score inferred using pySCENIC and by calculating the average expression.
∗The dot plots of a searched regulon are shown for all cell subpopulations in each disease state of each tissue based on the regulon specific score inferred using pySCENIC and by calculating the average expression.
Page: 1 

Top

Somatic mutation of malignant transformation related genes

check buttonAnnotation of somatic variants for genes involved in malignant transformation
Hugo SymbolVariant ClassVariant ClassificationdbSNP RSHGVScHGVSpHGVSp ShortSWISSPROTBIOTYPESIFTPolyPhenTumor Sample BarcodeTissueHistologySexAgeStageTherapy TypesDrugsOutcome
TSNinsertionIn_Frame_Insnovelc.453_453+1insTCTTTATTAp.Ser152_Arg153insLeuLeuSerp.S152_R153insLLSQ15631protein_codingTCGA-A8-A09T-01Breastbreast invasive carcinomaFemale>=65I/IIHormone TherapyanastrozoleSD
TSNSNVMissense_Mutationc.464C>Ap.Ser155Tyrp.S155YQ15631protein_codingdeleterious(0)probably_damaging(0.928)TCGA-AD-5900-01Colorectumcolon adenocarcinomaMale>=65I/IIUnknownUnknownSD
TSNSNVMissense_Mutationc.475N>Ap.Val159Metp.V159MQ15631protein_codingdeleterious(0)probably_damaging(1)TCGA-CA-6716-01Colorectumcolon adenocarcinomaMale>=65I/IIChemotherapyoxaliplatinCR
TSNSNVMissense_Mutationc.268N>Tp.His90Tyrp.H90YQ15631protein_codingdeleterious(0.01)possibly_damaging(0.895)TCGA-AP-A051-01Endometriumuterine corpus endometrioid carcinomaFemale>=65I/IIUnknownUnknownSD
TSNSNVMissense_Mutationnovelc.586N>Ap.Asp196Asnp.D196NQ15631protein_codingdeleterious(0)probably_damaging(1)TCGA-AP-A0LM-01Endometriumuterine corpus endometrioid carcinomaFemale<65III/IVChemotherapycisplatinSD
TSNSNVMissense_Mutationnovelc.634N>Ap.Leu212Ilep.L212IQ15631protein_codingtolerated(0.22)possibly_damaging(0.748)TCGA-AX-A05Z-01Endometriumuterine corpus endometrioid carcinomaFemale<65III/IVChemotherapyadriamycinSD
TSNSNVMissense_Mutationnovelc.362N>Gp.Glu121Glyp.E121GQ15631protein_codingdeleterious(0.03)possibly_damaging(0.664)TCGA-AX-A06F-01Endometriumuterine corpus endometrioid carcinomaFemale<65III/IVChemotherapycarboplatinSD
TSNSNVMissense_Mutationc.622N>Tp.Val208Leup.V208LQ15631protein_codingdeleterious(0)probably_damaging(0.953)TCGA-B5-A0JY-01Endometriumuterine corpus endometrioid carcinomaFemale<65III/IVChemotherapydoxorubicinSD
TSNSNVMissense_Mutationrs774578869c.524A>Gp.Asn175Serp.N175SQ15631protein_codingtolerated(0.67)benign(0.027)TCGA-B5-A0JZ-01Endometriumuterine corpus endometrioid carcinomaFemale<65III/IVChemotherapycarboplatinPD
TSNSNVMissense_Mutationc.34N>Ap.Gly12Serp.G12SQ15631protein_codingtolerated(0.75)benign(0.003)TCGA-B5-A11E-01Endometriumuterine corpus endometrioid carcinomaFemale<65I/IIUnknownUnknownSD
Page: 1 2 

Top

Related drugs of malignant transformation related genes

check buttonIdentification of chemicals and drugs interact with genes involved in malignant transfromation
(DGIdb 4.0)
Entrez IDSymbolCategoryInteraction TypesDrug Claim NameDrug NamePMIDs
Page: 1