
|
|||||
|
 | |
| |
| |
| |
| |
| |
|
Gene: TSKU |
Gene summary for TSKU |
| Gene information | Species | Human | Gene symbol | TSKU | Gene ID | 25987 |
| Gene name | tsukushi, small leucine rich proteoglycan | |
| Gene Alias | E2IG4 | |
| Cytomap | 11q13.5 | |
| Gene Type | protein-coding | GO ID | GO:0000902 | UniProtAcc | A0A024R5J8 |
Top |
Malignant transformation analysis |
| Identification of the aberrant gene expression in precancerous and cancerous lesions by comparing the gene expression of stem-like cells in diseased tissues with normal stem cells |
| Entrez ID | Symbol | Replicates | Species | Organ | Tissue | Adj P-value | Log2FC | Malignancy |
| 25987 | TSKU | HTA11_2487_2000001011 | Human | Colorectum | SER | 2.68e-06 | 3.32e-01 | -0.1808 |
| 25987 | TSKU | HTA11_1938_2000001011 | Human | Colorectum | AD | 4.93e-04 | 2.47e-01 | -0.0811 |
| 25987 | TSKU | HTA11_347_2000001011 | Human | Colorectum | AD | 8.41e-05 | 1.47e-01 | -0.1954 |
| 25987 | TSKU | HTA11_696_2000001011 | Human | Colorectum | AD | 3.19e-02 | 1.54e-01 | -0.1464 |
| 25987 | TSKU | HTA11_1391_2000001011 | Human | Colorectum | AD | 3.04e-09 | 3.26e-01 | -0.059 |
| 25987 | TSKU | HTA11_5216_2000001011 | Human | Colorectum | SER | 1.11e-03 | 3.49e-01 | -0.1462 |
| 25987 | TSKU | HTA11_99999970781_79442 | Human | Colorectum | MSS | 3.09e-02 | 1.31e-01 | 0.294 |
| 25987 | TSKU | HTA11_99999971662_82457 | Human | Colorectum | MSS | 6.88e-07 | 2.72e-01 | 0.3859 |
| 25987 | TSKU | LZE2T | Human | Esophagus | ESCC | 7.61e-05 | 8.68e-01 | 0.082 |
| 25987 | TSKU | LZE4T | Human | Esophagus | ESCC | 1.55e-03 | 1.10e-01 | 0.0811 |
| 25987 | TSKU | LZE8T | Human | Esophagus | ESCC | 1.60e-02 | 4.60e-02 | 0.067 |
| 25987 | TSKU | LZE20T | Human | Esophagus | ESCC | 7.39e-04 | 6.50e-02 | 0.0662 |
| 25987 | TSKU | LZE24T | Human | Esophagus | ESCC | 1.49e-05 | 4.55e-02 | 0.0596 |
| 25987 | TSKU | P2T-E | Human | Esophagus | ESCC | 1.32e-80 | 1.29e+00 | 0.1177 |
| 25987 | TSKU | P4T-E | Human | Esophagus | ESCC | 8.04e-27 | 8.41e-01 | 0.1323 |
| 25987 | TSKU | P5T-E | Human | Esophagus | ESCC | 3.97e-15 | 3.50e-01 | 0.1327 |
| 25987 | TSKU | P8T-E | Human | Esophagus | ESCC | 3.78e-13 | 2.39e-01 | 0.0889 |
| 25987 | TSKU | P9T-E | Human | Esophagus | ESCC | 2.01e-23 | 7.31e-01 | 0.1131 |
| 25987 | TSKU | P10T-E | Human | Esophagus | ESCC | 1.19e-35 | 5.65e-01 | 0.116 |
| 25987 | TSKU | P11T-E | Human | Esophagus | ESCC | 3.68e-10 | 9.67e-01 | 0.1426 |
| Page: 1 2 3 4 5 6 |
| Tissue | Expression Dynamics | Abbreviation |
| Colorectum (GSE201348) |  | FAP: Familial adenomatous polyposis |
| CRC: Colorectal cancer | ||
| Colorectum (HTA11) |  | AD: Adenomas |
| SER: Sessile serrated lesions | ||
| MSI-H: Microsatellite-high colorectal cancer | ||
| MSS: Microsatellite stable colorectal cancer | ||
| Esophagus | 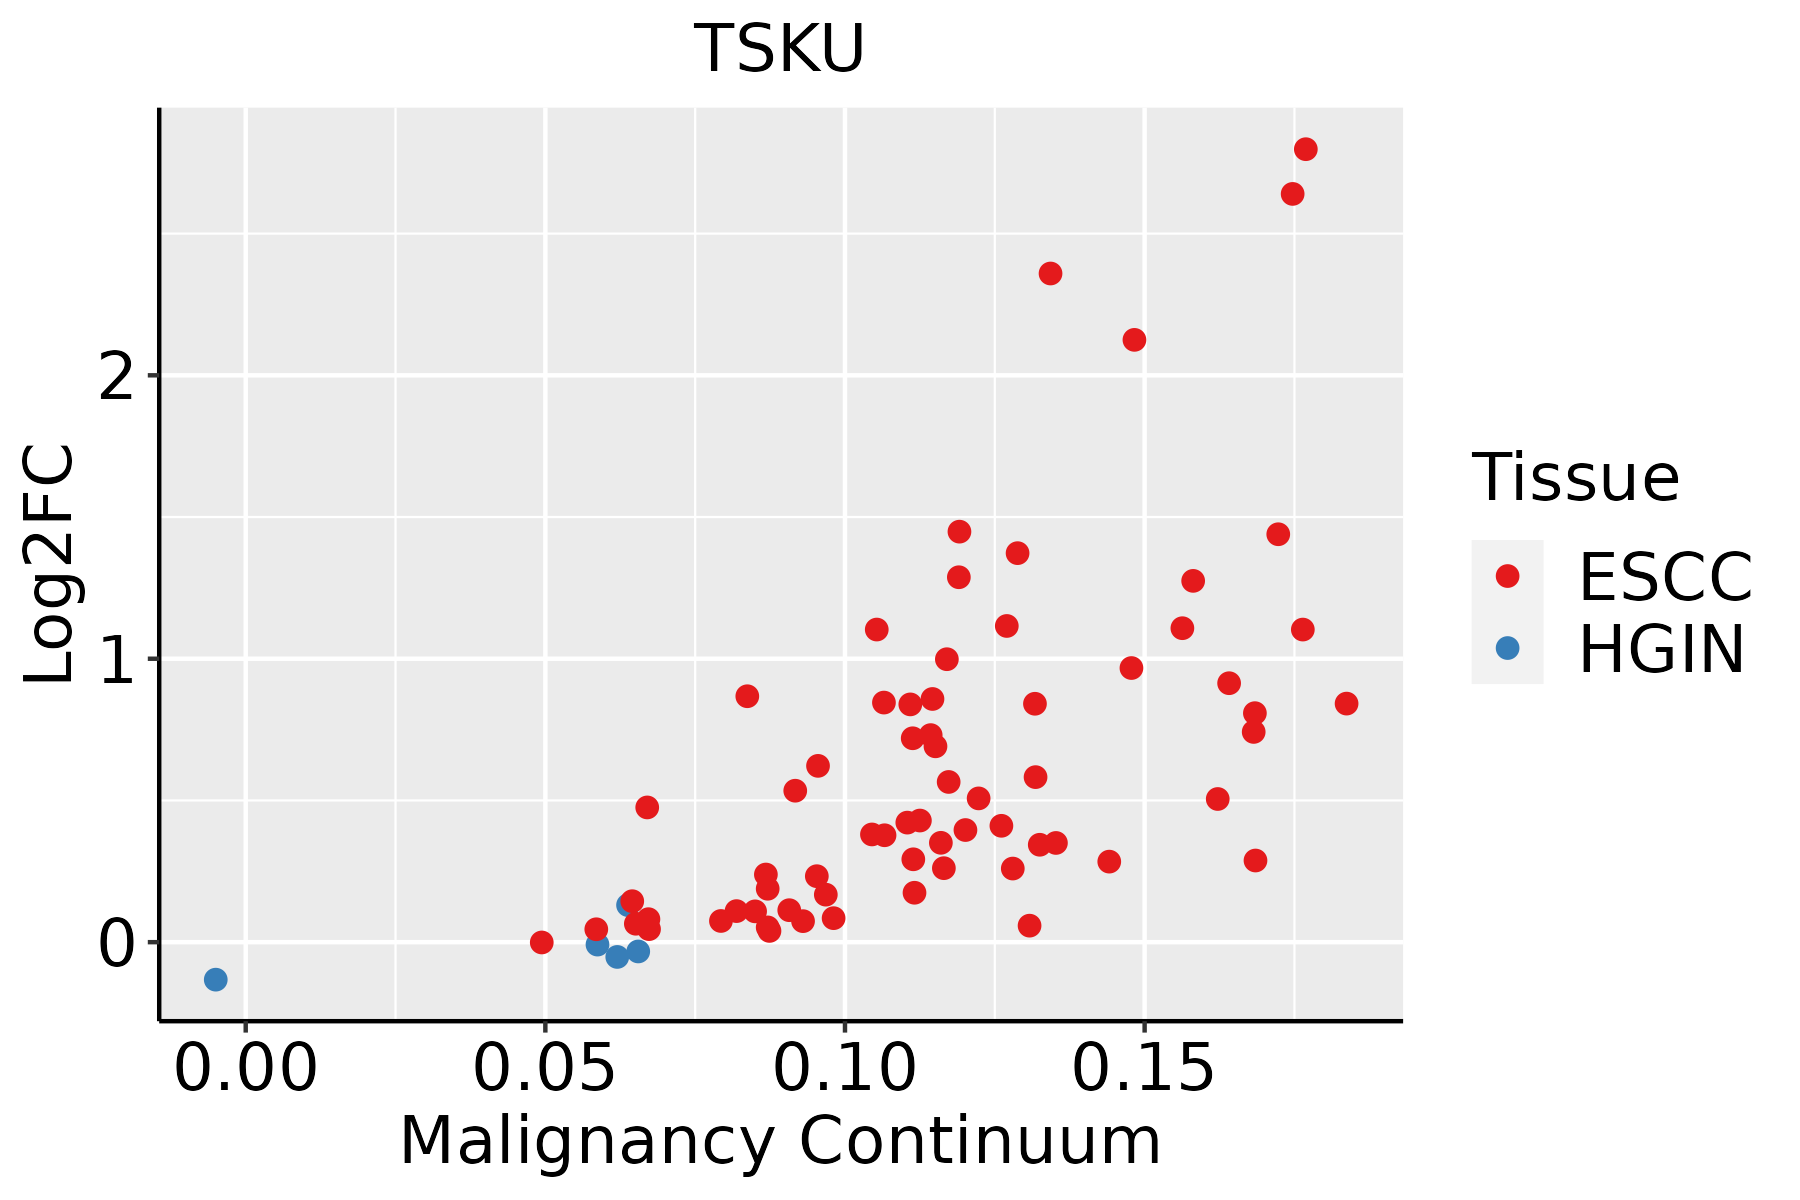 | ESCC: Esophageal squamous cell carcinoma |
| HGIN: High-grade intraepithelial neoplasias | ||
| LGIN: Low-grade intraepithelial neoplasias | ||
| Liver |  | HCC: Hepatocellular carcinoma |
| NAFLD: Non-alcoholic fatty liver disease | ||
| Oral Cavity | 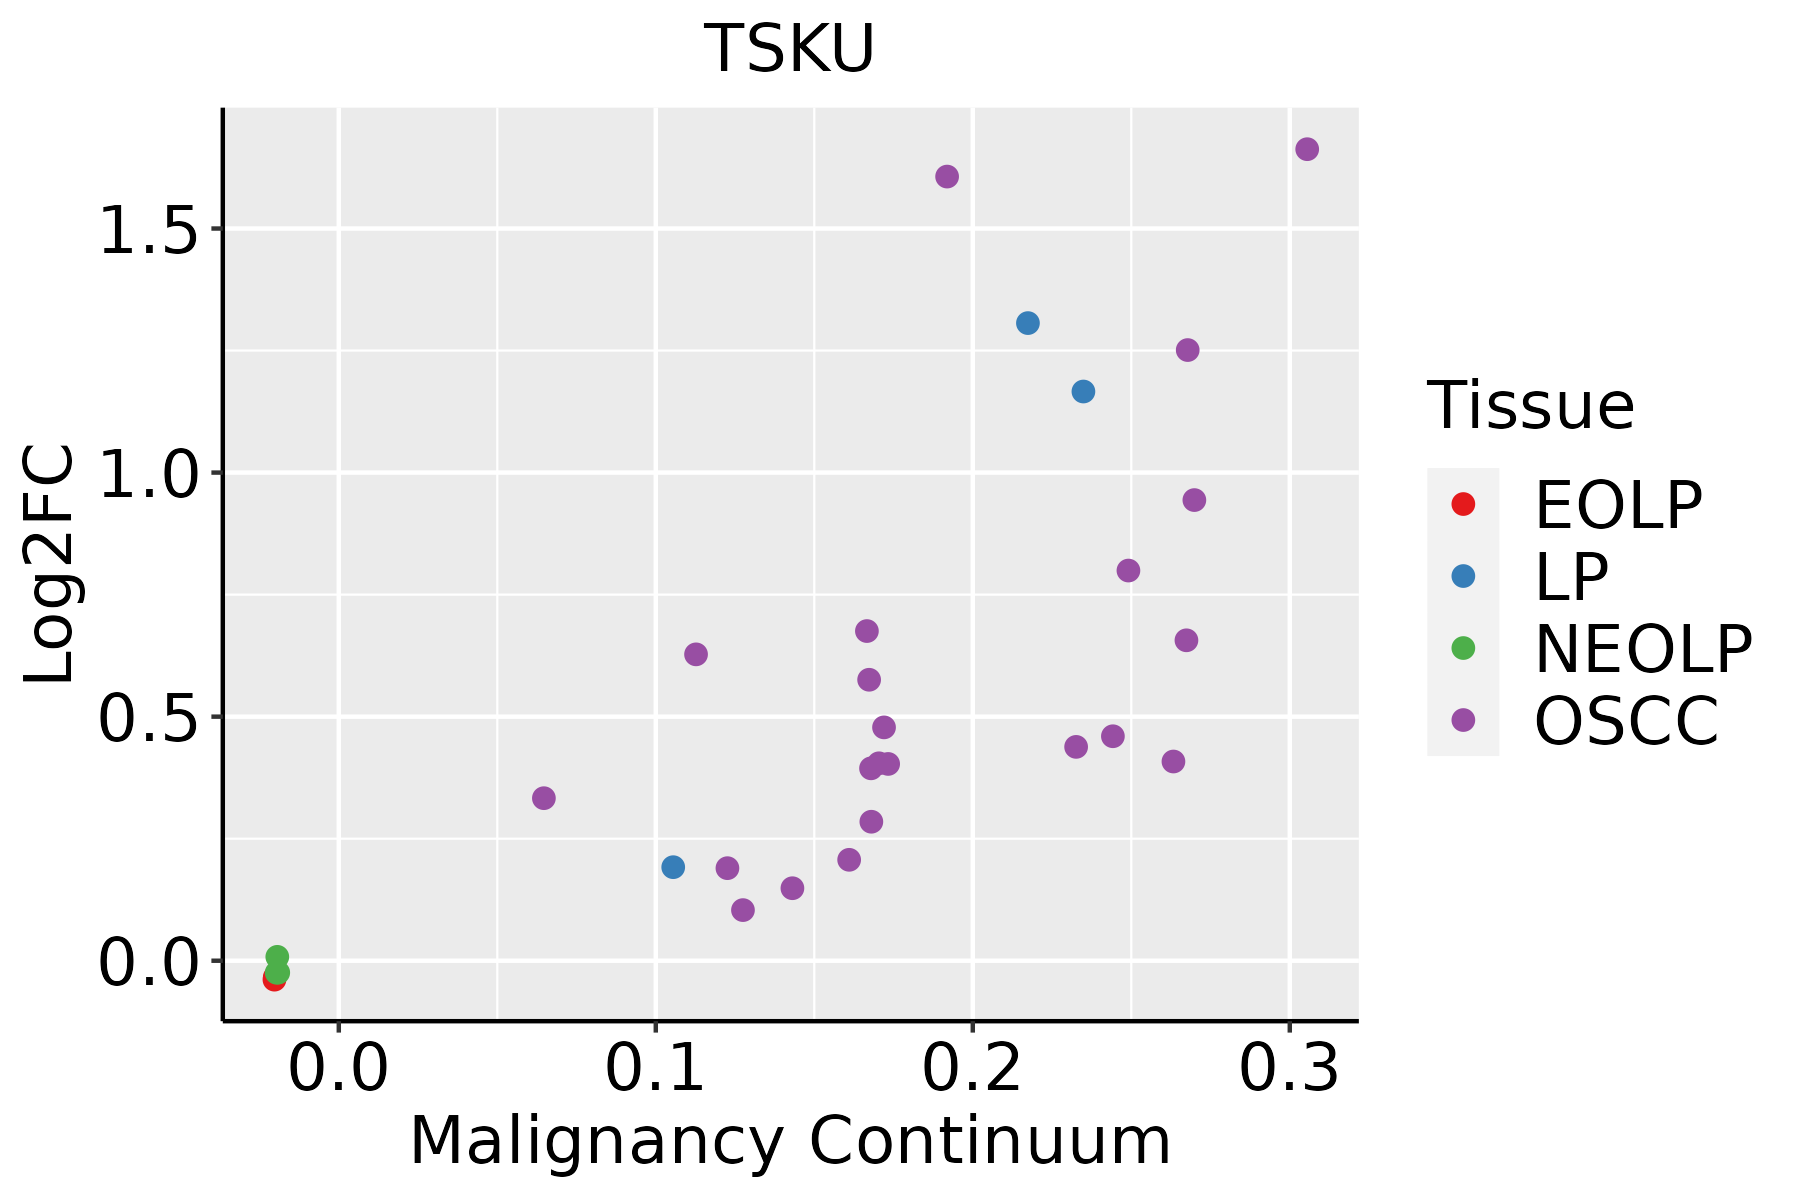 | EOLP: Erosive Oral lichen planus |
| LP: leukoplakia | ||
| NEOLP: Non-erosive oral lichen planus | ||
| OSCC: Oral squamous cell carcinoma | ||
| Prostate | 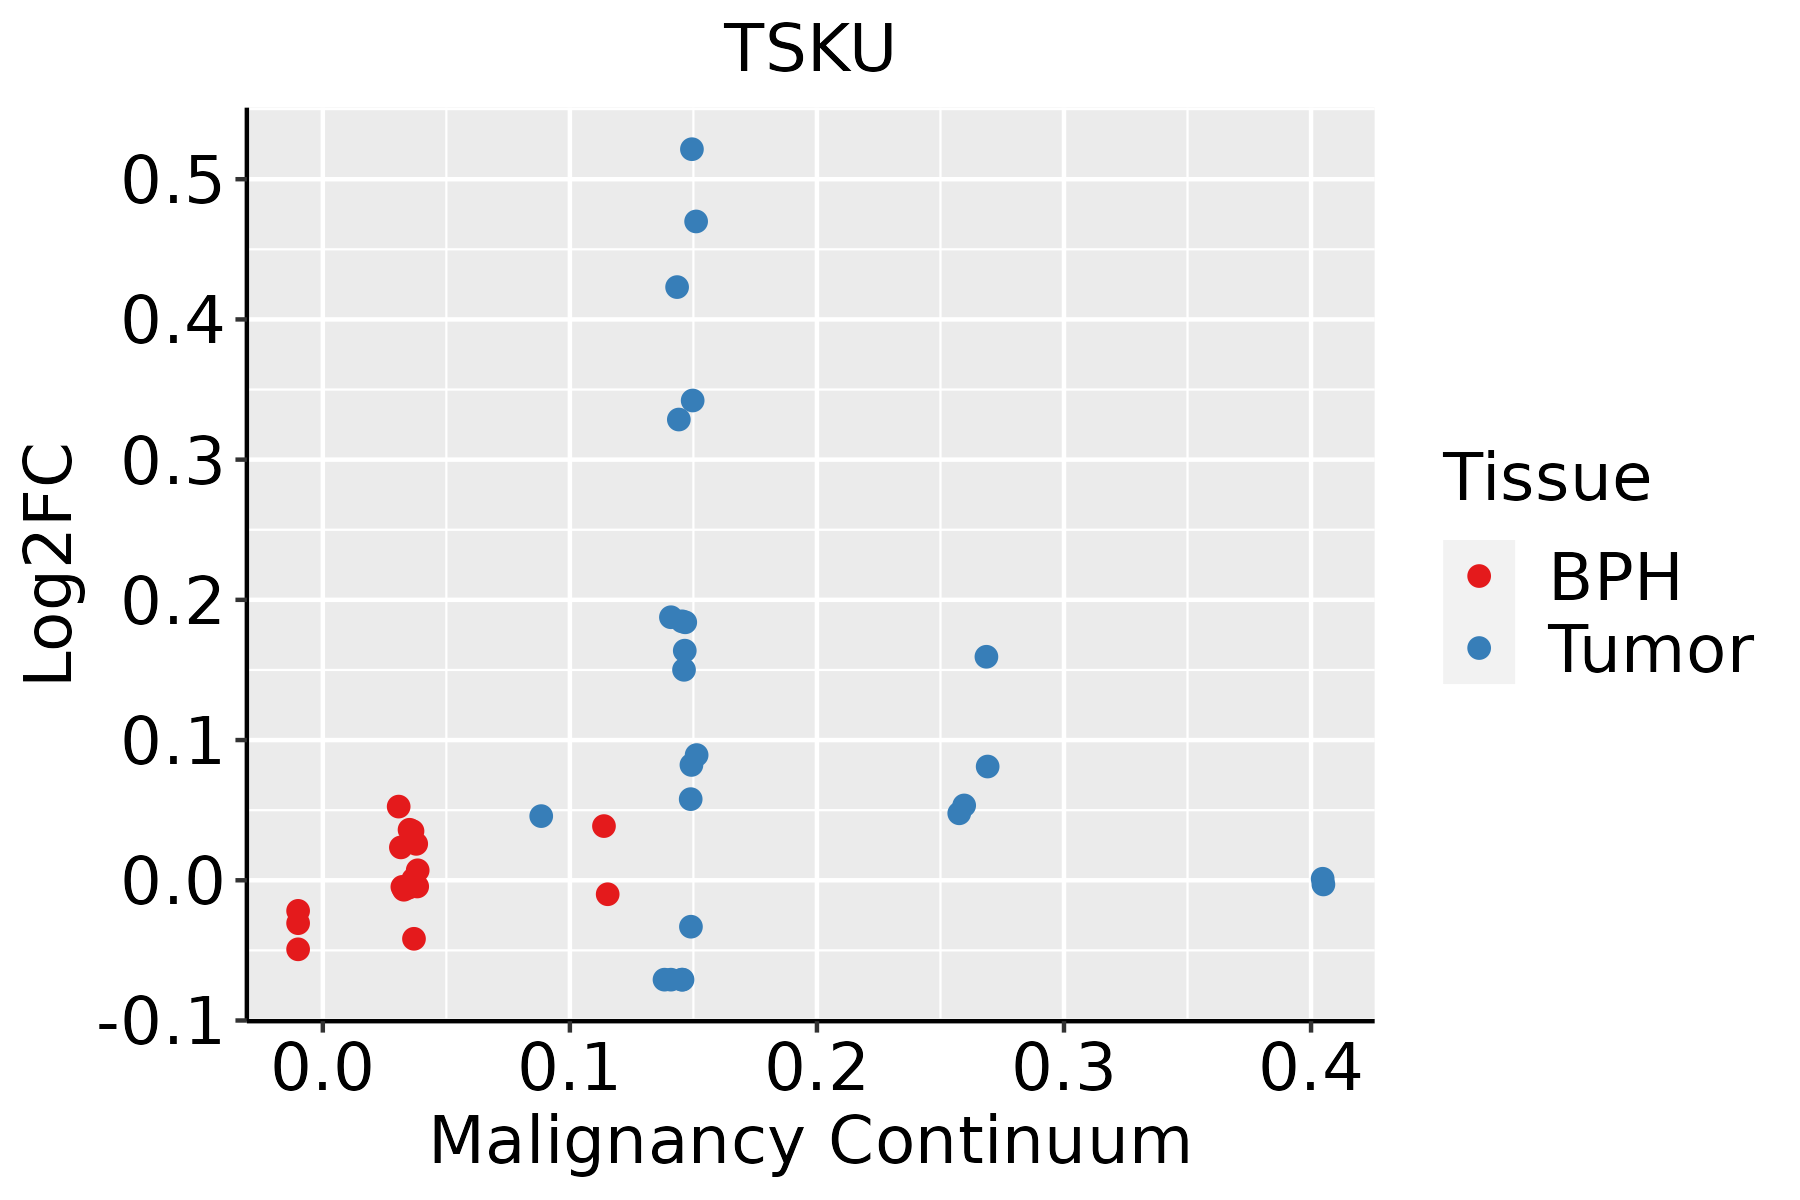 | BPH: Benign Prostatic Hyperplasia |
| Skin | 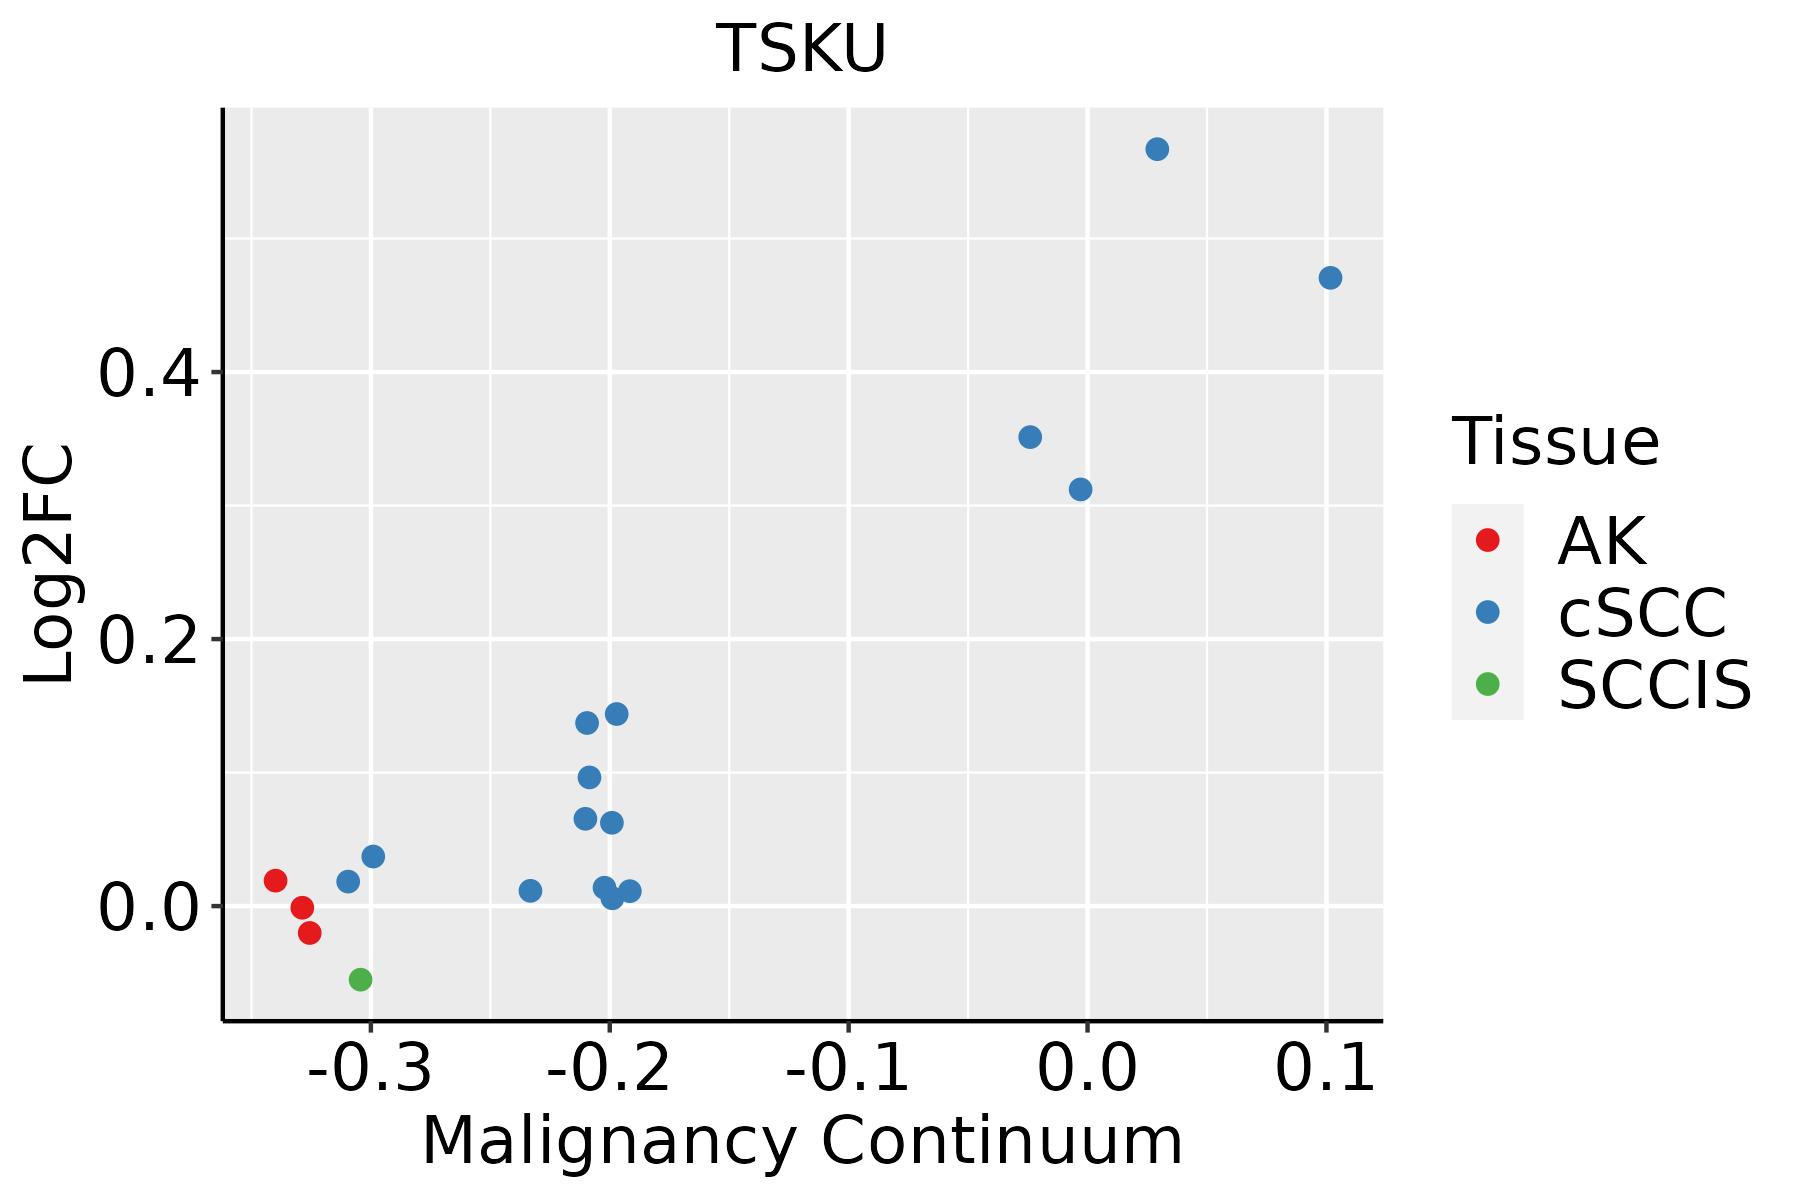 | AK: Actinic keratosis |
| cSCC: Cutaneous squamous cell carcinoma | ||
| SCCIS:squamous cell carcinoma in situ | ||
| Thyroid |  | ATC: Anaplastic thyroid cancer |
| HT: Hashimoto's thyroiditis | ||
| PTC: Papillary thyroid cancer |
| ∗log2FC in expression of this searched gene in stem-like cells from each diseased tissue sample relative to stem-like cells in normal samples in each tissue plotted against the malignancy continuum. Samples are colored based on if they are from different disease stage. |
Top |
Malignant transformation related pathway analysis |
| Find out the enriched GO biological processes and KEGG pathways involved in transition from healthy to precancer to cancer |
| Tissue | Disease Stage | Enriched GO biological Processes |
| Colorectum | AD |  |
| Colorectum | SER |  |
| Colorectum | MSS |  |
| Colorectum | MSI-H |  |
| Colorectum | FAP |  |
| ∗Top 15 enriched GO BP terms are showed in the bar plot of each disease state in each tissue. Each row represents a significant GO biological process which is colored according to the -log10(p.adjust). |
| Page: 1 2 3 4 5 6 7 8 9 |
| GO ID | Tissue | Disease Stage | Description | Gene Ratio | Bg Ratio | pvalue | p.adjust | Count |
| GO:0042060 | Colorectum | AD | wound healing | 128/3918 | 422/18723 | 2.73e-06 | 7.89e-05 | 128 |
| GO:0030111 | Colorectum | AD | regulation of Wnt signaling pathway | 102/3918 | 328/18723 | 8.51e-06 | 2.03e-04 | 102 |
| GO:0016055 | Colorectum | AD | Wnt signaling pathway | 130/3918 | 444/18723 | 1.60e-05 | 3.37e-04 | 130 |
| GO:0198738 | Colorectum | AD | cell-cell signaling by wnt | 130/3918 | 446/18723 | 2.02e-05 | 4.10e-04 | 130 |
| GO:0010975 | Colorectum | AD | regulation of neuron projection development | 129/3918 | 445/18723 | 2.88e-05 | 5.37e-04 | 129 |
| GO:0006066 | Colorectum | AD | alcohol metabolic process | 106/3918 | 353/18723 | 3.02e-05 | 5.57e-04 | 106 |
| GO:0007409 | Colorectum | AD | axonogenesis | 122/3918 | 418/18723 | 3.36e-05 | 6.15e-04 | 122 |
| GO:0061564 | Colorectum | AD | axon development | 132/3918 | 467/18723 | 8.40e-05 | 1.31e-03 | 132 |
| GO:0031345 | Colorectum | AD | negative regulation of cell projection organization | 58/3918 | 186/18723 | 6.37e-04 | 6.58e-03 | 58 |
| GO:0071635 | Colorectum | AD | negative regulation of transforming growth factor beta production | 8/3918 | 12/18723 | 7.99e-04 | 7.91e-03 | 8 |
| GO:0010876 | Colorectum | AD | lipid localization | 120/3918 | 448/18723 | 1.59e-03 | 1.33e-02 | 120 |
| GO:0006869 | Colorectum | AD | lipid transport | 108/3918 | 398/18723 | 1.67e-03 | 1.39e-02 | 108 |
| GO:0010977 | Colorectum | AD | negative regulation of neuron projection development | 43/3918 | 137/18723 | 2.60e-03 | 1.97e-02 | 43 |
| GO:0042490 | Colorectum | AD | mechanoreceptor differentiation | 24/3918 | 67/18723 | 3.48e-03 | 2.52e-02 | 24 |
| GO:0071634 | Colorectum | AD | regulation of transforming growth factor beta production | 16/3918 | 41/18723 | 6.20e-03 | 3.88e-02 | 16 |
| GO:0060119 | Colorectum | AD | inner ear receptor cell development | 17/3918 | 45/18723 | 7.10e-03 | 4.33e-02 | 17 |
| GO:0008202 | Colorectum | AD | steroid metabolic process | 85/3918 | 319/18723 | 8.07e-03 | 4.75e-02 | 85 |
| GO:00420601 | Colorectum | SER | wound healing | 97/2897 | 422/18723 | 2.69e-05 | 7.30e-04 | 97 |
| GO:00160551 | Colorectum | SER | Wnt signaling pathway | 97/2897 | 444/18723 | 2.02e-04 | 3.68e-03 | 97 |
| GO:01987381 | Colorectum | SER | cell-cell signaling by wnt | 97/2897 | 446/18723 | 2.39e-04 | 4.11e-03 | 97 |
| Page: 1 2 3 4 5 6 7 8 9 10 11 12 |
| Pathway ID | Tissue | Disease Stage | Description | Gene Ratio | Bg Ratio | pvalue | p.adjust | qvalue | Count |
| Page: 1 |
Top |
Cell-cell communication analysis |
| Identification of potential cell-cell interactions between two cell types and their ligand-receptor pairs for different disease states |
| Ligand | Receptor | LRpair | Pathway | Tissue | Disease Stage |
| Page: 1 |
Top |
Single-cell gene regulatory network inference analysis |
| Find out the significant the regulons (TFs) and the target genes of each regulon across cell types for different disease states |
| TF | Cell Type | Tissue | Disease Stage | Target Gene | RSS | Regulon Activity |
| ∗The dot plots of a searched regulon are shown for all cell subpopulations in each disease state of each tissue based on the regulon specific score inferred using pySCENIC and by calculating the average expression. |
| Page: 1 |
Top |
Somatic mutation of malignant transformation related genes |
| Annotation of somatic variants for genes involved in malignant transformation |
| Hugo Symbol | Variant Class | Variant Classification | dbSNP RS | HGVSc | HGVSp | HGVSp Short | SWISSPROT | BIOTYPE | SIFT | PolyPhen | Tumor Sample Barcode | Tissue | Histology | Sex | Age | Stage | Therapy Types | Drugs | Outcome |
| TSKU | SNV | Missense_Mutation | novel | c.1002N>T | p.Lys334Asn | p.K334N | Q8WUA8 | protein_coding | tolerated(0.13) | benign(0.219) | TCGA-EW-A3U0-01 | Breast | breast invasive carcinoma | Female | <65 | III/IV | Chemotherapy | cisplatin | CR |
| TSKU | SNV | Missense_Mutation | novel | c.686N>A | p.Gly229Glu | p.G229E | Q8WUA8 | protein_coding | tolerated(0.87) | benign(0.001) | TCGA-GM-A2DI-01 | Breast | breast invasive carcinoma | Female | <65 | I/II | Chemotherapy | taxotere | CR |
| TSKU | SNV | Missense_Mutation | rs374470717 | c.376N>A | p.Glu126Lys | p.E126K | Q8WUA8 | protein_coding | tolerated(0.38) | benign(0.003) | TCGA-HM-A4S6-01 | Cervix | cervical & endocervical cancer | Female | <65 | III/IV | Chemotherapy | cisplatin | CR |
| TSKU | SNV | Missense_Mutation | novel | c.1034C>G | p.Ser345Cys | p.S345C | Q8WUA8 | protein_coding | tolerated_low_confidence(0.06) | benign(0.237) | TCGA-ZJ-A8QR-01 | Cervix | cervical & endocervical cancer | Female | <65 | I/II | Unknown | Unknown | SD |
| TSKU | SNV | Missense_Mutation | novel | c.923T>C | p.Val308Ala | p.V308A | Q8WUA8 | protein_coding | deleterious(0) | benign(0.11) | TCGA-AA-3864-01 | Colorectum | colon adenocarcinoma | Male | >=65 | I/II | Unknown | Unknown | SD |
| TSKU | SNV | Missense_Mutation | c.205C>T | p.Arg69Trp | p.R69W | Q8WUA8 | protein_coding | deleterious(0.02) | possibly_damaging(0.729) | TCGA-AZ-4615-01 | Colorectum | colon adenocarcinoma | Male | >=65 | III/IV | Chemotherapy | xeloda | PD | |
| TSKU | SNV | Missense_Mutation | novel | c.242C>T | p.Pro81Leu | p.P81L | Q8WUA8 | protein_coding | deleterious(0) | probably_damaging(1) | TCGA-D5-6927-01 | Colorectum | colon adenocarcinoma | Male | <65 | I/II | Unknown | Unknown | SD |
| TSKU | SNV | Missense_Mutation | rs567652702 | c.944G>A | p.Arg315Gln | p.R315Q | Q8WUA8 | protein_coding | tolerated(0.5) | benign(0.003) | TCGA-AJ-A2QO-01 | Endometrium | uterine corpus endometrioid carcinoma | Female | >=65 | I/II | Unknown | Unknown | SD |
| TSKU | SNV | Missense_Mutation | novel | c.286C>T | p.Leu96Phe | p.L96F | Q8WUA8 | protein_coding | tolerated(0.19) | benign(0.039) | TCGA-AX-A06F-01 | Endometrium | uterine corpus endometrioid carcinoma | Female | <65 | III/IV | Chemotherapy | carboplatin | SD |
| TSKU | SNV | Missense_Mutation | rs753490849 | c.623N>A | p.Arg208His | p.R208H | Q8WUA8 | protein_coding | deleterious(0.03) | benign(0.139) | TCGA-B5-A3FC-01 | Endometrium | uterine corpus endometrioid carcinoma | Female | <65 | I/II | Unknown | Unknown | SD |
| Page: 1 2 3 4 5 |
Top |
Related drugs of malignant transformation related genes |
| Identification of chemicals and drugs interact with genes involved in malignant transfromation |
| (DGIdb 4.0) |
| Entrez ID | Symbol | Category | Interaction Types | Drug Claim Name | Drug Name | PMIDs |
| Page: 1 |

Copyright 2023-Present -The University of Texas Health Science Center at Houston |