
|
|||||
|
 | |
| |
| |
| |
| |
| |
|
Gene: TSFM |
Gene summary for TSFM |
| Gene information | Species | Human | Gene symbol | TSFM | Gene ID | 10102 |
| Gene name | Ts translation elongation factor, mitochondrial | |
| Gene Alias | EFTS | |
| Cytomap | 12q14.1 | |
| Gene Type | protein-coding | GO ID | GO:0006139 | UniProtAcc | P43897 |
Top |
Malignant transformation analysis |
| Identification of the aberrant gene expression in precancerous and cancerous lesions by comparing the gene expression of stem-like cells in diseased tissues with normal stem cells |
| Entrez ID | Symbol | Replicates | Species | Organ | Tissue | Adj P-value | Log2FC | Malignancy |
| 10102 | TSFM | HTA11_347_2000001011 | Human | Colorectum | AD | 6.94e-04 | 1.86e-01 | -0.1954 |
| 10102 | TSFM | HTA11_696_2000001011 | Human | Colorectum | AD | 9.70e-03 | 1.53e-01 | -0.1464 |
| 10102 | TSFM | HTA11_1391_2000001011 | Human | Colorectum | AD | 3.87e-04 | 3.17e-01 | -0.059 |
| 10102 | TSFM | HTA11_866_3004761011 | Human | Colorectum | AD | 3.76e-06 | 3.05e-01 | 0.096 |
| 10102 | TSFM | HTA11_6801_2000001011 | Human | Colorectum | SER | 1.87e-07 | 7.52e-01 | 0.0171 |
| 10102 | TSFM | HTA11_7696_3000711011 | Human | Colorectum | AD | 1.27e-08 | 3.28e-01 | 0.0674 |
| 10102 | TSFM | HTA11_99999970781_79442 | Human | Colorectum | MSS | 2.10e-07 | 3.66e-01 | 0.294 |
| 10102 | TSFM | HTA11_99999965104_69814 | Human | Colorectum | MSS | 3.00e-02 | 2.69e-01 | 0.281 |
| 10102 | TSFM | HTA11_99999971662_82457 | Human | Colorectum | MSS | 5.28e-05 | 2.88e-01 | 0.3859 |
| 10102 | TSFM | LZE2T | Human | Esophagus | ESCC | 7.70e-04 | 2.67e-01 | 0.082 |
| 10102 | TSFM | LZE4T | Human | Esophagus | ESCC | 3.28e-08 | 9.75e-02 | 0.0811 |
| 10102 | TSFM | LZE7T | Human | Esophagus | ESCC | 7.68e-08 | 3.81e-01 | 0.0667 |
| 10102 | TSFM | LZE8T | Human | Esophagus | ESCC | 2.48e-12 | 1.70e-01 | 0.067 |
| 10102 | TSFM | LZE20T | Human | Esophagus | ESCC | 2.38e-08 | 1.66e-01 | 0.0662 |
| 10102 | TSFM | LZE24T | Human | Esophagus | ESCC | 3.15e-10 | 3.14e-01 | 0.0596 |
| 10102 | TSFM | LZE6T | Human | Esophagus | ESCC | 1.02e-07 | 3.69e-01 | 0.0845 |
| 10102 | TSFM | P1T-E | Human | Esophagus | ESCC | 4.41e-08 | 2.36e-01 | 0.0875 |
| 10102 | TSFM | P2T-E | Human | Esophagus | ESCC | 1.75e-33 | 7.08e-01 | 0.1177 |
| 10102 | TSFM | P4T-E | Human | Esophagus | ESCC | 1.33e-22 | 7.12e-01 | 0.1323 |
| 10102 | TSFM | P5T-E | Human | Esophagus | ESCC | 1.68e-26 | 5.59e-01 | 0.1327 |
| Page: 1 2 3 4 5 6 7 |
| Tissue | Expression Dynamics | Abbreviation |
| Colorectum (GSE201348) |  | FAP: Familial adenomatous polyposis |
| CRC: Colorectal cancer | ||
| Colorectum (HTA11) |  | AD: Adenomas |
| SER: Sessile serrated lesions | ||
| MSI-H: Microsatellite-high colorectal cancer | ||
| MSS: Microsatellite stable colorectal cancer | ||
| Esophagus |  | ESCC: Esophageal squamous cell carcinoma |
| HGIN: High-grade intraepithelial neoplasias | ||
| LGIN: Low-grade intraepithelial neoplasias | ||
| Liver | 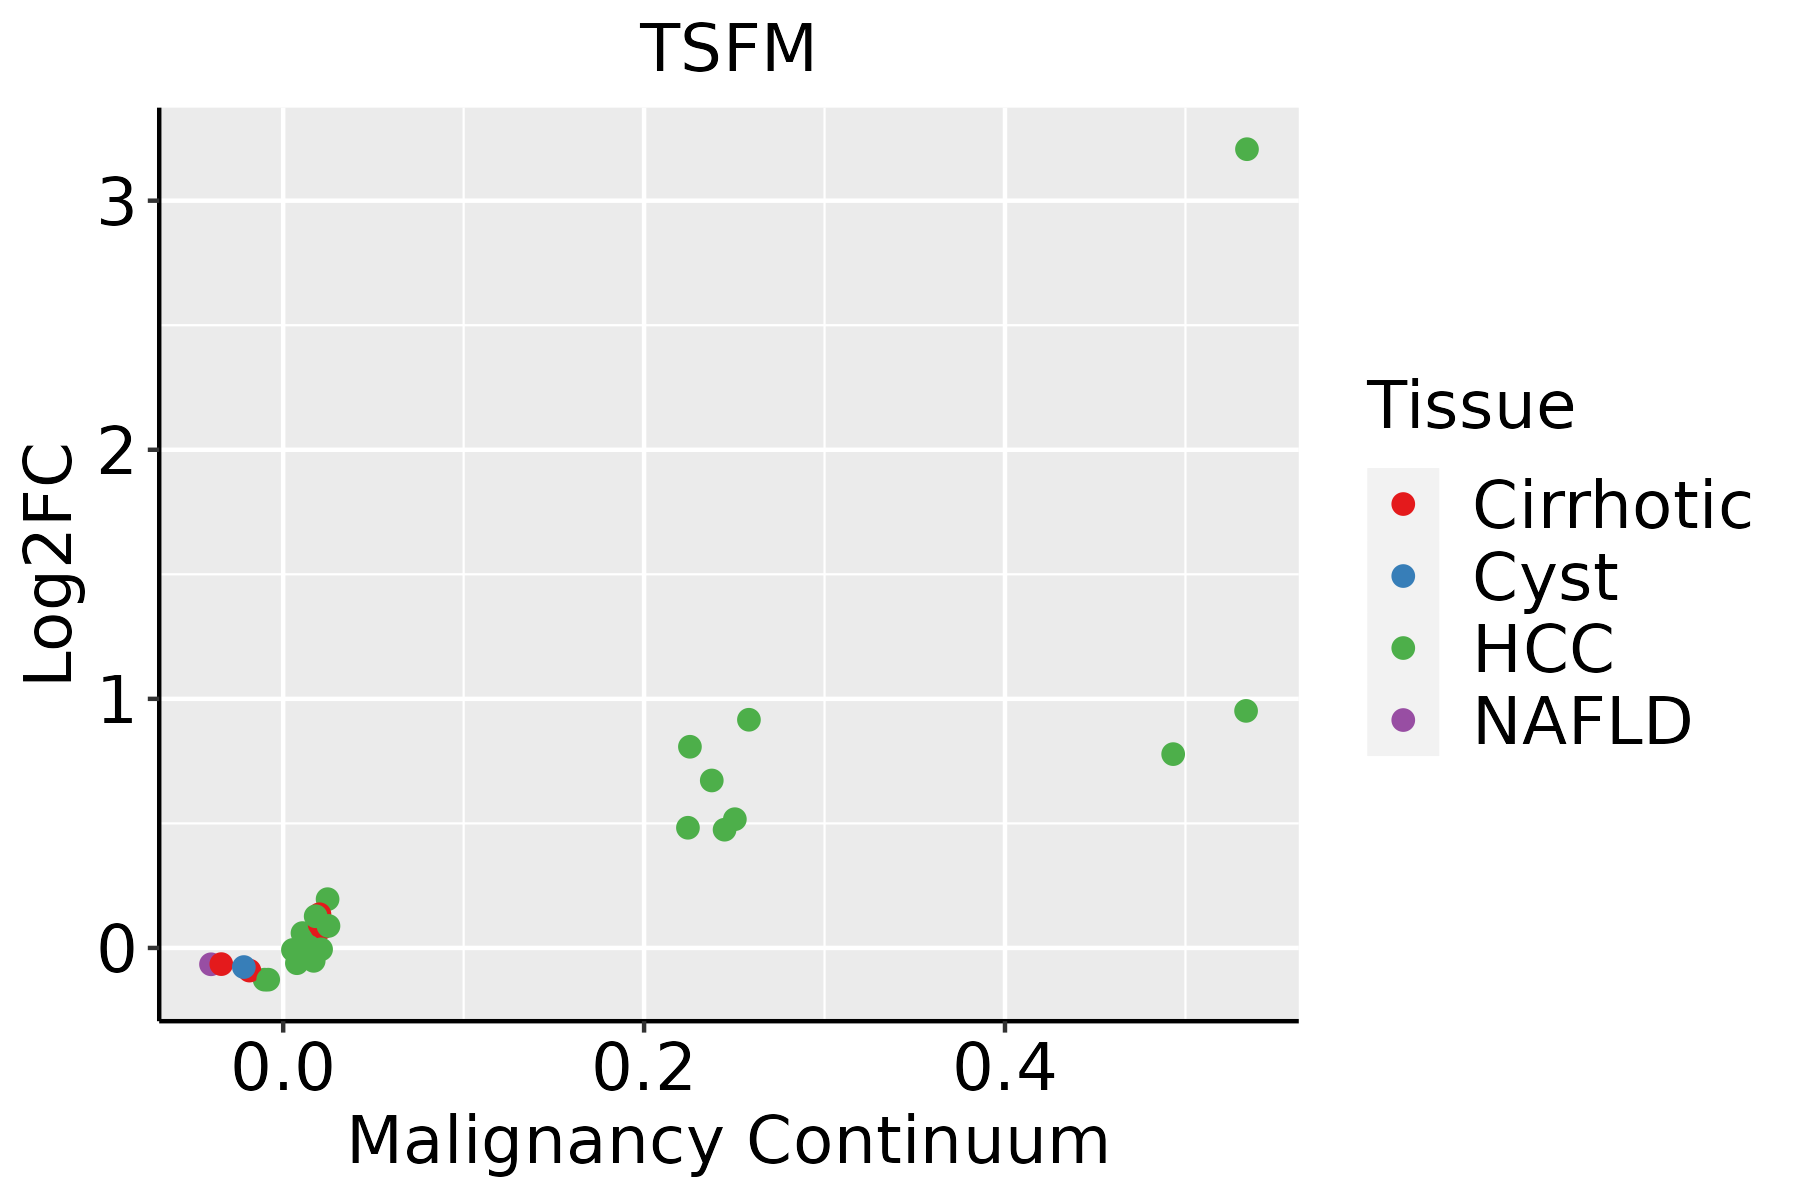 | HCC: Hepatocellular carcinoma |
| NAFLD: Non-alcoholic fatty liver disease | ||
| Oral Cavity | 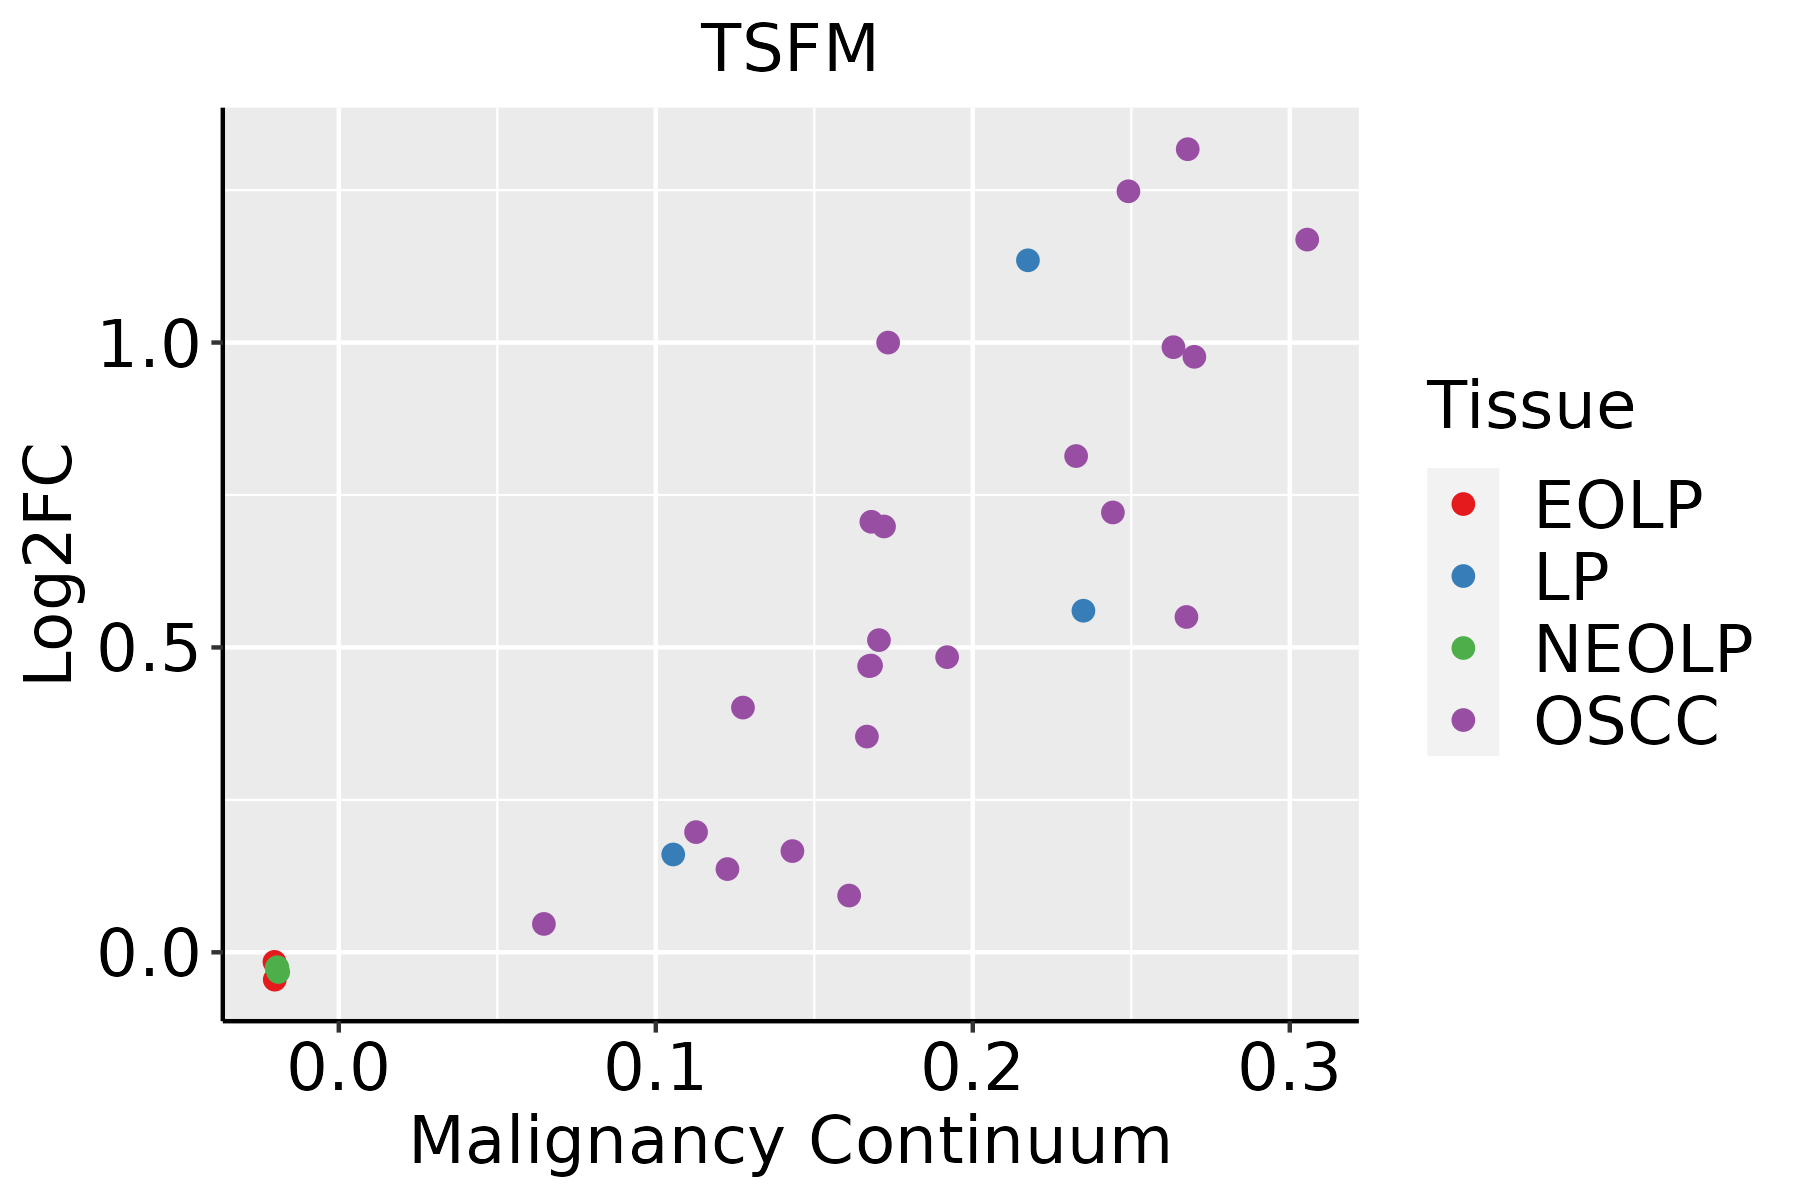 | EOLP: Erosive Oral lichen planus |
| LP: leukoplakia | ||
| NEOLP: Non-erosive oral lichen planus | ||
| OSCC: Oral squamous cell carcinoma | ||
| Skin |  | AK: Actinic keratosis |
| cSCC: Cutaneous squamous cell carcinoma | ||
| SCCIS:squamous cell carcinoma in situ | ||
| Thyroid | 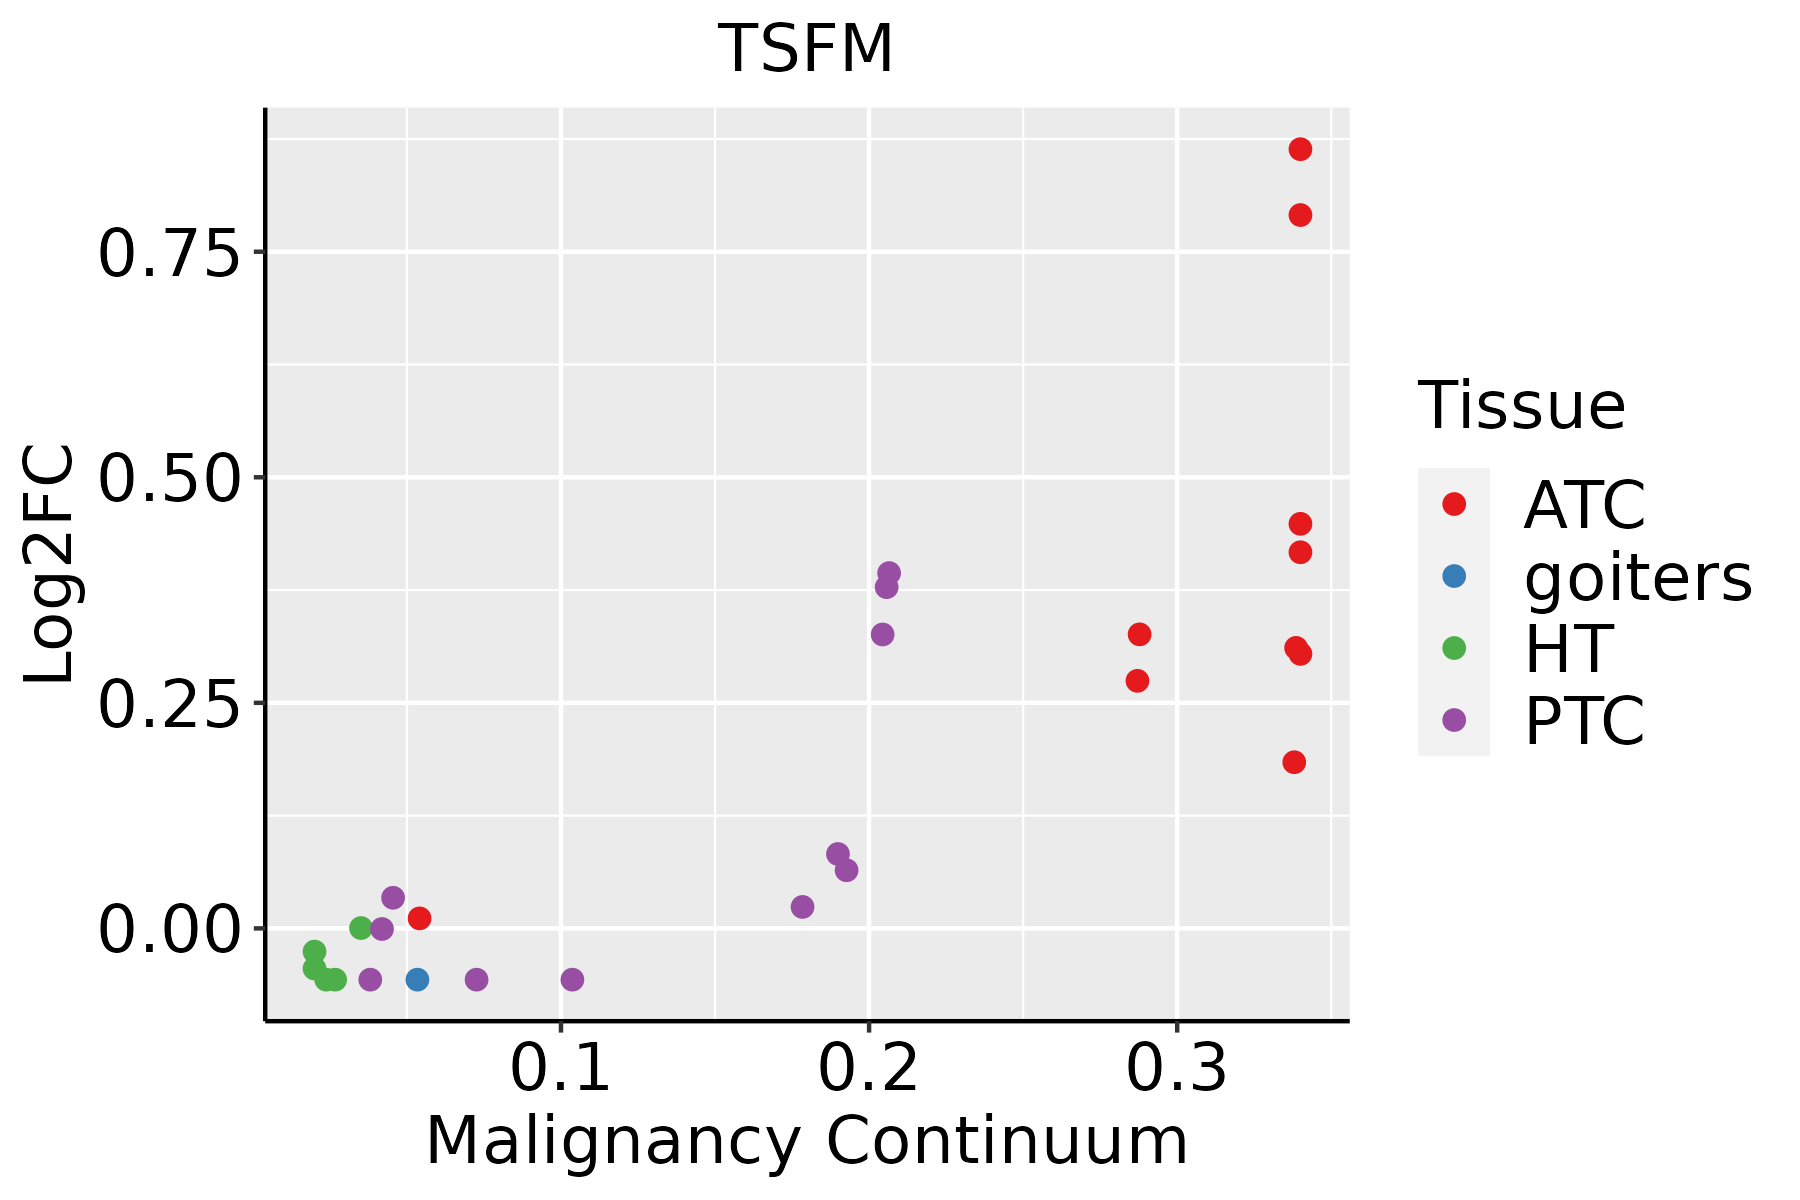 | ATC: Anaplastic thyroid cancer |
| HT: Hashimoto's thyroiditis | ||
| PTC: Papillary thyroid cancer |
| ∗log2FC in expression of this searched gene in stem-like cells from each diseased tissue sample relative to stem-like cells in normal samples in each tissue plotted against the malignancy continuum. Samples are colored based on if they are from different disease stage. |
Top |
Malignant transformation related pathway analysis |
| Find out the enriched GO biological processes and KEGG pathways involved in transition from healthy to precancer to cancer |
| Tissue | Disease Stage | Enriched GO biological Processes |
| Colorectum | AD |  |
| Colorectum | SER |  |
| Colorectum | MSS |  |
| Colorectum | MSI-H |  |
| Colorectum | FAP |  |
| ∗Top 15 enriched GO BP terms are showed in the bar plot of each disease state in each tissue. Each row represents a significant GO biological process which is colored according to the -log10(p.adjust). |
| Page: 1 2 3 4 5 6 7 8 9 |
| GO ID | Tissue | Disease Stage | Description | Gene Ratio | Bg Ratio | pvalue | p.adjust | Count |
| GO:0006417 | Colorectum | AD | regulation of translation | 141/3918 | 468/18723 | 1.32e-06 | 4.22e-05 | 141 |
| GO:0006354 | Colorectum | AD | DNA-templated transcription, elongation | 31/3918 | 91/18723 | 2.46e-03 | 1.90e-02 | 31 |
| GO:0006414 | Colorectum | AD | translational elongation | 21/3918 | 55/18723 | 2.53e-03 | 1.93e-02 | 21 |
| GO:00064171 | Colorectum | SER | regulation of translation | 100/2897 | 468/18723 | 3.76e-04 | 5.74e-03 | 100 |
| GO:00064141 | Colorectum | SER | translational elongation | 17/2897 | 55/18723 | 3.00e-03 | 2.65e-02 | 17 |
| GO:00064172 | Colorectum | MSS | regulation of translation | 134/3467 | 468/18723 | 4.43e-08 | 2.38e-06 | 134 |
| GO:00063541 | Colorectum | MSS | DNA-templated transcription, elongation | 29/3467 | 91/18723 | 1.52e-03 | 1.39e-02 | 29 |
| GO:00064142 | Colorectum | MSS | translational elongation | 19/3467 | 55/18723 | 3.47e-03 | 2.59e-02 | 19 |
| GO:014005313 | Esophagus | ESCC | mitochondrial gene expression | 93/8552 | 108/18723 | 1.96e-18 | 2.03e-16 | 93 |
| GO:0006417111 | Esophagus | ESCC | regulation of translation | 304/8552 | 468/18723 | 1.53e-17 | 1.33e-15 | 304 |
| GO:003254314 | Esophagus | ESCC | mitochondrial translation | 68/8552 | 76/18723 | 1.02e-15 | 6.86e-14 | 68 |
| GO:000635414 | Esophagus | ESCC | DNA-templated transcription, elongation | 76/8552 | 91/18723 | 8.35e-14 | 4.11e-12 | 76 |
| GO:003278412 | Esophagus | ESCC | regulation of DNA-templated transcription, elongation | 45/8552 | 53/18723 | 3.64e-09 | 7.61e-08 | 45 |
| GO:00701292 | Esophagus | ESCC | regulation of mitochondrial translation | 22/8552 | 24/18723 | 2.82e-06 | 3.21e-05 | 22 |
| GO:000641419 | Esophagus | ESCC | translational elongation | 41/8552 | 55/18723 | 1.26e-05 | 1.16e-04 | 41 |
| GO:00621252 | Esophagus | ESCC | regulation of mitochondrial gene expression | 24/8552 | 28/18723 | 1.37e-05 | 1.25e-04 | 24 |
| GO:000641712 | Liver | Cirrhotic | regulation of translation | 194/4634 | 468/18723 | 7.28e-16 | 8.79e-14 | 194 |
| GO:0032543 | Liver | Cirrhotic | mitochondrial translation | 40/4634 | 76/18723 | 1.61e-07 | 4.29e-06 | 40 |
| GO:0140053 | Liver | Cirrhotic | mitochondrial gene expression | 49/4634 | 108/18723 | 2.35e-06 | 4.31e-05 | 49 |
| GO:00063544 | Liver | Cirrhotic | DNA-templated transcription, elongation | 35/4634 | 91/18723 | 2.56e-03 | 1.53e-02 | 35 |
| Page: 1 2 3 |
| Pathway ID | Tissue | Disease Stage | Description | Gene Ratio | Bg Ratio | pvalue | p.adjust | qvalue | Count |
| Page: 1 |
Top |
Cell-cell communication analysis |
| Identification of potential cell-cell interactions between two cell types and their ligand-receptor pairs for different disease states |
| Ligand | Receptor | LRpair | Pathway | Tissue | Disease Stage |
| Page: 1 |
Top |
Single-cell gene regulatory network inference analysis |
| Find out the significant the regulons (TFs) and the target genes of each regulon across cell types for different disease states |
| TF | Cell Type | Tissue | Disease Stage | Target Gene | RSS | Regulon Activity |
| ∗The dot plots of a searched regulon are shown for all cell subpopulations in each disease state of each tissue based on the regulon specific score inferred using pySCENIC and by calculating the average expression. |
| Page: 1 |
Top |
Somatic mutation of malignant transformation related genes |
| Annotation of somatic variants for genes involved in malignant transformation |
| Hugo Symbol | Variant Class | Variant Classification | dbSNP RS | HGVSc | HGVSp | HGVSp Short | SWISSPROT | BIOTYPE | SIFT | PolyPhen | Tumor Sample Barcode | Tissue | Histology | Sex | Age | Stage | Therapy Types | Drugs | Outcome |
| TSFM | SNV | Missense_Mutation | novel | c.70N>A | p.Leu24Met | p.L24M | P43897 | protein_coding | deleterious_low_confidence(0.03) | possibly_damaging(0.584) | TCGA-AN-A046-01 | Breast | breast invasive carcinoma | Female | >=65 | I/II | Unknown | Unknown | SD |
| TSFM | SNV | Missense_Mutation | c.389N>T | p.Arg130Ile | p.R130I | P43897 | protein_coding | deleterious(0) | probably_damaging(0.994) | TCGA-AN-A046-01 | Breast | breast invasive carcinoma | Female | >=65 | I/II | Unknown | Unknown | SD | |
| TSFM | SNV | Missense_Mutation | c.145N>T | p.Leu49Phe | p.L49F | P43897 | protein_coding | tolerated(0.18) | probably_damaging(0.94) | TCGA-BH-A18H-01 | Breast | breast invasive carcinoma | Female | <65 | I/II | Chemotherapy | adriamycin | CR | |
| TSFM | SNV | Missense_Mutation | rs770248416 | c.67N>G | p.Leu23Val | p.L23V | P43897 | protein_coding | tolerated_low_confidence(0.18) | benign(0) | TCGA-C5-A8XH-01 | Cervix | cervical & endocervical cancer | Female | <65 | I/II | Unknown | Unknown | SD |
| TSFM | SNV | Missense_Mutation | c.244C>T | p.Leu82Phe | p.L82F | P43897 | protein_coding | deleterious(0) | probably_damaging(0.999) | TCGA-FU-A3HZ-01 | Cervix | cervical & endocervical cancer | Female | <65 | I/II | Chemotherapy | cisplatin | CR | |
| TSFM | SNV | Missense_Mutation | novel | c.209N>G | p.Thr70Ser | p.T70S | P43897 | protein_coding | tolerated(0.61) | benign(0.006) | TCGA-ZJ-AAXB-01 | Cervix | cervical & endocervical cancer | Female | <65 | I/II | Unknown | Unknown | SD |
| TSFM | SNV | Missense_Mutation | c.362N>C | p.Val121Ala | p.V121A | P43897 | protein_coding | deleterious(0.01) | probably_damaging(0.979) | TCGA-AA-3811-01 | Colorectum | colon adenocarcinoma | Female | >=65 | III/IV | Unknown | Unknown | PD | |
| TSFM | SNV | Missense_Mutation | novel | c.685C>T | p.Pro229Ser | p.P229S | P43897 | protein_coding | deleterious(0.03) | possibly_damaging(0.661) | TCGA-AA-3845-01 | Colorectum | colon adenocarcinoma | Female | >=65 | I/II | Unknown | Unknown | PD |
| TSFM | SNV | Missense_Mutation | novel | c.287A>G | p.Lys96Arg | p.K96R | P43897 | protein_coding | deleterious(0.04) | possibly_damaging(0.799) | TCGA-AA-3867-01 | Colorectum | colon adenocarcinoma | Male | >=65 | III/IV | Unknown | Unknown | PD |
| TSFM | SNV | Missense_Mutation | rs767624430 | c.827N>A | p.Arg276His | p.R276H | P43897 | protein_coding | tolerated(0.11) | benign(0.03) | TCGA-AZ-6601-01 | Colorectum | colon adenocarcinoma | Male | >=65 | I/II | Unknown | Unknown | PD |
| Page: 1 2 3 |
Top |
Related drugs of malignant transformation related genes |
| Identification of chemicals and drugs interact with genes involved in malignant transfromation |
| (DGIdb 4.0) |
| Entrez ID | Symbol | Category | Interaction Types | Drug Claim Name | Drug Name | PMIDs |
| Page: 1 |

Copyright 2023-Present -The University of Texas Health Science Center at Houston |