
|
|||||
|
 | |
| |
| |
| |
| |
| |
|
Gene: TSEN54 |
Gene summary for TSEN54 |
| Gene information | Species | Human | Gene symbol | TSEN54 | Gene ID | 283989 |
| Gene name | tRNA splicing endonuclease subunit 54 | |
| Gene Alias | PCH2A | |
| Cytomap | 17q25.1 | |
| Gene Type | protein-coding | GO ID | GO:0000379 | UniProtAcc | Q7Z6J9 |
Top |
Malignant transformation analysis |
| Identification of the aberrant gene expression in precancerous and cancerous lesions by comparing the gene expression of stem-like cells in diseased tissues with normal stem cells |
| Entrez ID | Symbol | Replicates | Species | Organ | Tissue | Adj P-value | Log2FC | Malignancy |
| 283989 | TSEN54 | LZE4T | Human | Esophagus | ESCC | 5.46e-07 | 1.52e-01 | 0.0811 |
| 283989 | TSEN54 | LZE7T | Human | Esophagus | ESCC | 7.37e-12 | 3.49e-01 | 0.0667 |
| 283989 | TSEN54 | LZE8T | Human | Esophagus | ESCC | 3.59e-02 | 7.09e-02 | 0.067 |
| 283989 | TSEN54 | LZE20T | Human | Esophagus | ESCC | 2.41e-02 | 1.14e-01 | 0.0662 |
| 283989 | TSEN54 | LZE22T | Human | Esophagus | ESCC | 1.13e-03 | 3.39e-01 | 0.068 |
| 283989 | TSEN54 | LZE24T | Human | Esophagus | ESCC | 8.14e-28 | 7.10e-01 | 0.0596 |
| 283989 | TSEN54 | LZE21T | Human | Esophagus | ESCC | 1.34e-04 | 2.72e-01 | 0.0655 |
| 283989 | TSEN54 | P2T-E | Human | Esophagus | ESCC | 4.81e-14 | 3.08e-01 | 0.1177 |
| 283989 | TSEN54 | P4T-E | Human | Esophagus | ESCC | 3.80e-12 | 2.72e-01 | 0.1323 |
| 283989 | TSEN54 | P5T-E | Human | Esophagus | ESCC | 2.22e-07 | 1.75e-01 | 0.1327 |
| 283989 | TSEN54 | P8T-E | Human | Esophagus | ESCC | 1.12e-58 | 1.08e+00 | 0.0889 |
| 283989 | TSEN54 | P9T-E | Human | Esophagus | ESCC | 4.24e-10 | 3.06e-01 | 0.1131 |
| 283989 | TSEN54 | P10T-E | Human | Esophagus | ESCC | 8.83e-48 | 8.10e-01 | 0.116 |
| 283989 | TSEN54 | P11T-E | Human | Esophagus | ESCC | 2.79e-10 | 5.69e-01 | 0.1426 |
| 283989 | TSEN54 | P12T-E | Human | Esophagus | ESCC | 2.46e-26 | 5.12e-01 | 0.1122 |
| 283989 | TSEN54 | P15T-E | Human | Esophagus | ESCC | 6.19e-27 | 5.79e-01 | 0.1149 |
| 283989 | TSEN54 | P16T-E | Human | Esophagus | ESCC | 5.33e-18 | 3.49e-01 | 0.1153 |
| 283989 | TSEN54 | P17T-E | Human | Esophagus | ESCC | 2.18e-07 | 2.49e-01 | 0.1278 |
| 283989 | TSEN54 | P20T-E | Human | Esophagus | ESCC | 2.58e-65 | 1.41e+00 | 0.1124 |
| 283989 | TSEN54 | P21T-E | Human | Esophagus | ESCC | 1.70e-24 | 4.80e-01 | 0.1617 |
| Page: 1 2 3 4 5 |
| Tissue | Expression Dynamics | Abbreviation |
| Esophagus |  | ESCC: Esophageal squamous cell carcinoma |
| HGIN: High-grade intraepithelial neoplasias | ||
| LGIN: Low-grade intraepithelial neoplasias | ||
| Liver | 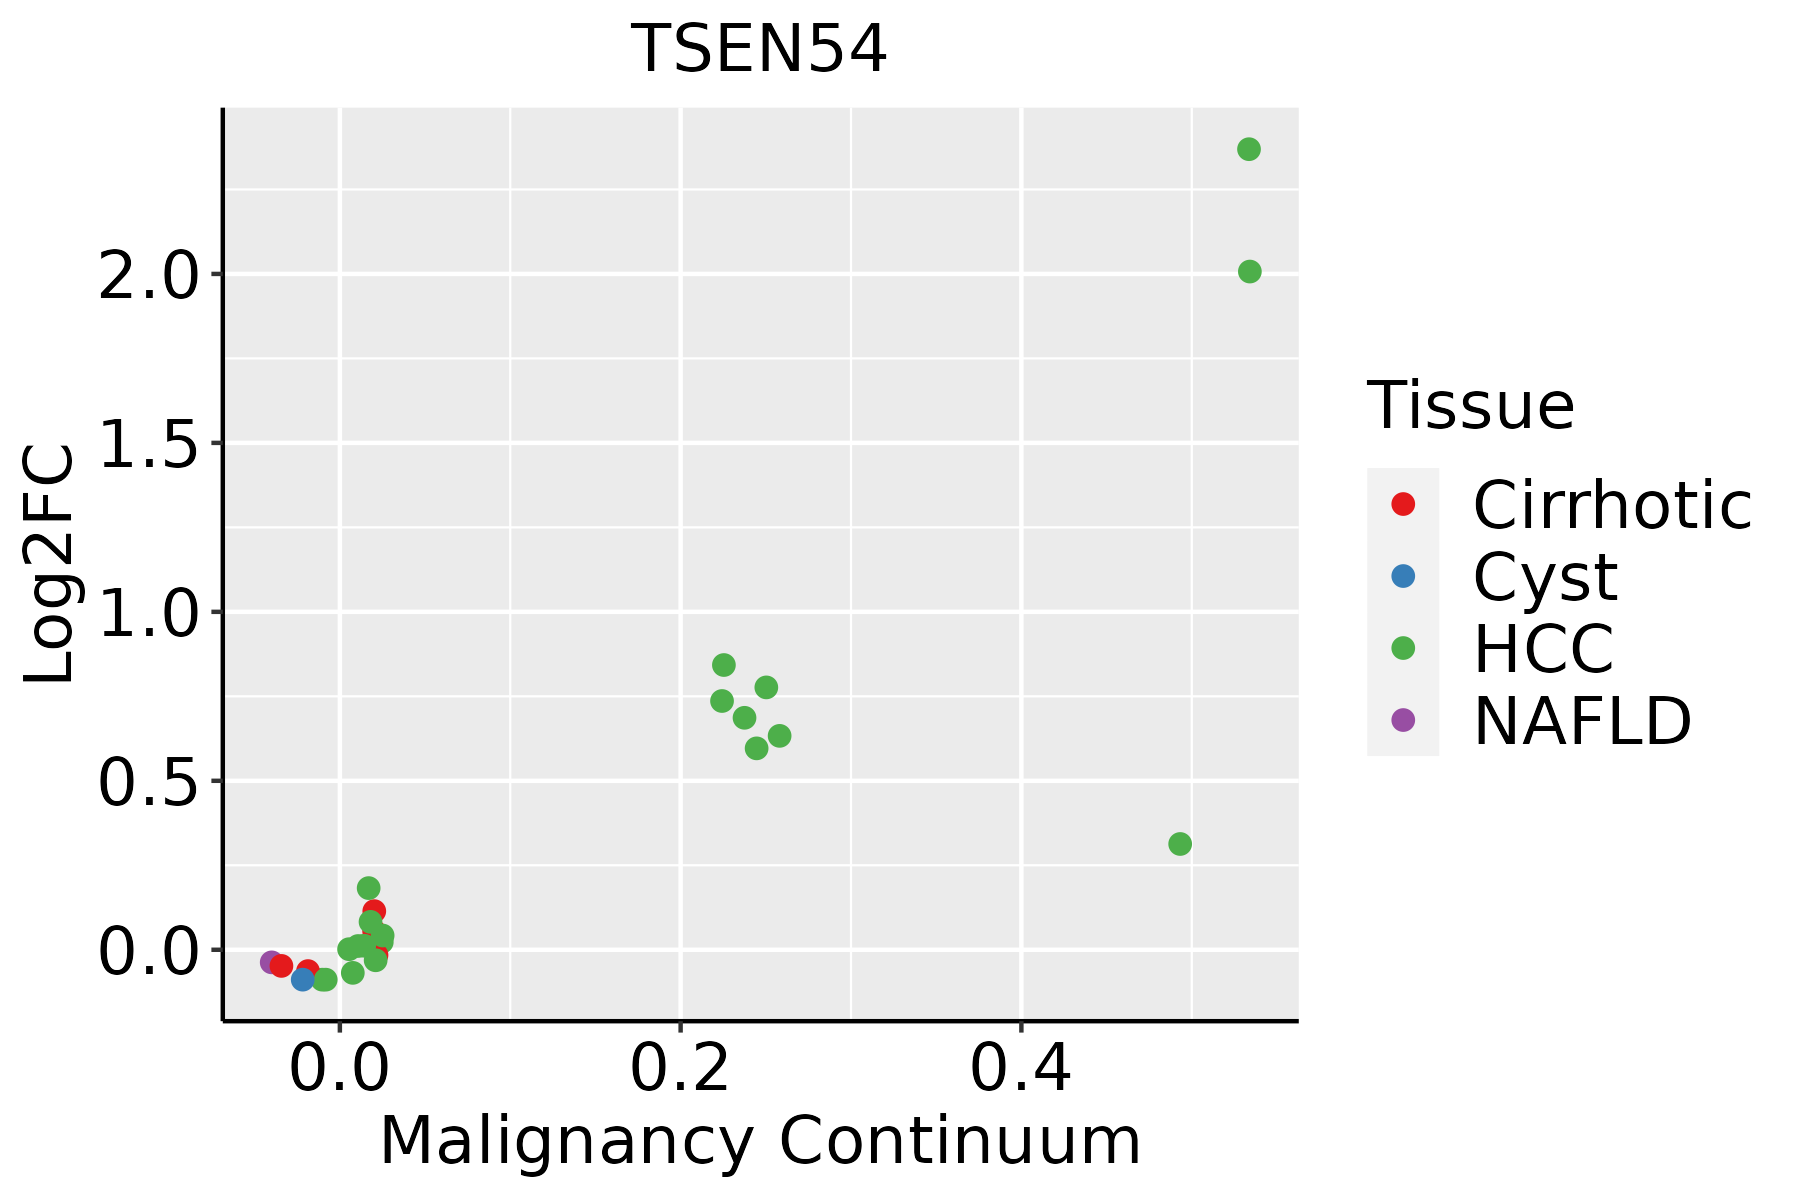 | HCC: Hepatocellular carcinoma |
| NAFLD: Non-alcoholic fatty liver disease | ||
| Oral Cavity |  | EOLP: Erosive Oral lichen planus |
| LP: leukoplakia | ||
| NEOLP: Non-erosive oral lichen planus | ||
| OSCC: Oral squamous cell carcinoma |
| ∗log2FC in expression of this searched gene in stem-like cells from each diseased tissue sample relative to stem-like cells in normal samples in each tissue plotted against the malignancy continuum. Samples are colored based on if they are from different disease stage. |
Top |
Malignant transformation related pathway analysis |
| Find out the enriched GO biological processes and KEGG pathways involved in transition from healthy to precancer to cancer |
| Tissue | Disease Stage | Enriched GO biological Processes |
| Colorectum | AD |  |
| Colorectum | SER |  |
| Colorectum | MSS |  |
| Colorectum | MSI-H |  |
| Colorectum | FAP |  |
| ∗Top 15 enriched GO BP terms are showed in the bar plot of each disease state in each tissue. Each row represents a significant GO biological process which is colored according to the -log10(p.adjust). |
| Page: 1 2 3 4 5 6 7 8 9 |
| GO ID | Tissue | Disease Stage | Description | Gene Ratio | Bg Ratio | pvalue | p.adjust | Count |
| GO:0008380111 | Esophagus | ESCC | RNA splicing | 336/8552 | 434/18723 | 1.74e-42 | 3.67e-39 | 336 |
| GO:003447015 | Esophagus | ESCC | ncRNA processing | 300/8552 | 395/18723 | 3.09e-35 | 3.26e-32 | 300 |
| GO:003466012 | Esophagus | ESCC | ncRNA metabolic process | 346/8552 | 485/18723 | 4.35e-31 | 2.51e-28 | 346 |
| GO:00080333 | Esophagus | ESCC | tRNA processing | 92/8552 | 127/18723 | 7.83e-10 | 1.93e-08 | 92 |
| GO:00063992 | Esophagus | ESCC | tRNA metabolic process | 122/8552 | 179/18723 | 9.03e-10 | 2.19e-08 | 122 |
| GO:000838012 | Liver | Cirrhotic | RNA splicing | 229/4634 | 434/18723 | 9.13e-37 | 2.86e-33 | 229 |
| GO:00344701 | Liver | Cirrhotic | ncRNA processing | 158/4634 | 395/18723 | 1.09e-11 | 6.96e-10 | 158 |
| GO:00346603 | Liver | Cirrhotic | ncRNA metabolic process | 173/4634 | 485/18723 | 3.64e-08 | 1.21e-06 | 173 |
| GO:00344702 | Liver | HCC | ncRNA processing | 293/7958 | 395/18723 | 4.26e-38 | 6.76e-35 | 293 |
| GO:000838022 | Liver | HCC | RNA splicing | 313/7958 | 434/18723 | 1.36e-36 | 1.73e-33 | 313 |
| GO:00346601 | Liver | HCC | ncRNA metabolic process | 332/7958 | 485/18723 | 1.48e-31 | 7.80e-29 | 332 |
| GO:0008033 | Liver | HCC | tRNA processing | 87/7958 | 127/18723 | 2.66e-09 | 7.23e-08 | 87 |
| GO:0006399 | Liver | HCC | tRNA metabolic process | 108/7958 | 179/18723 | 1.07e-06 | 1.59e-05 | 108 |
| GO:000838020 | Oral cavity | OSCC | RNA splicing | 308/7305 | 434/18723 | 2.43e-42 | 7.70e-39 | 308 |
| GO:00344709 | Oral cavity | OSCC | ncRNA processing | 263/7305 | 395/18723 | 4.38e-29 | 2.78e-26 | 263 |
| GO:00346605 | Oral cavity | OSCC | ncRNA metabolic process | 296/7305 | 485/18723 | 2.94e-23 | 6.65e-21 | 296 |
| GO:00080332 | Oral cavity | OSCC | tRNA processing | 78/7305 | 127/18723 | 2.56e-07 | 4.00e-06 | 78 |
| GO:00063991 | Oral cavity | OSCC | tRNA metabolic process | 101/7305 | 179/18723 | 1.65e-06 | 2.15e-05 | 101 |
| GO:0000394 | Oral cavity | OSCC | RNA splicing, via endonucleolytic cleavage and ligation | 9/7305 | 11/18723 | 4.85e-03 | 1.92e-02 | 9 |
| GO:0006388 | Oral cavity | OSCC | tRNA splicing, via endonucleolytic cleavage and ligation | 8/7305 | 10/18723 | 1.03e-02 | 3.53e-02 | 8 |
| Page: 1 2 |
| Pathway ID | Tissue | Disease Stage | Description | Gene Ratio | Bg Ratio | pvalue | p.adjust | qvalue | Count |
| Page: 1 |
Top |
Cell-cell communication analysis |
| Identification of potential cell-cell interactions between two cell types and their ligand-receptor pairs for different disease states |
| Ligand | Receptor | LRpair | Pathway | Tissue | Disease Stage |
| Page: 1 |
Top |
Single-cell gene regulatory network inference analysis |
| Find out the significant the regulons (TFs) and the target genes of each regulon across cell types for different disease states |
| TF | Cell Type | Tissue | Disease Stage | Target Gene | RSS | Regulon Activity |
| ∗The dot plots of a searched regulon are shown for all cell subpopulations in each disease state of each tissue based on the regulon specific score inferred using pySCENIC and by calculating the average expression. |
| Page: 1 |
Top |
Somatic mutation of malignant transformation related genes |
| Annotation of somatic variants for genes involved in malignant transformation |
| Hugo Symbol | Variant Class | Variant Classification | dbSNP RS | HGVSc | HGVSp | HGVSp Short | SWISSPROT | BIOTYPE | SIFT | PolyPhen | Tumor Sample Barcode | Tissue | Histology | Sex | Age | Stage | Therapy Types | Drugs | Outcome |
| TSEN54 | SNV | Missense_Mutation | c.603N>C | p.Lys201Asn | p.K201N | Q7Z6J9 | protein_coding | deleterious(0) | benign(0.212) | TCGA-D8-A1J8-01 | Breast | breast invasive carcinoma | Female | >=65 | I/II | Hormone Therapy | nolvadex | SD | |
| TSEN54 | SNV | Missense_Mutation | c.781N>A | p.Leu261Met | p.L261M | Q7Z6J9 | protein_coding | tolerated(0.11) | possibly_damaging(0.751) | TCGA-GM-A2D9-01 | Breast | breast invasive carcinoma | Female | >=65 | I/II | Hormone Therapy | arimidex | SD | |
| TSEN54 | SNV | Missense_Mutation | novel | c.1300N>C | p.Asp434His | p.D434H | Q7Z6J9 | protein_coding | deleterious(0.01) | possibly_damaging(0.868) | TCGA-Q1-A5R2-01 | Cervix | cervical & endocervical cancer | Female | <65 | I/II | Chemotherapy | cisplatin | PR |
| TSEN54 | SNV | Missense_Mutation | c.587N>C | p.Gly196Ala | p.G196A | Q7Z6J9 | protein_coding | tolerated(0.33) | benign(0.039) | TCGA-Q1-A73O-01 | Cervix | cervical & endocervical cancer | Female | <65 | I/II | Chemotherapy | cisplatin | CR | |
| TSEN54 | SNV | Missense_Mutation | novel | c.335N>C | p.Leu112Pro | p.L112P | Q7Z6J9 | protein_coding | deleterious(0) | probably_damaging(1) | TCGA-A6-5665-01 | Colorectum | colon adenocarcinoma | Female | >=65 | I/II | Unknown | Unknown | PD |
| TSEN54 | SNV | Missense_Mutation | rs200904080 | c.707N>G | p.Gln236Arg | p.Q236R | Q7Z6J9 | protein_coding | tolerated(0.23) | benign(0.343) | TCGA-AA-3492-01 | Colorectum | colon adenocarcinoma | Female | >=65 | I/II | Unknown | Unknown | SD |
| TSEN54 | SNV | Missense_Mutation | rs746239982 | c.287N>A | p.Gly96Asp | p.G96D | Q7Z6J9 | protein_coding | deleterious(0) | probably_damaging(1) | TCGA-AA-A00N-01 | Colorectum | colon adenocarcinoma | Male | >=65 | I/II | Unknown | Unknown | PD |
| TSEN54 | SNV | Missense_Mutation | c.1127N>T | p.Ser376Phe | p.S376F | Q7Z6J9 | protein_coding | deleterious(0) | possibly_damaging(0.564) | TCGA-AD-6895-01 | Colorectum | colon adenocarcinoma | Male | >=65 | III/IV | Unknown | Unknown | SD | |
| TSEN54 | SNV | Missense_Mutation | novel | c.473T>A | p.Phe158Tyr | p.F158Y | Q7Z6J9 | protein_coding | tolerated(0.16) | benign(0.024) | TCGA-CK-4951-01 | Colorectum | colon adenocarcinoma | Female | >=65 | I/II | Unknown | Unknown | PD |
| TSEN54 | SNV | Missense_Mutation | novel | c.524N>A | p.Ser175Tyr | p.S175Y | Q7Z6J9 | protein_coding | deleterious(0) | benign(0.417) | TCGA-A5-A0G2-01 | Endometrium | uterine corpus endometrioid carcinoma | Female | <65 | III/IV | Unknown | Unknown | SD |
| Page: 1 2 |
Top |
Related drugs of malignant transformation related genes |
| Identification of chemicals and drugs interact with genes involved in malignant transfromation |
| (DGIdb 4.0) |
| Entrez ID | Symbol | Category | Interaction Types | Drug Claim Name | Drug Name | PMIDs |
| Page: 1 |

Copyright 2023-Present -The University of Texas Health Science Center at Houston |