
|
|||||
|
 | |
| |
| |
| |
| |
| |
|
Gene: TSEN34 |
Gene summary for TSEN34 |
| Gene information | Species | Human | Gene symbol | TSEN34 | Gene ID | 79042 |
| Gene name | tRNA splicing endonuclease subunit 34 | |
| Gene Alias | LENG5 | |
| Cytomap | 19q13.42 | |
| Gene Type | protein-coding | GO ID | GO:0000379 | UniProtAcc | A0A024R4N9 |
Top |
Malignant transformation analysis |
| Identification of the aberrant gene expression in precancerous and cancerous lesions by comparing the gene expression of stem-like cells in diseased tissues with normal stem cells |
| Entrez ID | Symbol | Replicates | Species | Organ | Tissue | Adj P-value | Log2FC | Malignancy |
| 79042 | TSEN34 | GSM4909281 | Human | Breast | IDC | 1.28e-10 | 4.23e-01 | 0.21 |
| 79042 | TSEN34 | GSM4909282 | Human | Breast | IDC | 3.46e-10 | 3.32e-01 | -0.0288 |
| 79042 | TSEN34 | GSM4909285 | Human | Breast | IDC | 5.73e-92 | 1.23e+00 | 0.21 |
| 79042 | TSEN34 | GSM4909294 | Human | Breast | IDC | 4.72e-04 | 3.06e-01 | 0.2022 |
| 79042 | TSEN34 | GSM4909296 | Human | Breast | IDC | 4.48e-03 | 7.87e-02 | 0.1524 |
| 79042 | TSEN34 | GSM4909297 | Human | Breast | IDC | 3.32e-05 | 1.95e-02 | 0.1517 |
| 79042 | TSEN34 | GSM4909304 | Human | Breast | IDC | 2.12e-03 | 2.60e-01 | 0.1636 |
| 79042 | TSEN34 | GSM4909308 | Human | Breast | IDC | 4.66e-08 | 4.07e-01 | 0.158 |
| 79042 | TSEN34 | GSM4909311 | Human | Breast | IDC | 1.82e-15 | -1.10e-01 | 0.1534 |
| 79042 | TSEN34 | GSM4909312 | Human | Breast | IDC | 1.03e-06 | 1.30e-01 | 0.1552 |
| 79042 | TSEN34 | GSM4909319 | Human | Breast | IDC | 1.07e-22 | -3.88e-02 | 0.1563 |
| 79042 | TSEN34 | GSM4909321 | Human | Breast | IDC | 1.35e-08 | 1.37e-01 | 0.1559 |
| 79042 | TSEN34 | brca2 | Human | Breast | Precancer | 9.12e-05 | 2.34e-01 | -0.024 |
| 79042 | TSEN34 | P1 | Human | Breast | IDC | 7.47e-05 | -1.32e-01 | 0.1527 |
| 79042 | TSEN34 | DCIS2 | Human | Breast | DCIS | 5.92e-51 | 7.40e-02 | 0.0085 |
| 79042 | TSEN34 | HTA11_3410_2000001011 | Human | Colorectum | AD | 9.75e-14 | 2.75e-01 | 0.0155 |
| 79042 | TSEN34 | HTA11_2487_2000001011 | Human | Colorectum | SER | 2.65e-14 | 4.35e-01 | -0.1808 |
| 79042 | TSEN34 | HTA11_2951_2000001011 | Human | Colorectum | AD | 5.41e-04 | 3.50e-01 | 0.0216 |
| 79042 | TSEN34 | HTA11_1938_2000001011 | Human | Colorectum | AD | 1.39e-11 | 4.28e-01 | -0.0811 |
| 79042 | TSEN34 | HTA11_78_2000001011 | Human | Colorectum | AD | 1.37e-10 | 4.30e-01 | -0.1088 |
| Page: 1 2 3 4 5 6 7 8 9 |
| Tissue | Expression Dynamics | Abbreviation |
| Breast | 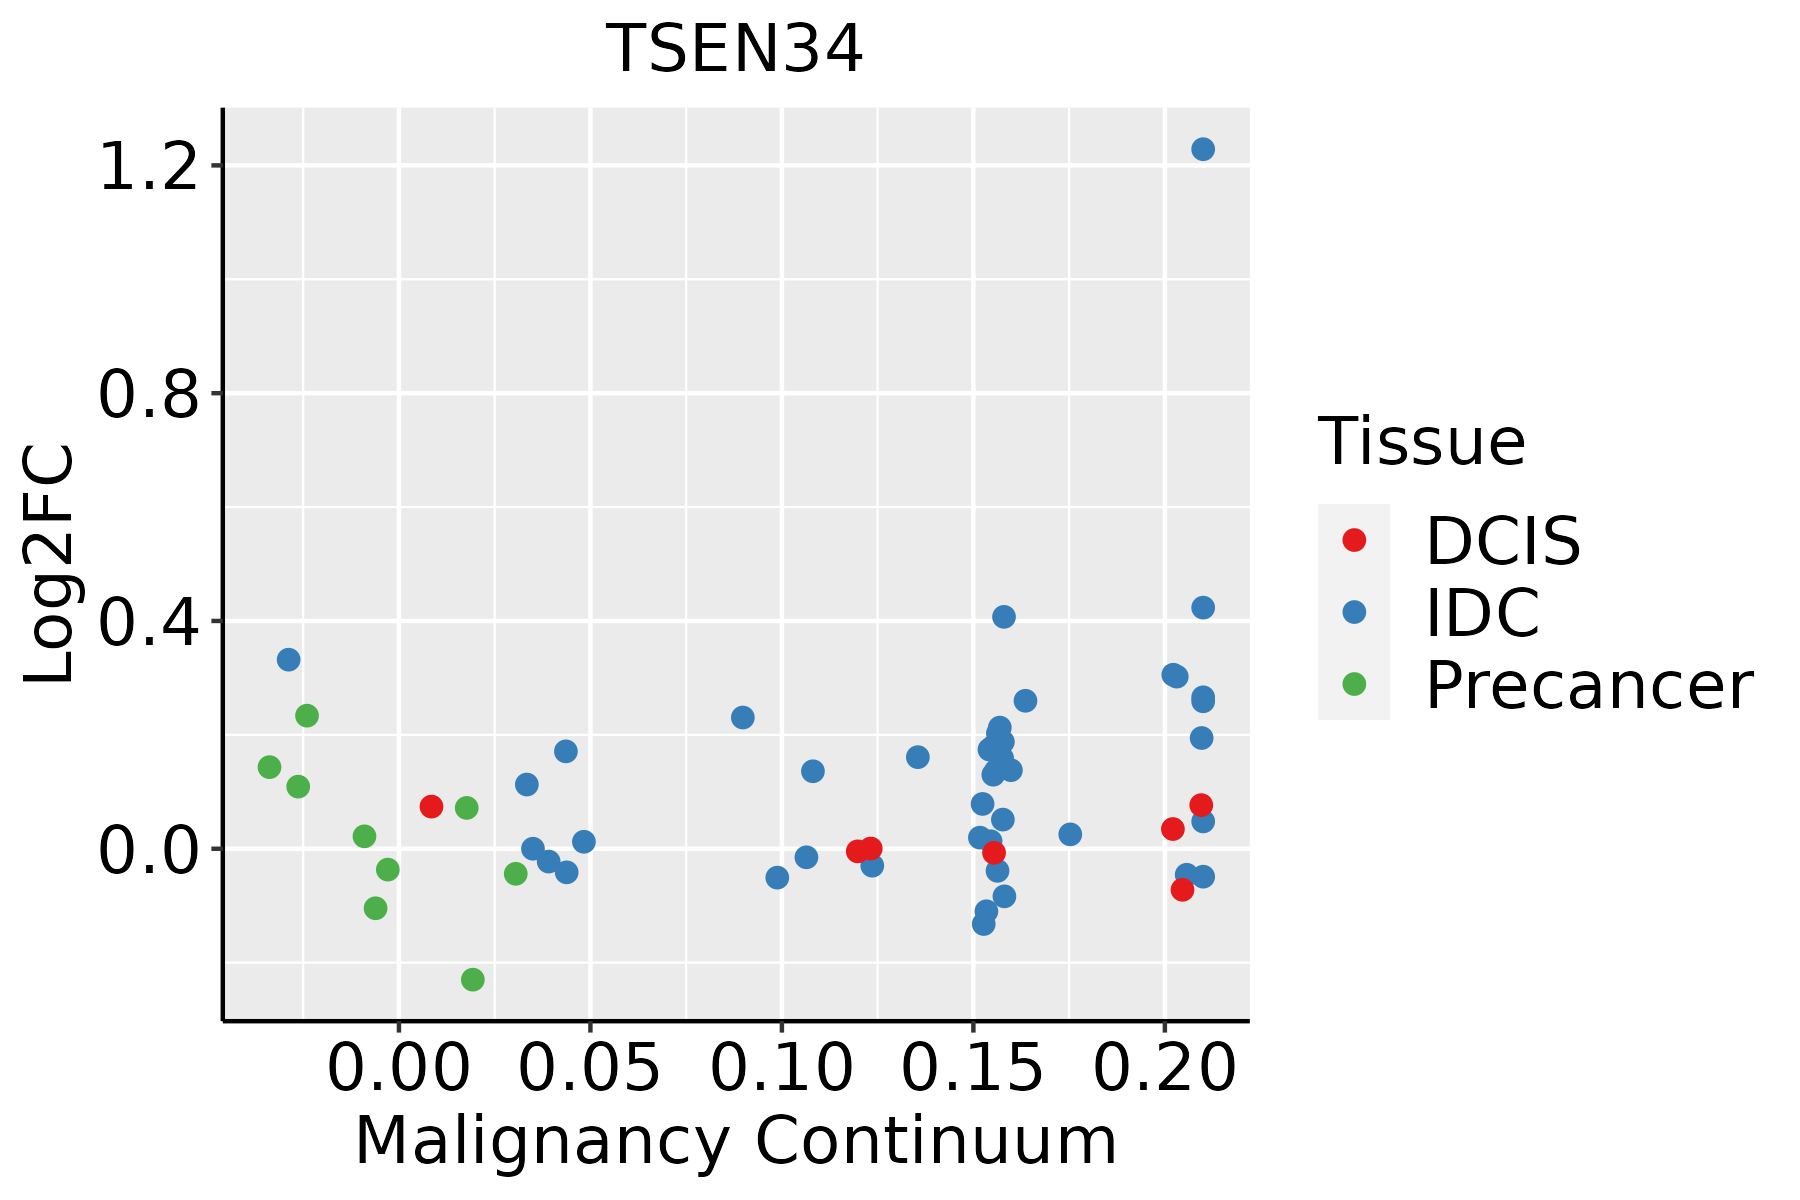 | IDC: Invasive ductal carcinoma |
| DCIS: Ductal carcinoma in situ | ||
| Precancer(BRCA1-mut): Precancerous lesion from BRCA1 mutation carriers | ||
| Colorectum (GSE201348) |  | FAP: Familial adenomatous polyposis |
| CRC: Colorectal cancer | ||
| Colorectum (HTA11) |  | AD: Adenomas |
| SER: Sessile serrated lesions | ||
| MSI-H: Microsatellite-high colorectal cancer | ||
| MSS: Microsatellite stable colorectal cancer | ||
| Esophagus | 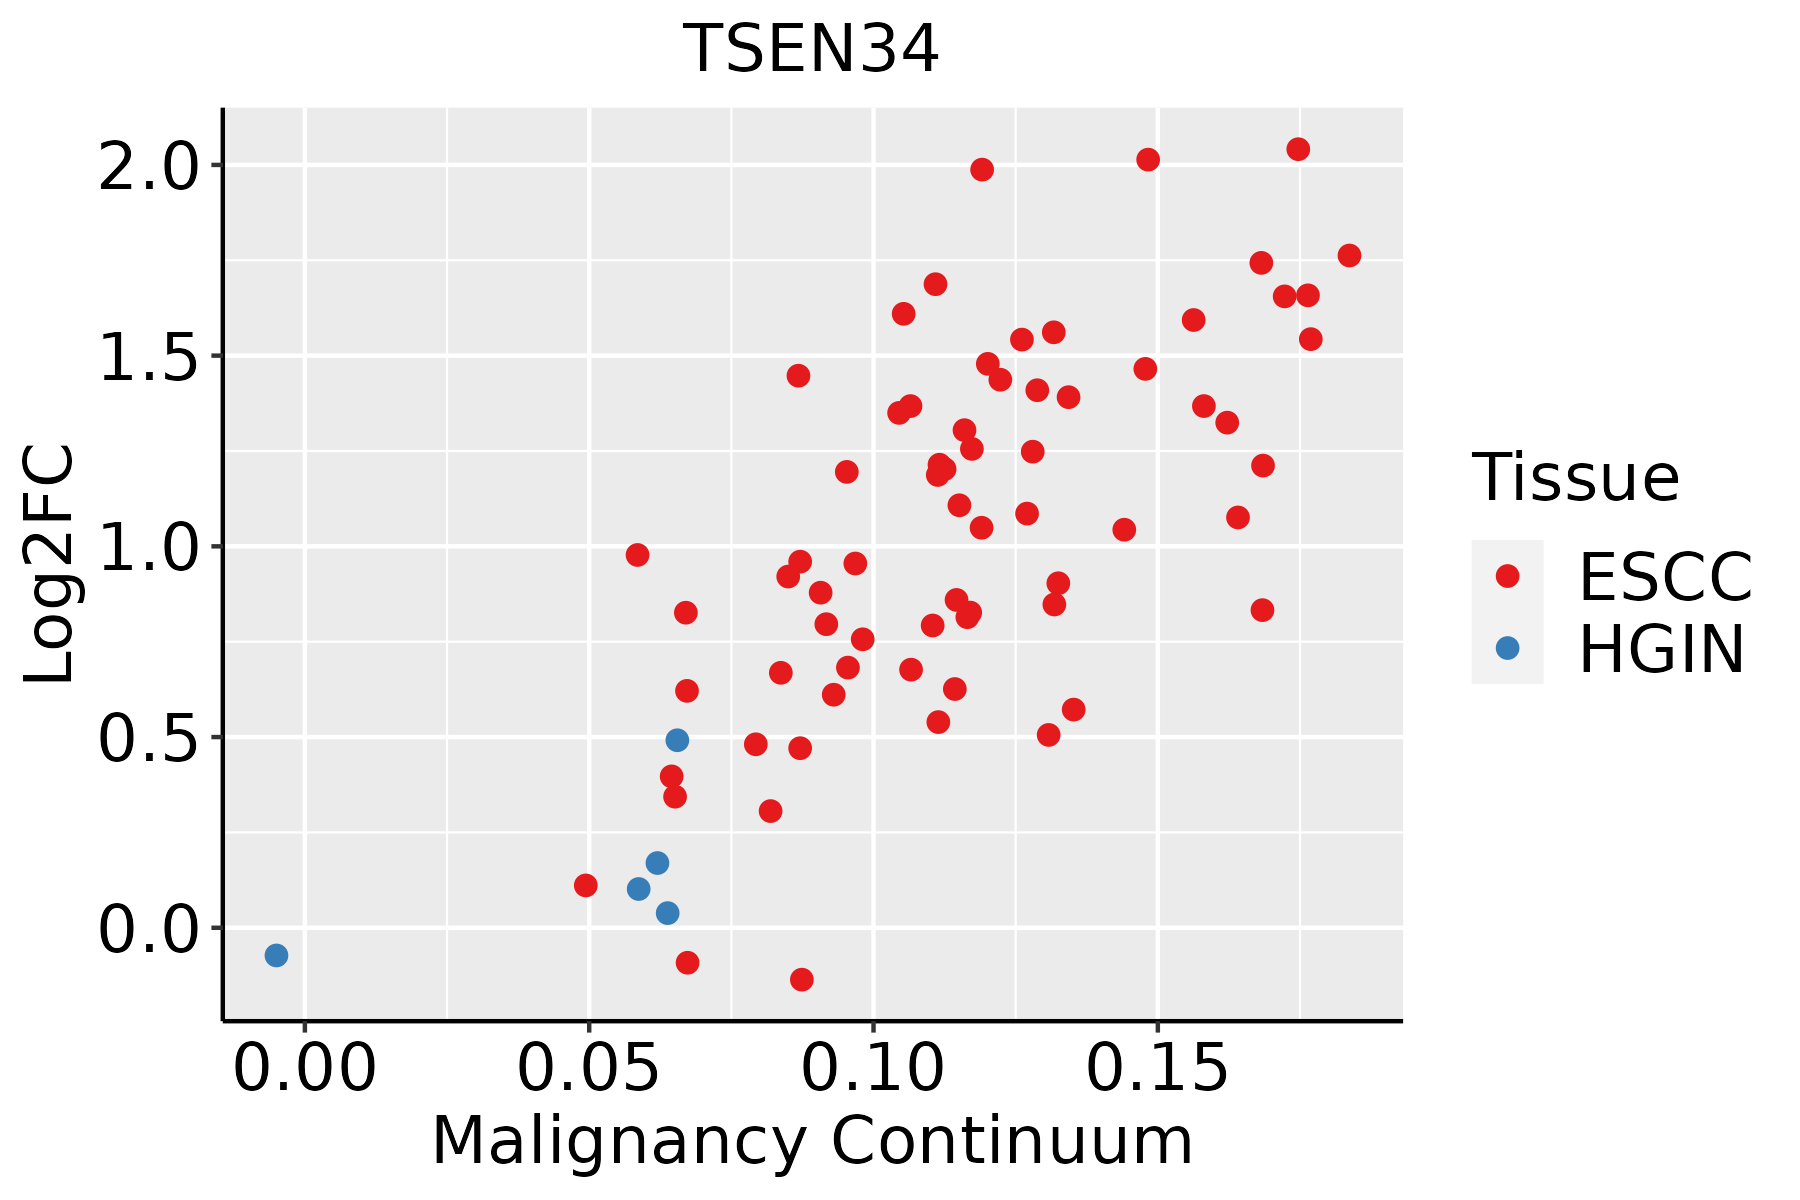 | ESCC: Esophageal squamous cell carcinoma |
| HGIN: High-grade intraepithelial neoplasias | ||
| LGIN: Low-grade intraepithelial neoplasias | ||
| Liver |  | HCC: Hepatocellular carcinoma |
| NAFLD: Non-alcoholic fatty liver disease | ||
| Oral Cavity | 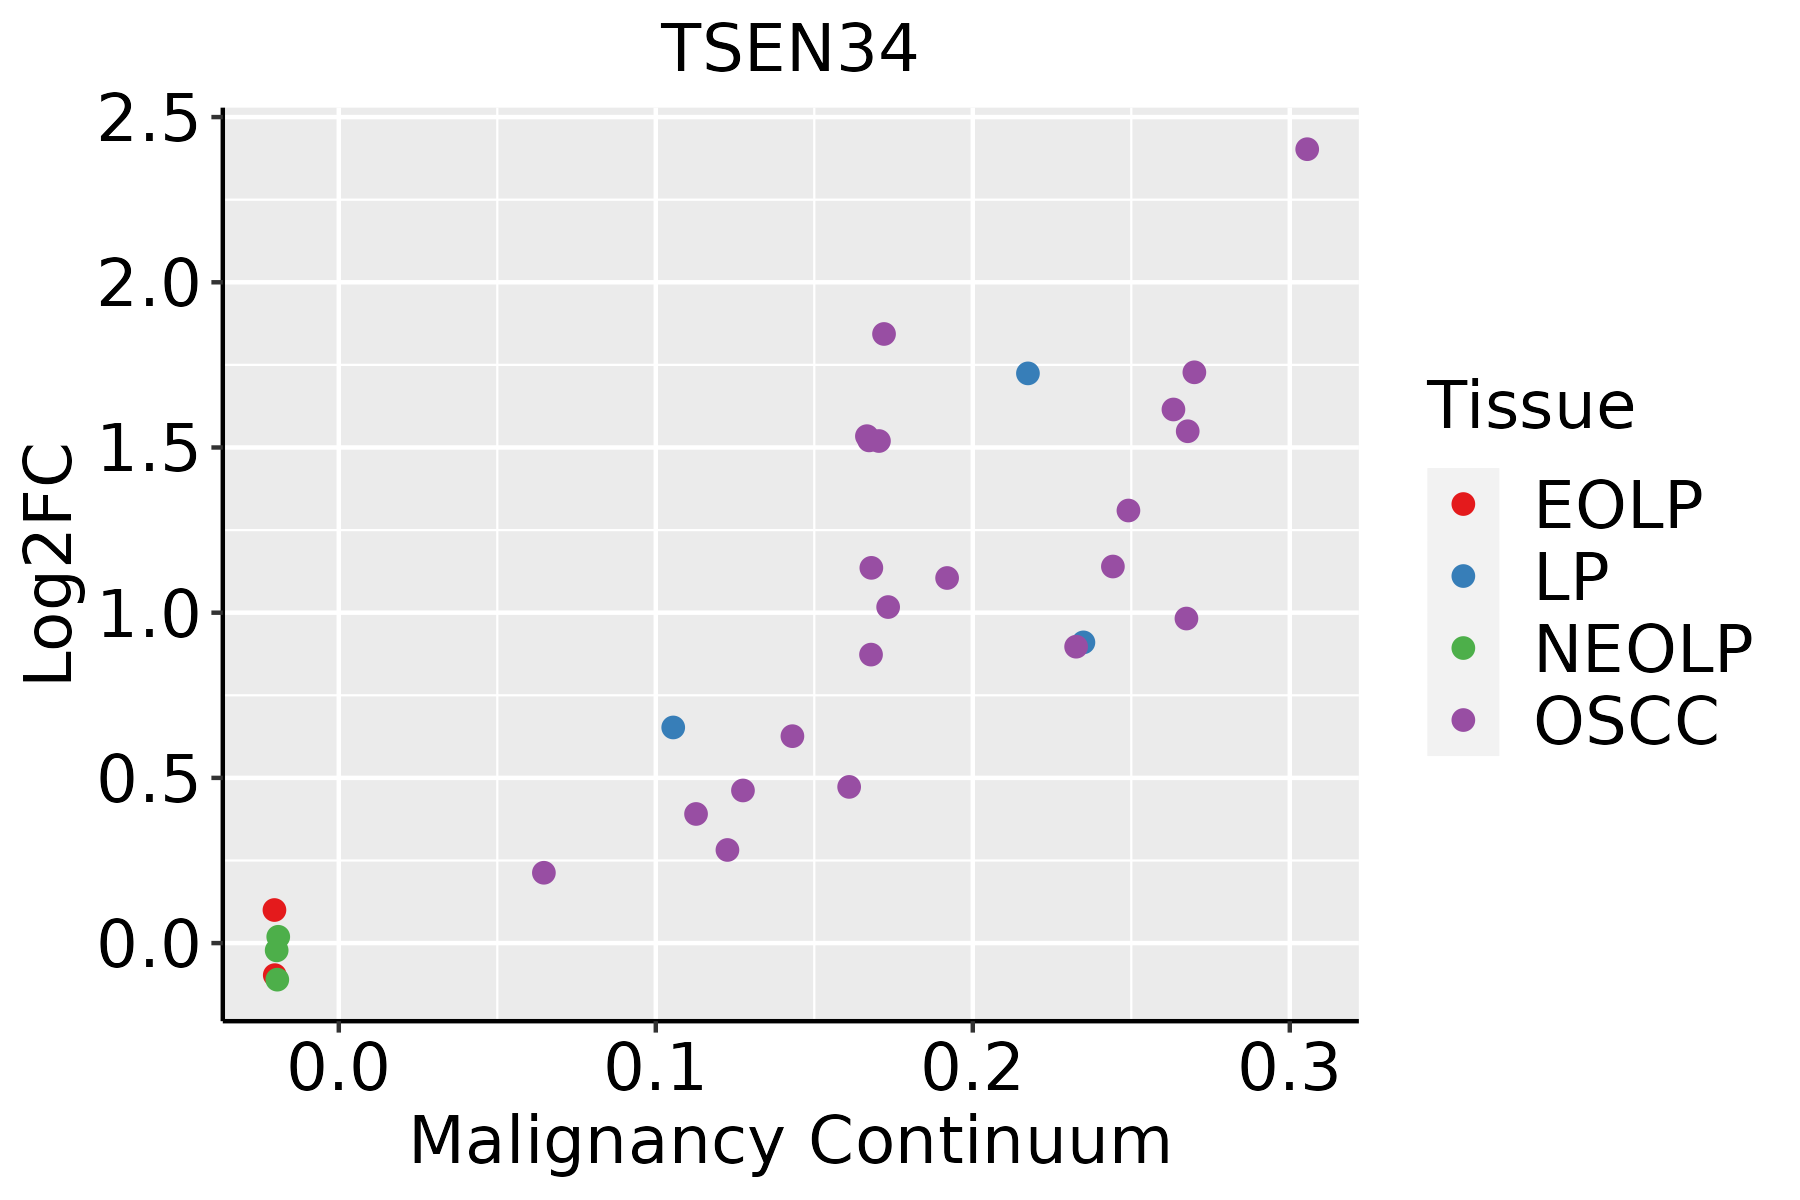 | EOLP: Erosive Oral lichen planus |
| LP: leukoplakia | ||
| NEOLP: Non-erosive oral lichen planus | ||
| OSCC: Oral squamous cell carcinoma | ||
| Skin | 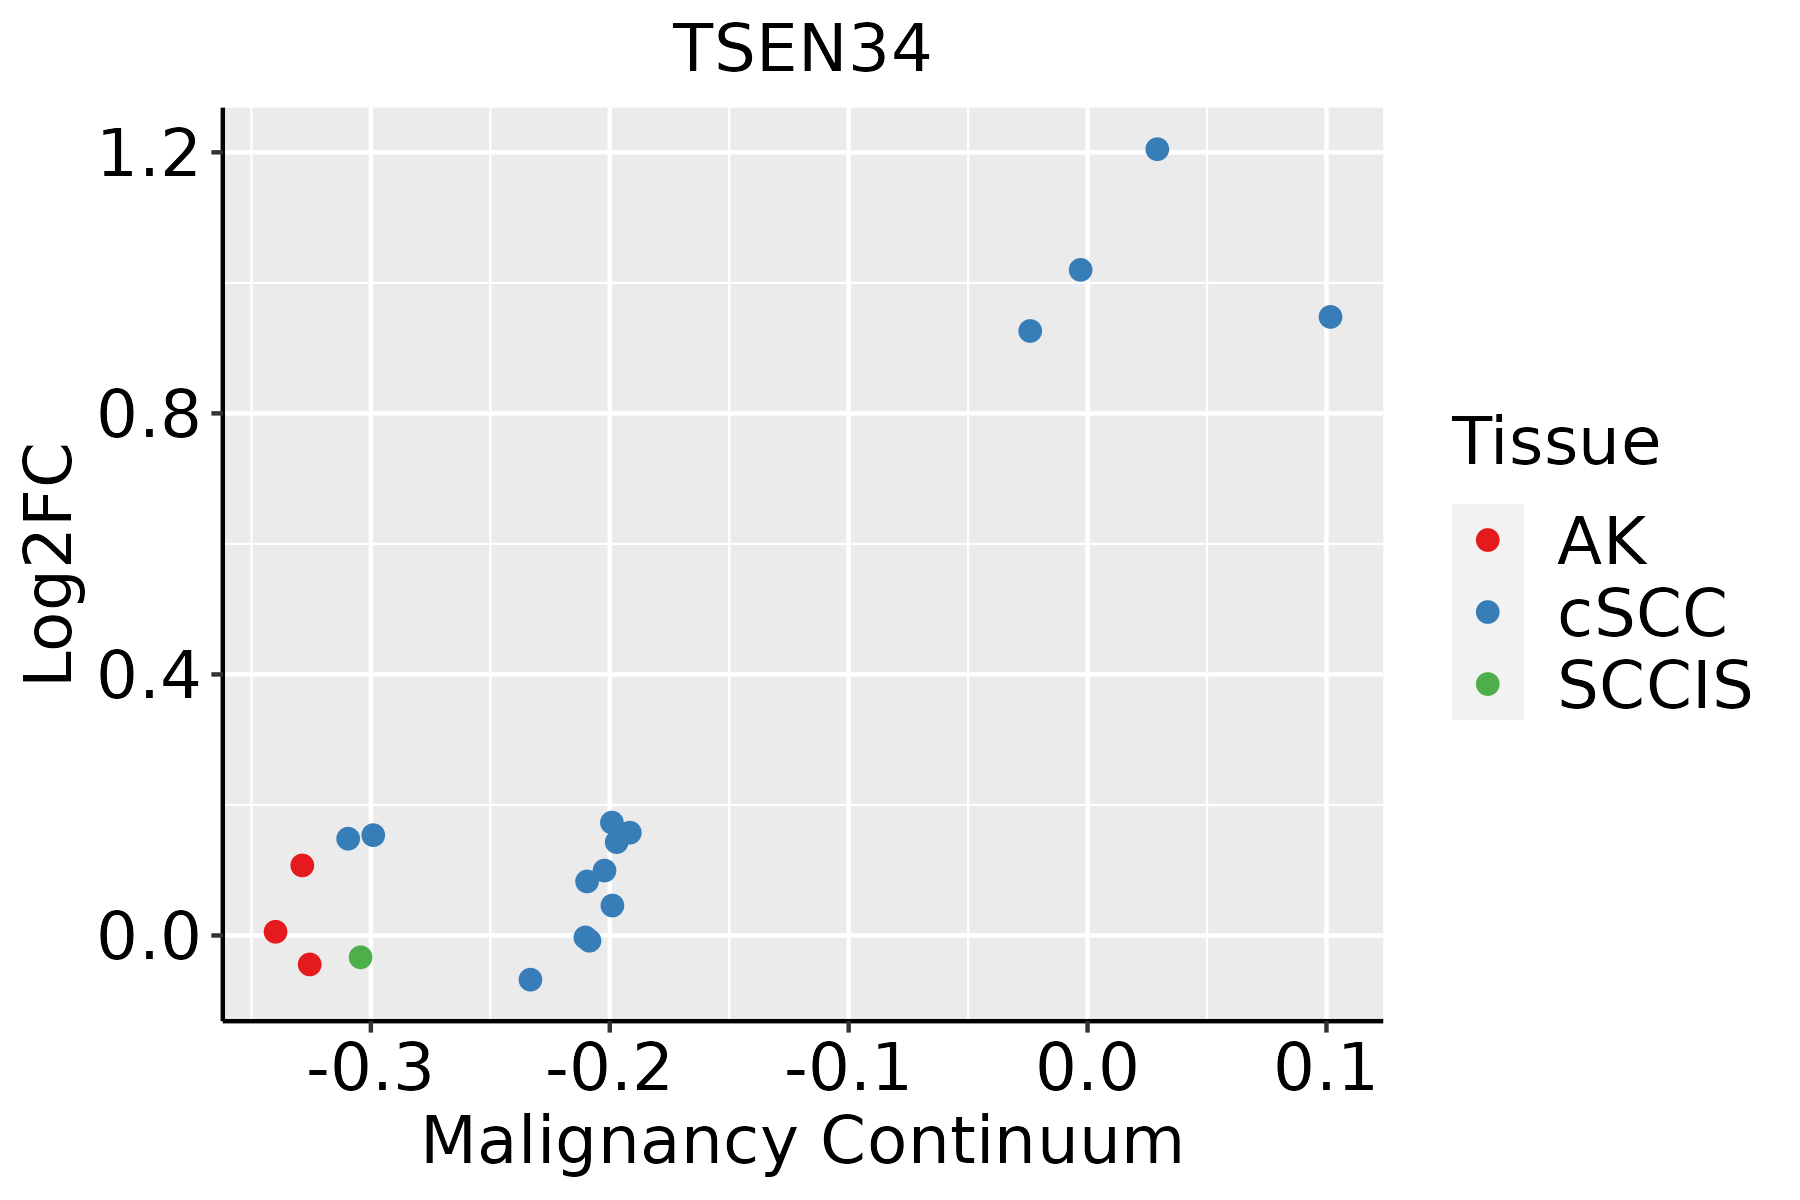 | AK: Actinic keratosis |
| cSCC: Cutaneous squamous cell carcinoma | ||
| SCCIS:squamous cell carcinoma in situ | ||
| Thyroid | 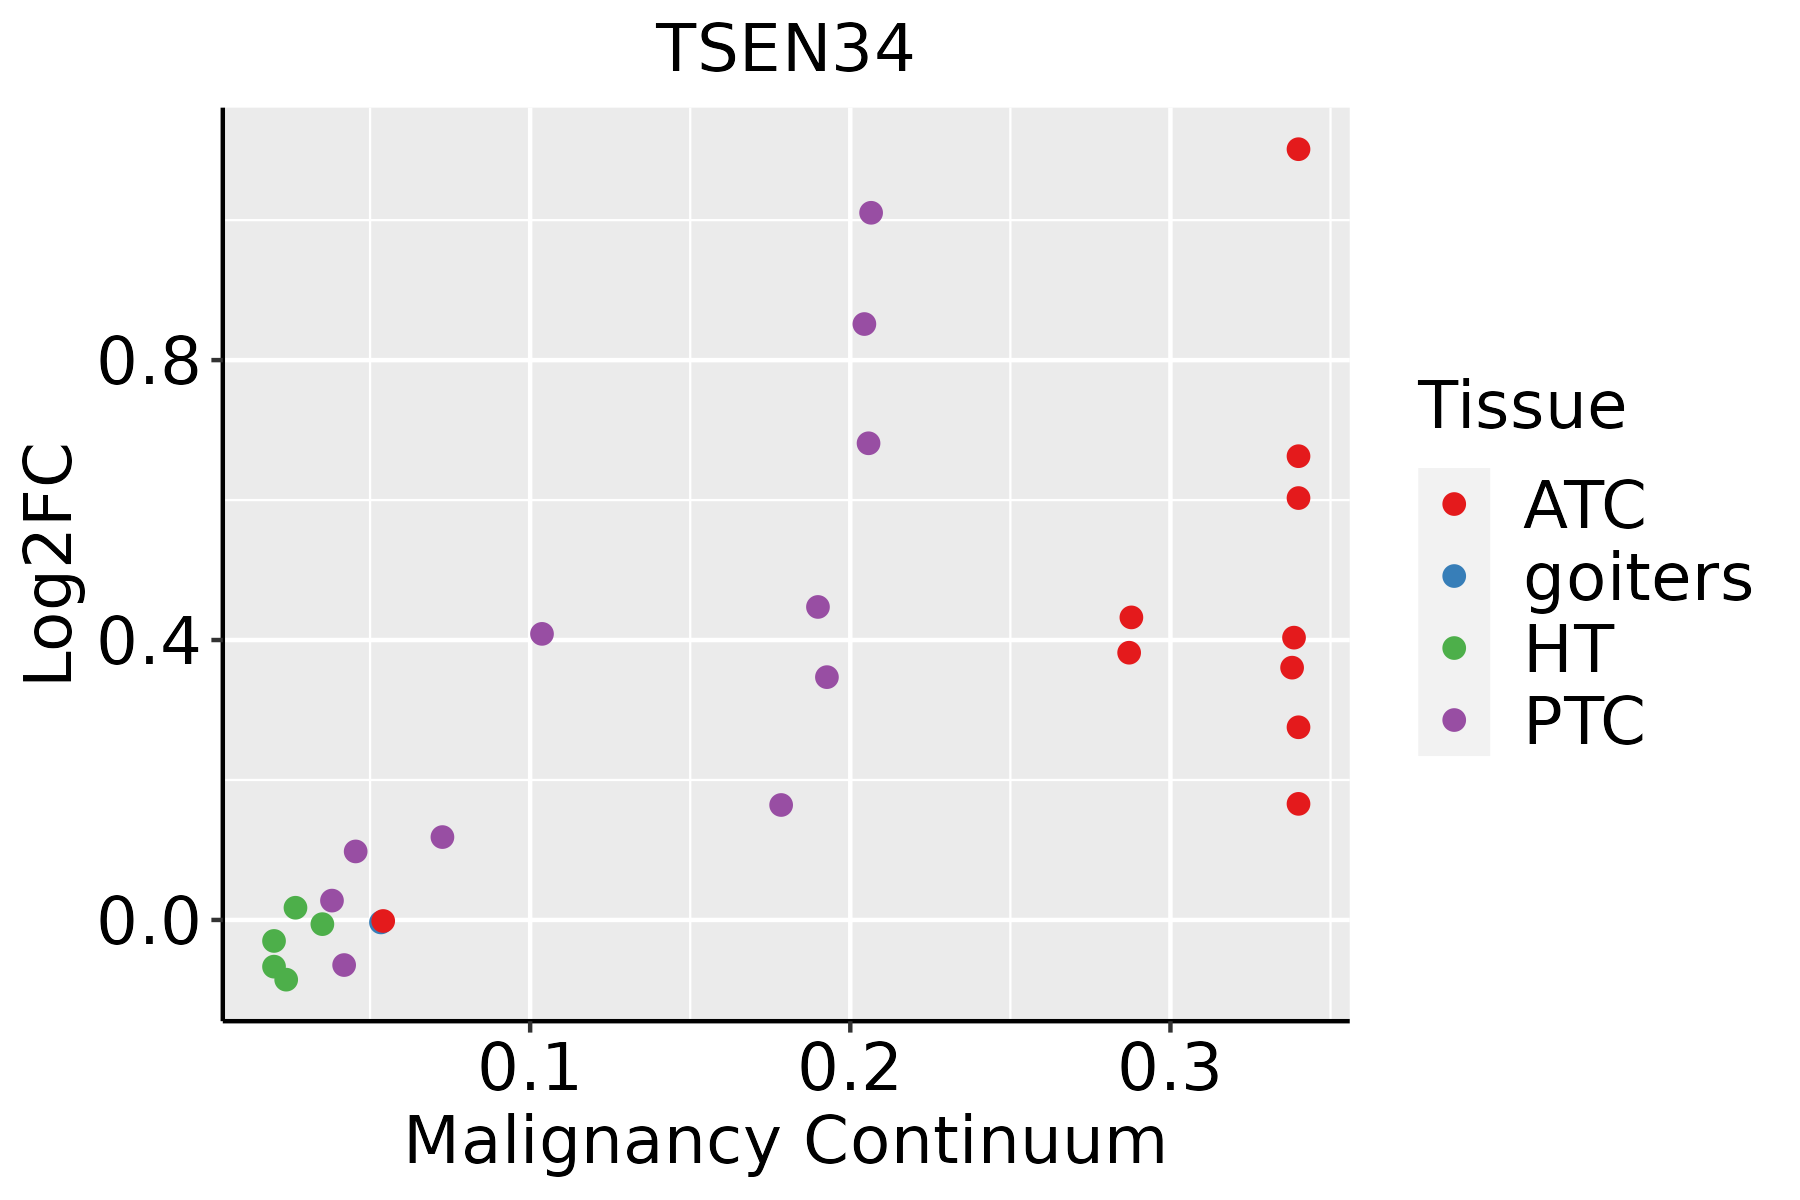 | ATC: Anaplastic thyroid cancer |
| HT: Hashimoto's thyroiditis | ||
| PTC: Papillary thyroid cancer |
| ∗log2FC in expression of this searched gene in stem-like cells from each diseased tissue sample relative to stem-like cells in normal samples in each tissue plotted against the malignancy continuum. Samples are colored based on if they are from different disease stage. |
Top |
Malignant transformation related pathway analysis |
| Find out the enriched GO biological processes and KEGG pathways involved in transition from healthy to precancer to cancer |
| Tissue | Disease Stage | Enriched GO biological Processes |
| Colorectum | AD |  |
| Colorectum | SER |  |
| Colorectum | MSS |  |
| Colorectum | MSI-H |  |
| Colorectum | FAP |  |
| ∗Top 15 enriched GO BP terms are showed in the bar plot of each disease state in each tissue. Each row represents a significant GO biological process which is colored according to the -log10(p.adjust). |
| Page: 1 2 3 4 5 6 7 8 9 |
| GO ID | Tissue | Disease Stage | Description | Gene Ratio | Bg Ratio | pvalue | p.adjust | Count |
| GO:00083809 | Breast | Precancer | RNA splicing | 65/1080 | 434/18723 | 1.27e-12 | 2.53e-10 | 65 |
| GO:00344705 | Breast | Precancer | ncRNA processing | 42/1080 | 395/18723 | 9.91e-05 | 1.83e-03 | 42 |
| GO:00346604 | Breast | Precancer | ncRNA metabolic process | 45/1080 | 485/18723 | 1.15e-03 | 1.26e-02 | 45 |
| GO:000838014 | Breast | IDC | RNA splicing | 73/1434 | 434/18723 | 1.27e-10 | 1.57e-08 | 73 |
| GO:000838024 | Breast | DCIS | RNA splicing | 73/1390 | 434/18723 | 3.05e-11 | 5.08e-09 | 73 |
| GO:003447011 | Breast | DCIS | ncRNA processing | 44/1390 | 395/18723 | 4.56e-03 | 3.49e-02 | 44 |
| GO:0008380 | Colorectum | AD | RNA splicing | 169/3918 | 434/18723 | 3.59e-18 | 2.04e-15 | 169 |
| GO:00083801 | Colorectum | SER | RNA splicing | 123/2897 | 434/18723 | 3.84e-12 | 8.41e-10 | 123 |
| GO:00083802 | Colorectum | MSS | RNA splicing | 159/3467 | 434/18723 | 1.75e-19 | 1.22e-16 | 159 |
| GO:00083803 | Colorectum | MSI-H | RNA splicing | 82/1319 | 434/18723 | 1.22e-16 | 4.53e-14 | 82 |
| GO:0034470 | Colorectum | MSI-H | ncRNA processing | 48/1319 | 395/18723 | 1.54e-04 | 4.47e-03 | 48 |
| GO:0034660 | Colorectum | MSI-H | ncRNA metabolic process | 53/1319 | 485/18723 | 9.66e-04 | 1.68e-02 | 53 |
| GO:000838026 | Esophagus | HGIN | RNA splicing | 160/2587 | 434/18723 | 3.74e-34 | 1.12e-30 | 160 |
| GO:003447010 | Esophagus | HGIN | ncRNA processing | 97/2587 | 395/18723 | 5.92e-09 | 3.90e-07 | 97 |
| GO:00346606 | Esophagus | HGIN | ncRNA metabolic process | 104/2587 | 485/18723 | 2.26e-06 | 8.23e-05 | 104 |
| GO:00003942 | Esophagus | HGIN | RNA splicing, via endonucleolytic cleavage and ligation | 6/2587 | 11/18723 | 1.71e-03 | 1.86e-02 | 6 |
| GO:0008380111 | Esophagus | ESCC | RNA splicing | 336/8552 | 434/18723 | 1.74e-42 | 3.67e-39 | 336 |
| GO:003447015 | Esophagus | ESCC | ncRNA processing | 300/8552 | 395/18723 | 3.09e-35 | 3.26e-32 | 300 |
| GO:003466012 | Esophagus | ESCC | ncRNA metabolic process | 346/8552 | 485/18723 | 4.35e-31 | 2.51e-28 | 346 |
| GO:00905013 | Esophagus | ESCC | RNA phosphodiester bond hydrolysis | 110/8552 | 152/18723 | 1.95e-11 | 6.81e-10 | 110 |
| Page: 1 2 3 4 |
| Pathway ID | Tissue | Disease Stage | Description | Gene Ratio | Bg Ratio | pvalue | p.adjust | qvalue | Count |
| Page: 1 |
Top |
Cell-cell communication analysis |
| Identification of potential cell-cell interactions between two cell types and their ligand-receptor pairs for different disease states |
| Ligand | Receptor | LRpair | Pathway | Tissue | Disease Stage |
| Page: 1 |
Top |
Single-cell gene regulatory network inference analysis |
| Find out the significant the regulons (TFs) and the target genes of each regulon across cell types for different disease states |
| TF | Cell Type | Tissue | Disease Stage | Target Gene | RSS | Regulon Activity |
| ∗The dot plots of a searched regulon are shown for all cell subpopulations in each disease state of each tissue based on the regulon specific score inferred using pySCENIC and by calculating the average expression. |
| Page: 1 |
Top |
Somatic mutation of malignant transformation related genes |
| Annotation of somatic variants for genes involved in malignant transformation |
| Hugo Symbol | Variant Class | Variant Classification | dbSNP RS | HGVSc | HGVSp | HGVSp Short | SWISSPROT | BIOTYPE | SIFT | PolyPhen | Tumor Sample Barcode | Tissue | Histology | Sex | Age | Stage | Therapy Types | Drugs | Outcome |
| TSEN34 | SNV | Missense_Mutation | c.282N>T | p.Glu94Asp | p.E94D | protein_coding | tolerated(0.08) | benign(0.073) | TCGA-AN-A0AK-01 | Breast | breast invasive carcinoma | Female | >=65 | I/II | Unknown | Unknown | SD | ||
| TSEN34 | SNV | Missense_Mutation | novel | c.563N>C | p.Val188Ala | p.V188A | protein_coding | deleterious(0) | possibly_damaging(0.686) | TCGA-AN-A0AK-01 | Breast | breast invasive carcinoma | Female | >=65 | I/II | Unknown | Unknown | SD | |
| TSEN34 | SNV | Missense_Mutation | rs775204637 | c.476N>T | p.Ser159Leu | p.S159L | protein_coding | tolerated(0.18) | benign(0.005) | TCGA-C8-A12T-01 | Breast | breast invasive carcinoma | Female | <65 | I/II | Unknown | Unknown | SD | |
| TSEN34 | SNV | Missense_Mutation | rs778367406 | c.867G>C | p.Lys289Asn | p.K289N | protein_coding | deleterious(0) | probably_damaging(0.999) | TCGA-EK-A2PL-01 | Cervix | cervical & endocervical cancer | Female | <65 | III/IV | Unknown | Unknown | SD | |
| TSEN34 | SNV | Missense_Mutation | rs374974634 | c.280N>A | p.Glu94Lys | p.E94K | protein_coding | deleterious(0.01) | benign(0.145) | TCGA-VS-A953-01 | Cervix | cervical & endocervical cancer | Female | <65 | I/II | Unknown | Unknown | PD | |
| TSEN34 | SNV | Missense_Mutation | c.248G>T | p.Ser83Ile | p.S83I | protein_coding | tolerated(0.1) | benign(0.142) | TCGA-AA-3672-01 | Colorectum | colon adenocarcinoma | Female | >=65 | III/IV | Unknown | Unknown | SD | ||
| TSEN34 | SNV | Missense_Mutation | c.370G>A | p.Ala124Thr | p.A124T | protein_coding | deleterious(0.02) | possibly_damaging(0.89) | TCGA-G4-6588-01 | Colorectum | colon adenocarcinoma | Female | <65 | I/II | Unknown | Unknown | SD | ||
| TSEN34 | SNV | Missense_Mutation | novel | c.412T>G | p.Ser138Ala | p.S138A | protein_coding | tolerated(0.62) | benign(0.003) | TCGA-A5-A0G2-01 | Endometrium | uterine corpus endometrioid carcinoma | Female | <65 | III/IV | Unknown | Unknown | SD | |
| TSEN34 | SNV | Missense_Mutation | rs778884462 | c.503C>T | p.Ser168Leu | p.S168L | protein_coding | tolerated(0.47) | benign(0.036) | TCGA-AP-A0LM-01 | Endometrium | uterine corpus endometrioid carcinoma | Female | <65 | III/IV | Chemotherapy | cisplatin | SD | |
| TSEN34 | SNV | Missense_Mutation | novel | c.363N>T | p.Glu121Asp | p.E121D | protein_coding | deleterious(0.01) | benign(0.268) | TCGA-AX-A2HC-01 | Endometrium | uterine corpus endometrioid carcinoma | Female | <65 | III/IV | Chemotherapy | paclitaxel | PD |
| Page: 1 2 3 4 |
Top |
Related drugs of malignant transformation related genes |
| Identification of chemicals and drugs interact with genes involved in malignant transfromation |
| (DGIdb 4.0) |
| Entrez ID | Symbol | Category | Interaction Types | Drug Claim Name | Drug Name | PMIDs |
| Page: 1 |

Copyright 2023-Present -The University of Texas Health Science Center at Houston |