
|
|||||
|
 | |
| |
| |
| |
| |
| |
|
Gene: TSEN15 |
Gene summary for TSEN15 |
| Gene information | Species | Human | Gene symbol | TSEN15 | Gene ID | 116461 |
| Gene name | tRNA splicing endonuclease subunit 15 | |
| Gene Alias | C1orf19 | |
| Cytomap | 1q25.3 | |
| Gene Type | protein-coding | GO ID | GO:0000394 | UniProtAcc | Q8WW01 |
Top |
Malignant transformation analysis |
| Identification of the aberrant gene expression in precancerous and cancerous lesions by comparing the gene expression of stem-like cells in diseased tissues with normal stem cells |
| Entrez ID | Symbol | Replicates | Species | Organ | Tissue | Adj P-value | Log2FC | Malignancy |
| 116461 | TSEN15 | LZE2D | Human | Esophagus | HGIN | 5.04e-04 | 6.07e-01 | 0.0642 |
| 116461 | TSEN15 | LZE2T | Human | Esophagus | ESCC | 6.05e-14 | 1.34e+00 | 0.082 |
| 116461 | TSEN15 | LZE4T | Human | Esophagus | ESCC | 1.66e-26 | 6.55e-01 | 0.0811 |
| 116461 | TSEN15 | LZE7T | Human | Esophagus | ESCC | 1.17e-14 | 7.85e-01 | 0.0667 |
| 116461 | TSEN15 | LZE8T | Human | Esophagus | ESCC | 4.44e-14 | 3.90e-01 | 0.067 |
| 116461 | TSEN15 | LZE20T | Human | Esophagus | ESCC | 2.09e-06 | 3.26e-01 | 0.0662 |
| 116461 | TSEN15 | LZE21D1 | Human | Esophagus | HGIN | 3.11e-02 | 3.05e-01 | 0.0632 |
| 116461 | TSEN15 | LZE22T | Human | Esophagus | ESCC | 1.59e-05 | 5.36e-01 | 0.068 |
| 116461 | TSEN15 | LZE24T | Human | Esophagus | ESCC | 3.02e-23 | 6.24e-01 | 0.0596 |
| 116461 | TSEN15 | LZE21T | Human | Esophagus | ESCC | 4.74e-09 | 5.03e-01 | 0.0655 |
| 116461 | TSEN15 | LZE6T | Human | Esophagus | ESCC | 4.68e-10 | 3.85e-01 | 0.0845 |
| 116461 | TSEN15 | P1T-E | Human | Esophagus | ESCC | 4.50e-09 | 4.85e-01 | 0.0875 |
| 116461 | TSEN15 | P2T-E | Human | Esophagus | ESCC | 9.44e-50 | 9.10e-01 | 0.1177 |
| 116461 | TSEN15 | P4T-E | Human | Esophagus | ESCC | 1.20e-52 | 1.24e+00 | 0.1323 |
| 116461 | TSEN15 | P5T-E | Human | Esophagus | ESCC | 1.45e-46 | 8.20e-01 | 0.1327 |
| 116461 | TSEN15 | P8T-E | Human | Esophagus | ESCC | 7.60e-34 | 5.63e-01 | 0.0889 |
| 116461 | TSEN15 | P9T-E | Human | Esophagus | ESCC | 6.08e-44 | 9.37e-01 | 0.1131 |
| 116461 | TSEN15 | P10T-E | Human | Esophagus | ESCC | 8.71e-43 | 7.00e-01 | 0.116 |
| 116461 | TSEN15 | P11T-E | Human | Esophagus | ESCC | 4.89e-18 | 6.27e-01 | 0.1426 |
| 116461 | TSEN15 | P12T-E | Human | Esophagus | ESCC | 3.41e-36 | 6.11e-01 | 0.1122 |
| Page: 1 2 3 4 5 6 |
| Tissue | Expression Dynamics | Abbreviation |
| Esophagus | 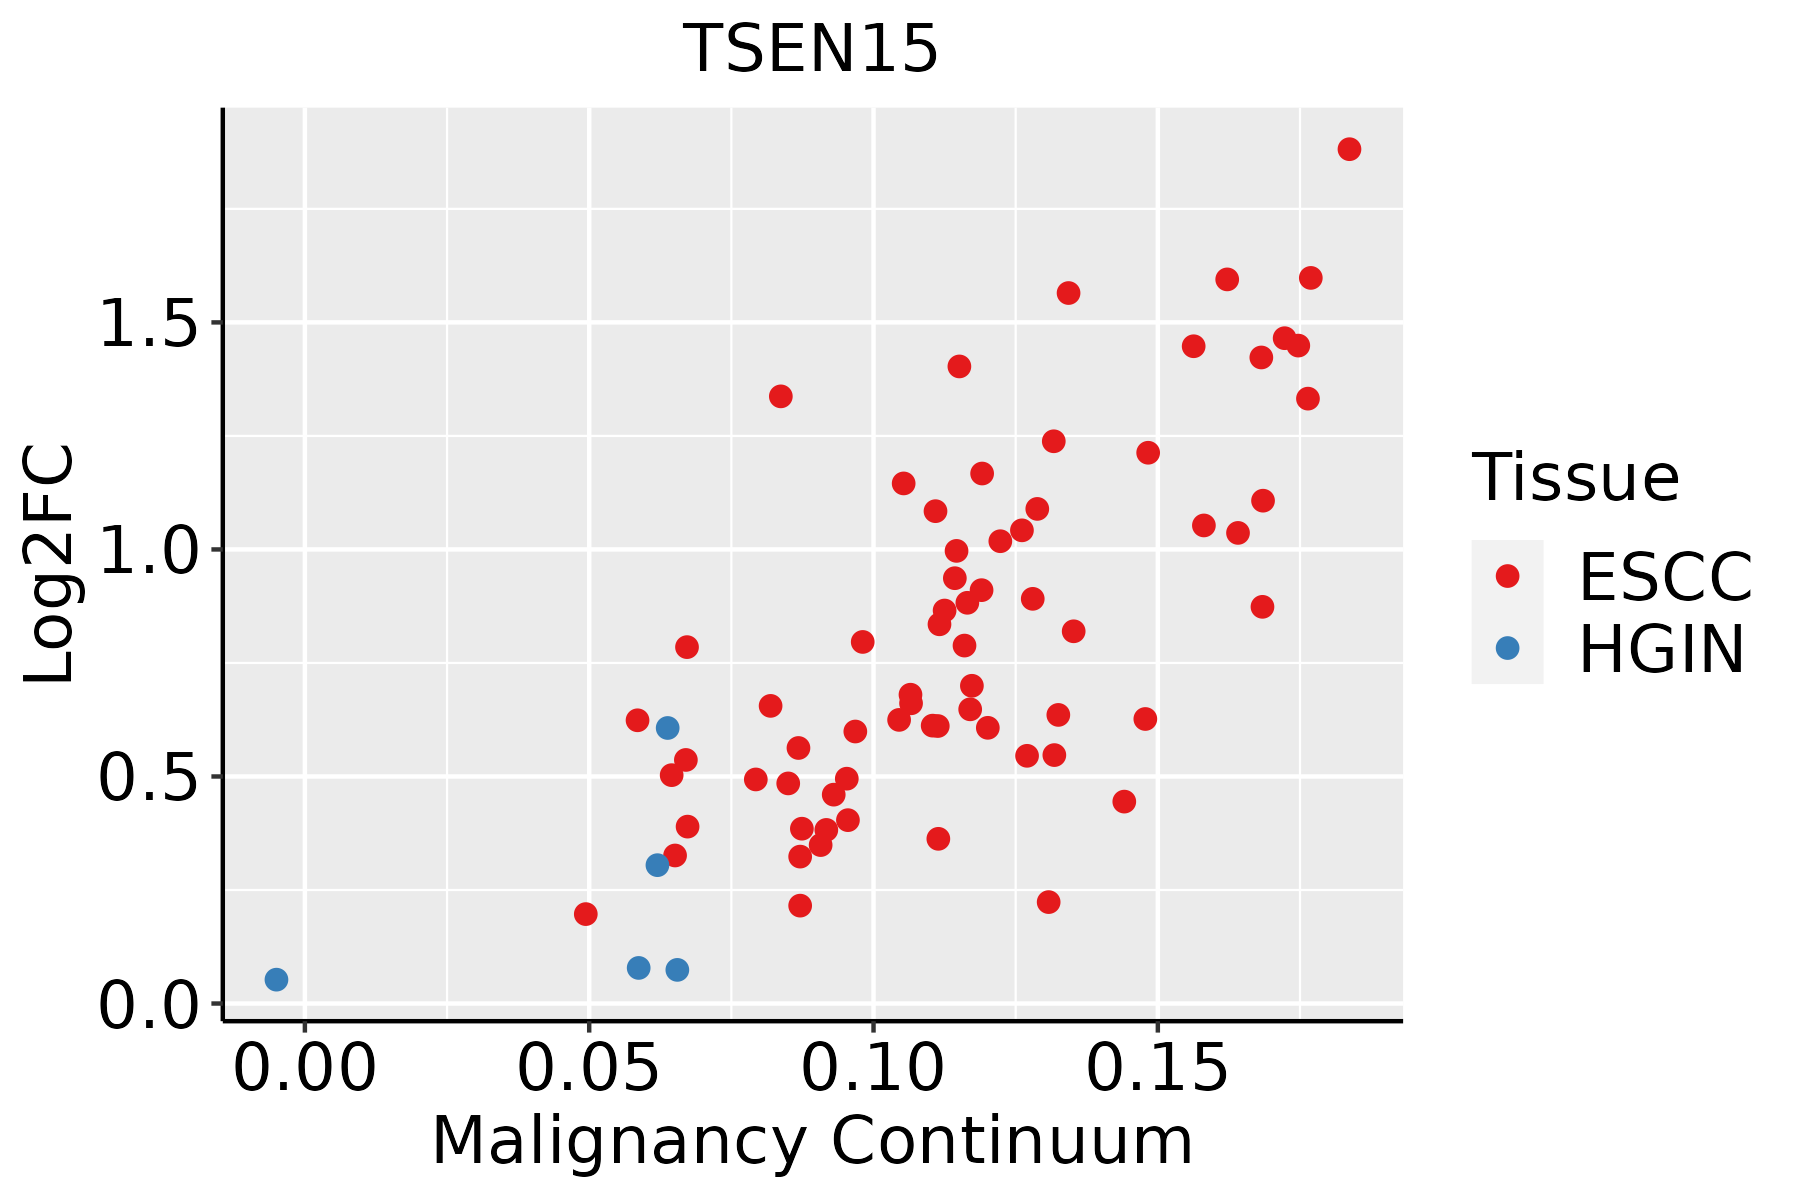 | ESCC: Esophageal squamous cell carcinoma |
| HGIN: High-grade intraepithelial neoplasias | ||
| LGIN: Low-grade intraepithelial neoplasias | ||
| Liver | 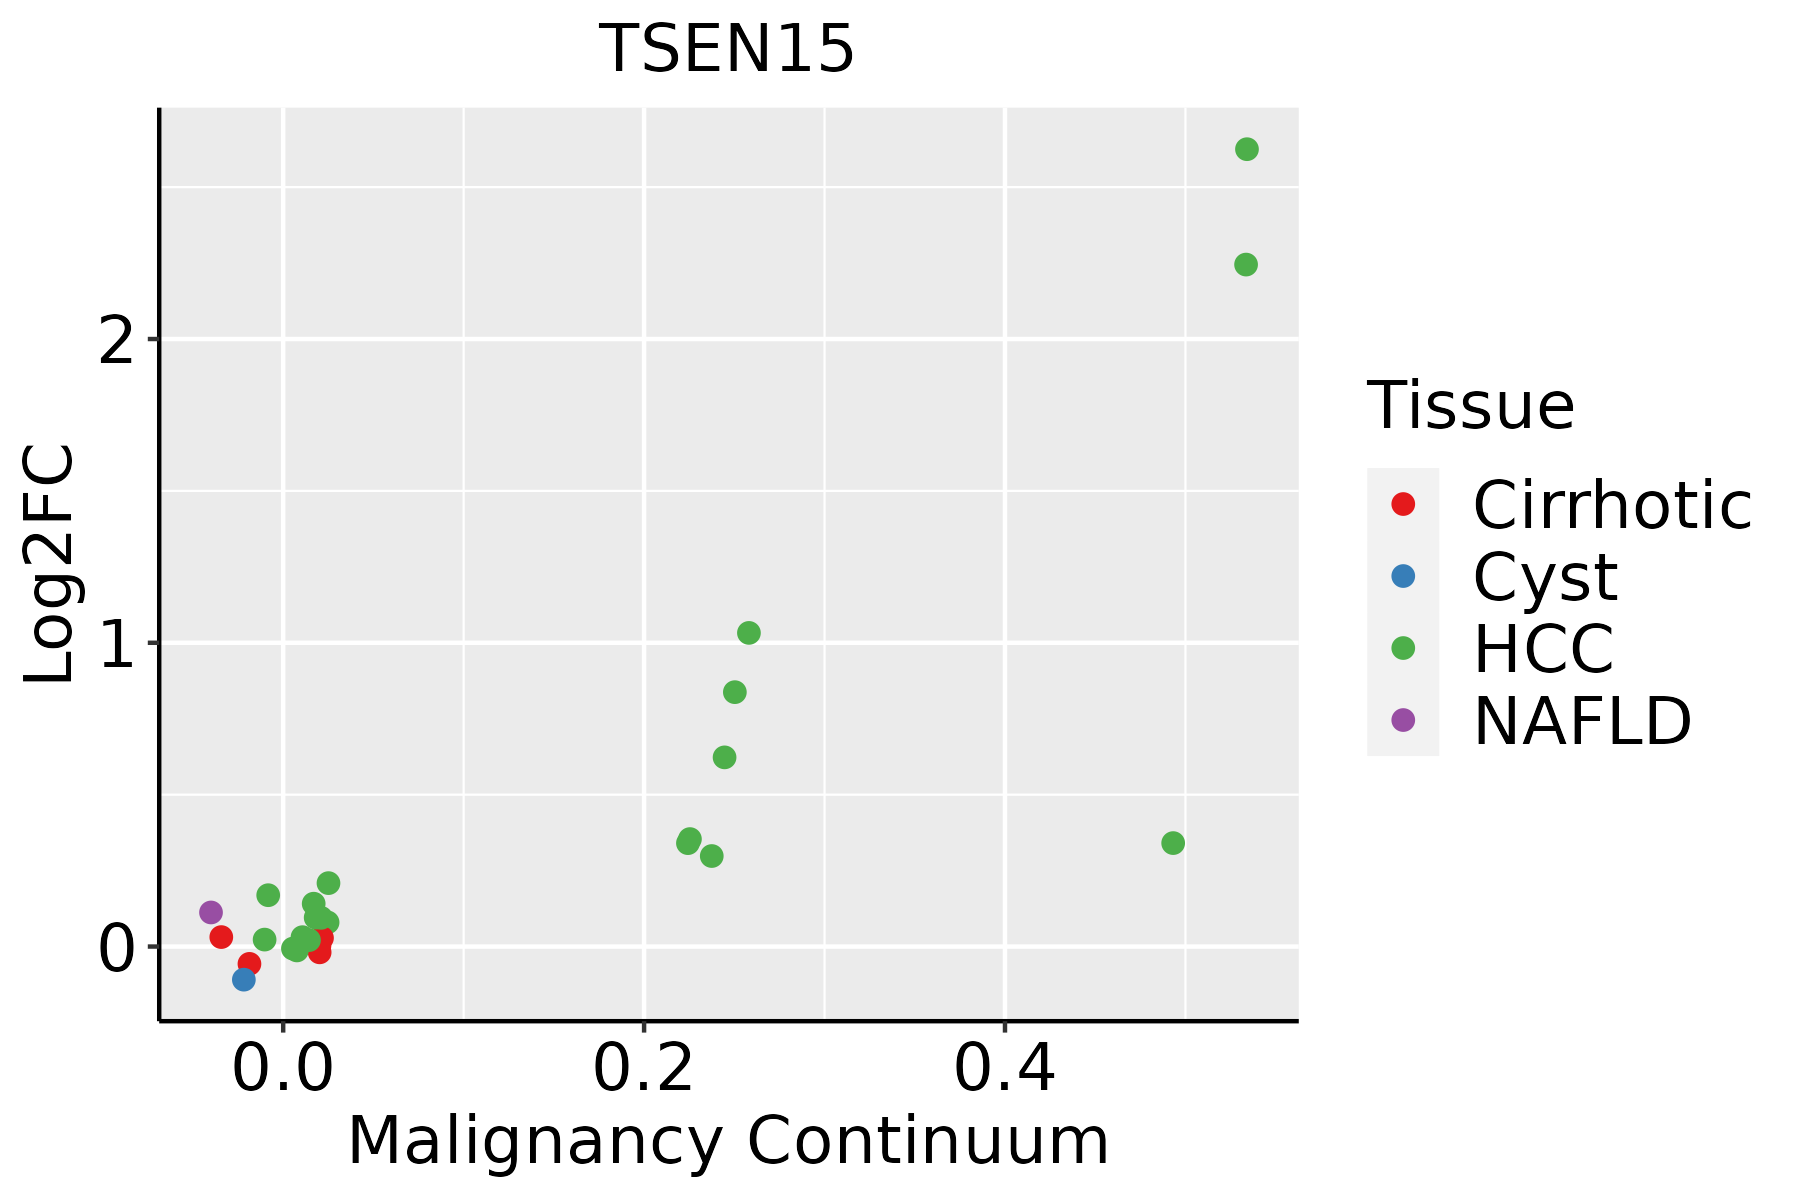 | HCC: Hepatocellular carcinoma |
| NAFLD: Non-alcoholic fatty liver disease | ||
| Oral Cavity | 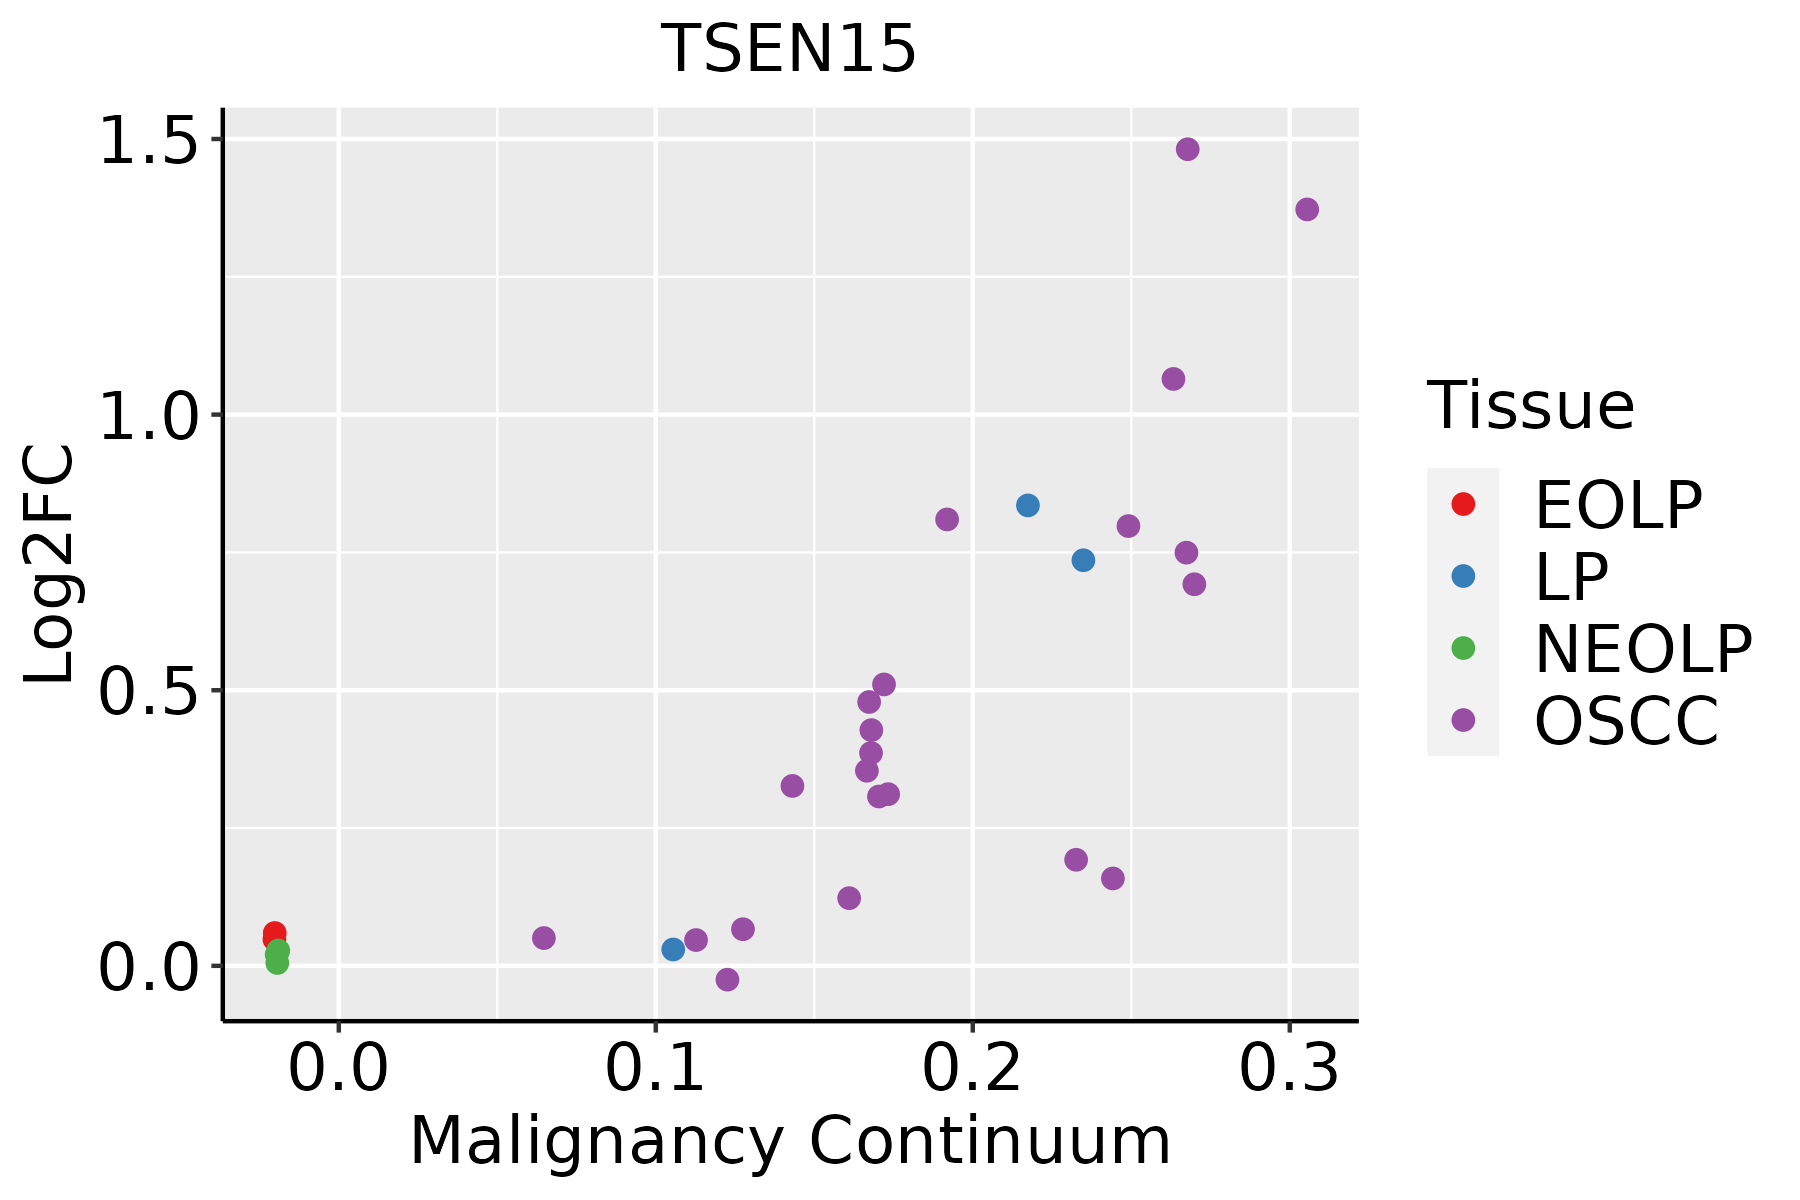 | EOLP: Erosive Oral lichen planus |
| LP: leukoplakia | ||
| NEOLP: Non-erosive oral lichen planus | ||
| OSCC: Oral squamous cell carcinoma | ||
| Skin | 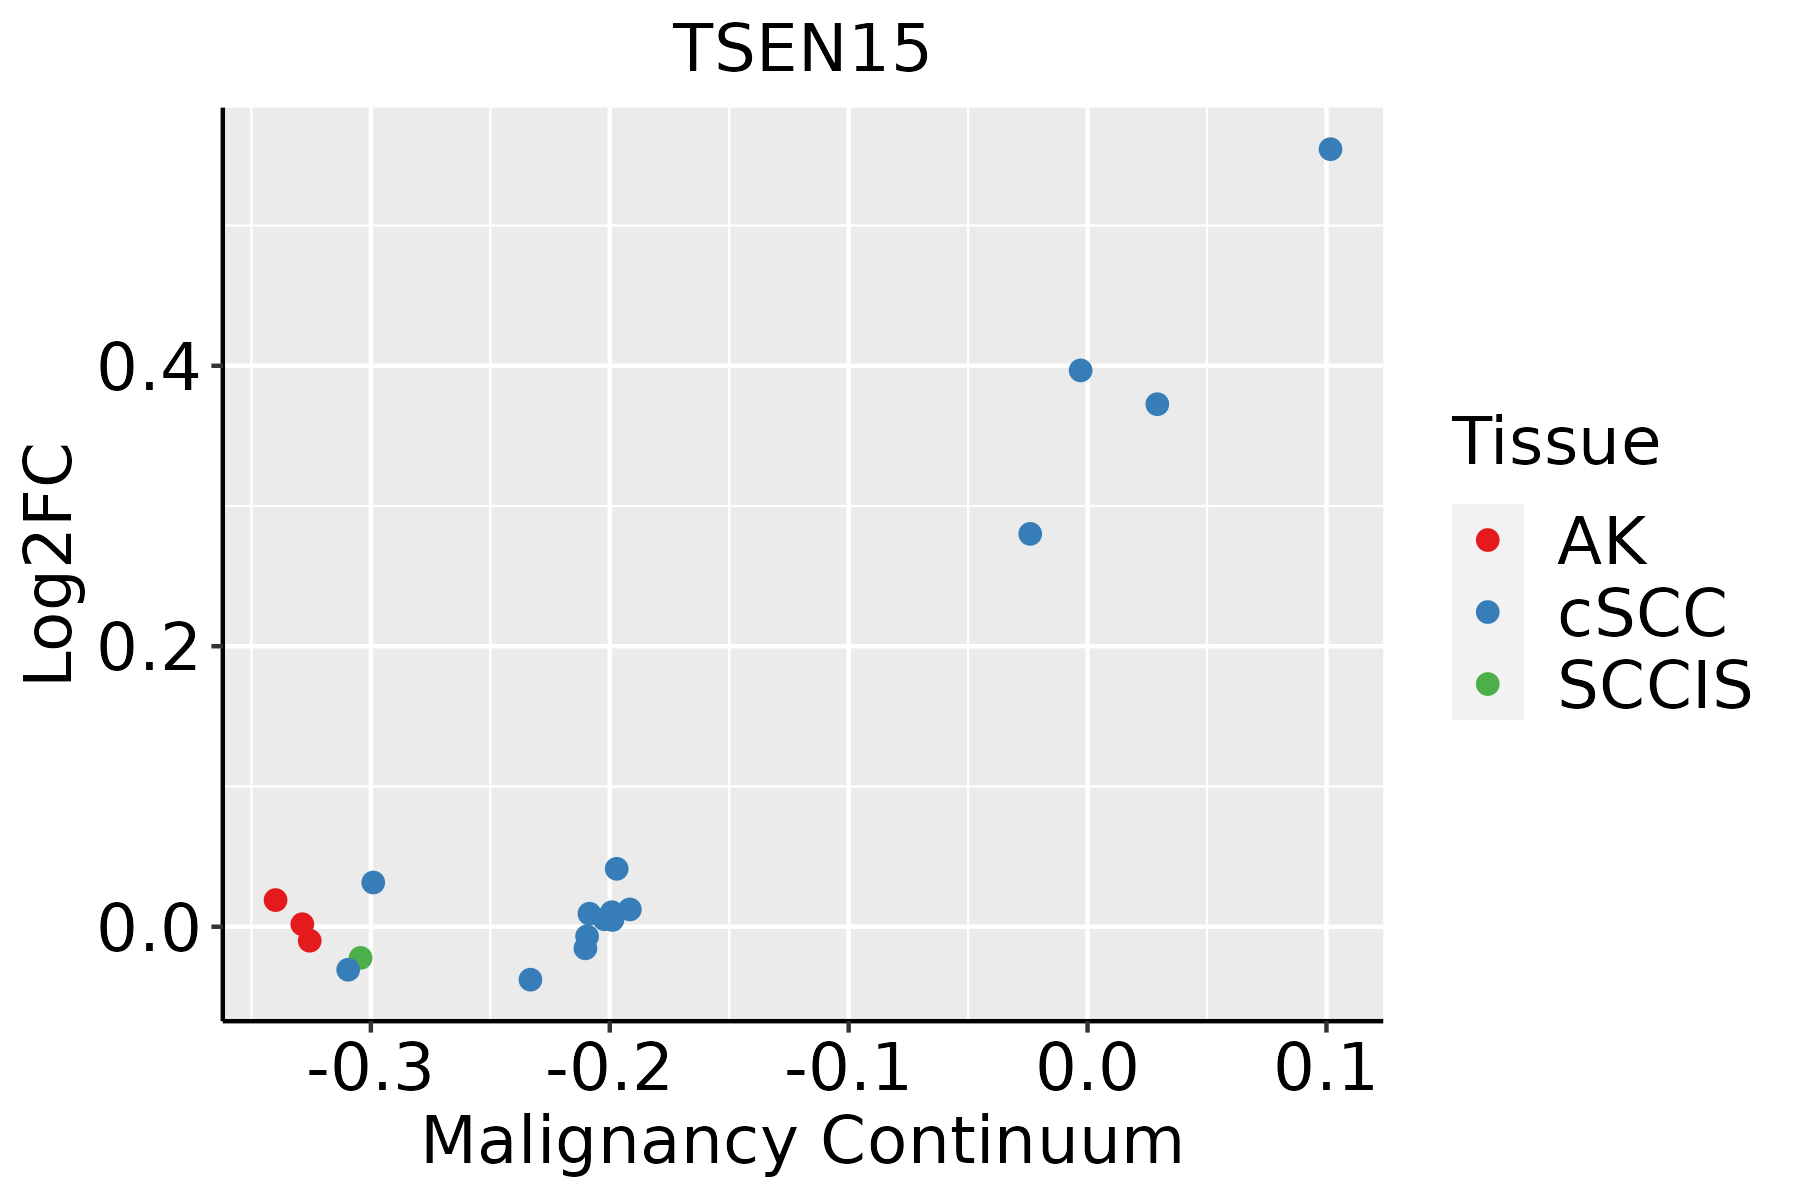 | AK: Actinic keratosis |
| cSCC: Cutaneous squamous cell carcinoma | ||
| SCCIS:squamous cell carcinoma in situ | ||
| Thyroid | 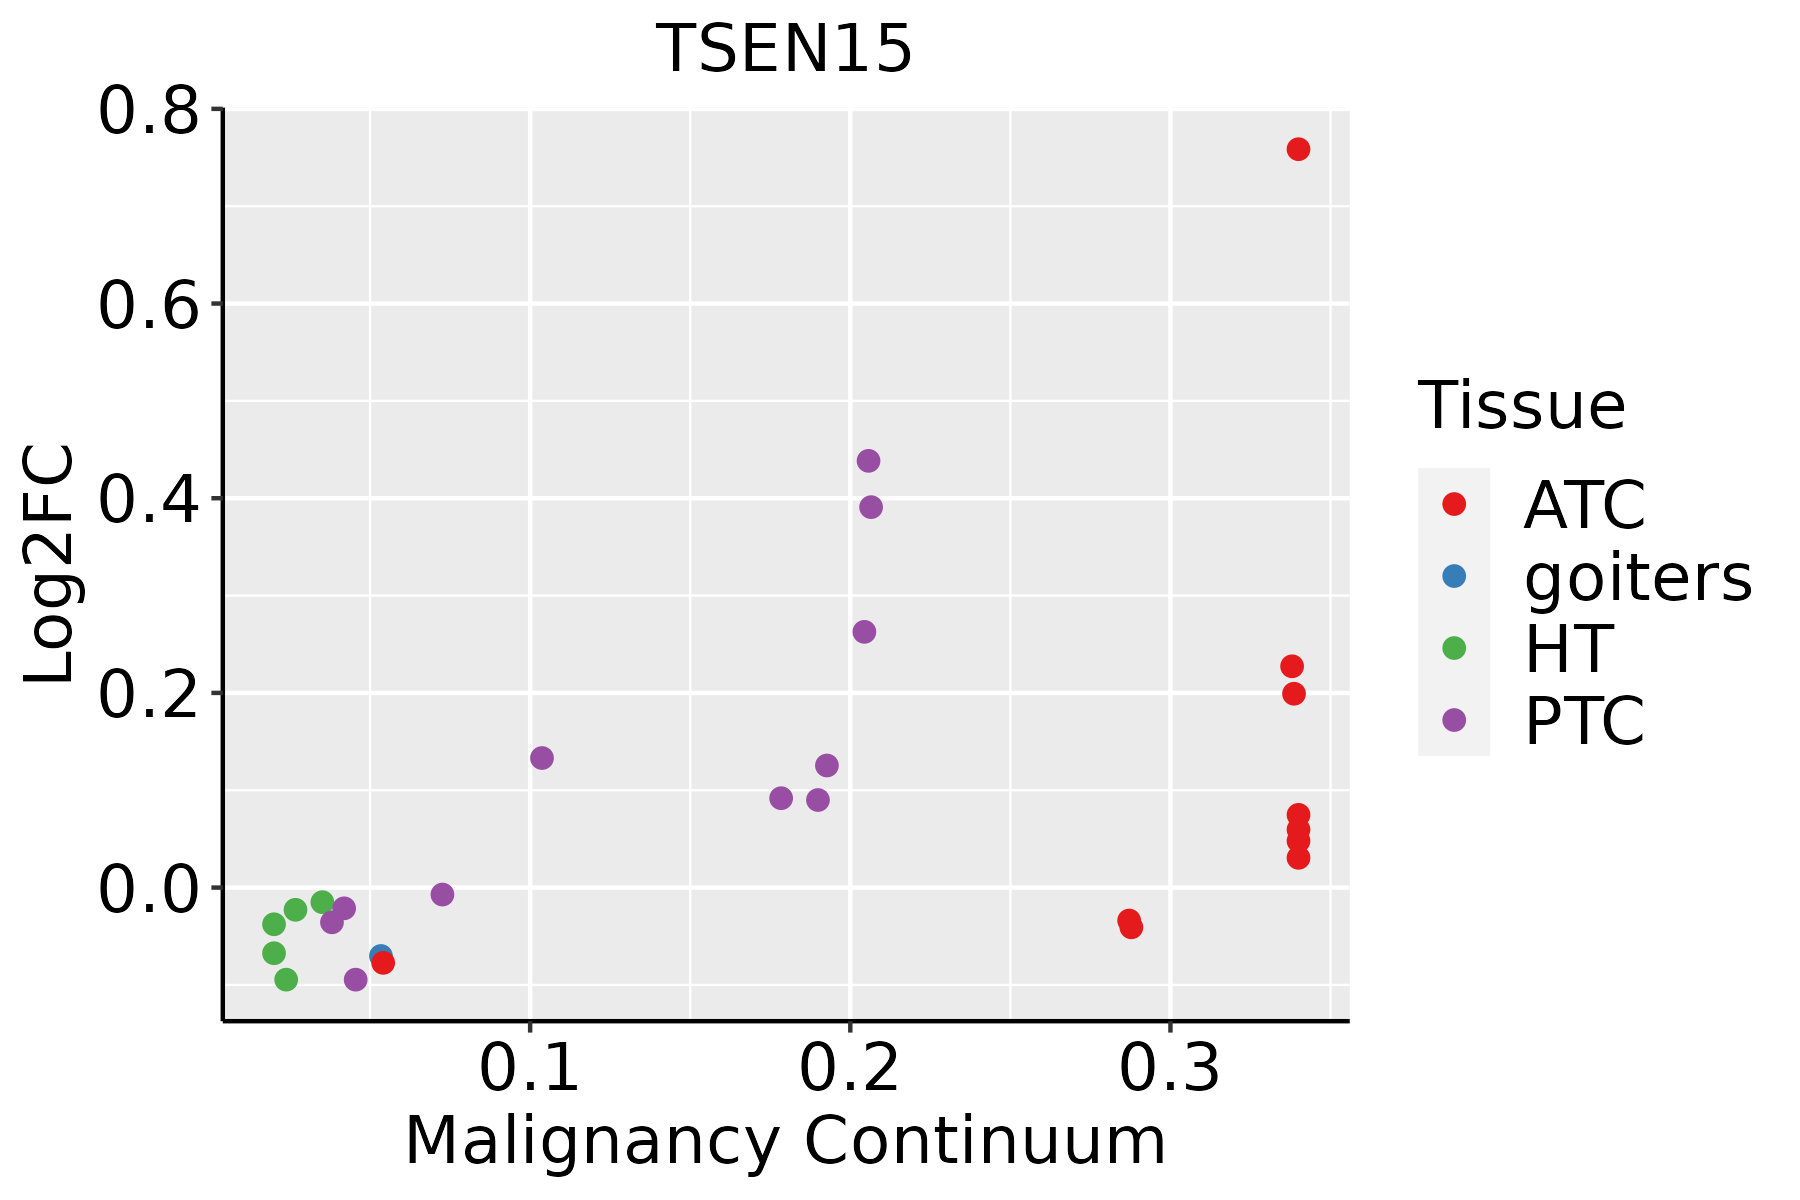 | ATC: Anaplastic thyroid cancer |
| HT: Hashimoto's thyroiditis | ||
| PTC: Papillary thyroid cancer |
| ∗log2FC in expression of this searched gene in stem-like cells from each diseased tissue sample relative to stem-like cells in normal samples in each tissue plotted against the malignancy continuum. Samples are colored based on if they are from different disease stage. |
Top |
Malignant transformation related pathway analysis |
| Find out the enriched GO biological processes and KEGG pathways involved in transition from healthy to precancer to cancer |
| Tissue | Disease Stage | Enriched GO biological Processes |
| Colorectum | AD |  |
| Colorectum | SER |  |
| Colorectum | MSS |  |
| Colorectum | MSI-H |  |
| Colorectum | FAP |  |
| ∗Top 15 enriched GO BP terms are showed in the bar plot of each disease state in each tissue. Each row represents a significant GO biological process which is colored according to the -log10(p.adjust). |
| Page: 1 2 3 4 5 6 7 8 9 |
| GO ID | Tissue | Disease Stage | Description | Gene Ratio | Bg Ratio | pvalue | p.adjust | Count |
| GO:000838026 | Esophagus | HGIN | RNA splicing | 160/2587 | 434/18723 | 3.74e-34 | 1.12e-30 | 160 |
| GO:003447010 | Esophagus | HGIN | ncRNA processing | 97/2587 | 395/18723 | 5.92e-09 | 3.90e-07 | 97 |
| GO:00346606 | Esophagus | HGIN | ncRNA metabolic process | 104/2587 | 485/18723 | 2.26e-06 | 8.23e-05 | 104 |
| GO:00003942 | Esophagus | HGIN | RNA splicing, via endonucleolytic cleavage and ligation | 6/2587 | 11/18723 | 1.71e-03 | 1.86e-02 | 6 |
| GO:0008380111 | Esophagus | ESCC | RNA splicing | 336/8552 | 434/18723 | 1.74e-42 | 3.67e-39 | 336 |
| GO:003447015 | Esophagus | ESCC | ncRNA processing | 300/8552 | 395/18723 | 3.09e-35 | 3.26e-32 | 300 |
| GO:003466012 | Esophagus | ESCC | ncRNA metabolic process | 346/8552 | 485/18723 | 4.35e-31 | 2.51e-28 | 346 |
| GO:00080333 | Esophagus | ESCC | tRNA processing | 92/8552 | 127/18723 | 7.83e-10 | 1.93e-08 | 92 |
| GO:00063992 | Esophagus | ESCC | tRNA metabolic process | 122/8552 | 179/18723 | 9.03e-10 | 2.19e-08 | 122 |
| GO:00903053 | Esophagus | ESCC | nucleic acid phosphodiester bond hydrolysis | 163/8552 | 261/18723 | 3.07e-08 | 5.73e-07 | 163 |
| GO:00344702 | Liver | HCC | ncRNA processing | 293/7958 | 395/18723 | 4.26e-38 | 6.76e-35 | 293 |
| GO:000838022 | Liver | HCC | RNA splicing | 313/7958 | 434/18723 | 1.36e-36 | 1.73e-33 | 313 |
| GO:00346601 | Liver | HCC | ncRNA metabolic process | 332/7958 | 485/18723 | 1.48e-31 | 7.80e-29 | 332 |
| GO:0008033 | Liver | HCC | tRNA processing | 87/7958 | 127/18723 | 2.66e-09 | 7.23e-08 | 87 |
| GO:0090305 | Liver | HCC | nucleic acid phosphodiester bond hydrolysis | 152/7958 | 261/18723 | 1.90e-07 | 3.46e-06 | 152 |
| GO:0006399 | Liver | HCC | tRNA metabolic process | 108/7958 | 179/18723 | 1.07e-06 | 1.59e-05 | 108 |
| GO:000838020 | Oral cavity | OSCC | RNA splicing | 308/7305 | 434/18723 | 2.43e-42 | 7.70e-39 | 308 |
| GO:00344709 | Oral cavity | OSCC | ncRNA processing | 263/7305 | 395/18723 | 4.38e-29 | 2.78e-26 | 263 |
| GO:00346605 | Oral cavity | OSCC | ncRNA metabolic process | 296/7305 | 485/18723 | 2.94e-23 | 6.65e-21 | 296 |
| GO:00080332 | Oral cavity | OSCC | tRNA processing | 78/7305 | 127/18723 | 2.56e-07 | 4.00e-06 | 78 |
| Page: 1 2 3 |
| Pathway ID | Tissue | Disease Stage | Description | Gene Ratio | Bg Ratio | pvalue | p.adjust | qvalue | Count |
| Page: 1 |
Top |
Cell-cell communication analysis |
| Identification of potential cell-cell interactions between two cell types and their ligand-receptor pairs for different disease states |
| Ligand | Receptor | LRpair | Pathway | Tissue | Disease Stage |
| Page: 1 |
Top |
Single-cell gene regulatory network inference analysis |
| Find out the significant the regulons (TFs) and the target genes of each regulon across cell types for different disease states |
| TF | Cell Type | Tissue | Disease Stage | Target Gene | RSS | Regulon Activity |
| ∗The dot plots of a searched regulon are shown for all cell subpopulations in each disease state of each tissue based on the regulon specific score inferred using pySCENIC and by calculating the average expression. |
| Page: 1 |
Top |
Somatic mutation of malignant transformation related genes |
| Annotation of somatic variants for genes involved in malignant transformation |
| Hugo Symbol | Variant Class | Variant Classification | dbSNP RS | HGVSc | HGVSp | HGVSp Short | SWISSPROT | BIOTYPE | SIFT | PolyPhen | Tumor Sample Barcode | Tissue | Histology | Sex | Age | Stage | Therapy Types | Drugs | Outcome |
| TSEN15 | SNV | Missense_Mutation | novel | c.280N>T | p.Gly94Cys | p.G94C | Q8WW01 | protein_coding | deleterious(0) | probably_damaging(0.964) | TCGA-E2-A15E-01 | Breast | breast invasive carcinoma | Female | <65 | I/II | Chemotherapy | doxorubicin | SD |
| TSEN15 | SNV | Missense_Mutation | c.288G>T | p.Glu96Asp | p.E96D | Q8WW01 | protein_coding | deleterious(0.04) | probably_damaging(0.945) | TCGA-FU-A3HZ-01 | Cervix | cervical & endocervical cancer | Female | <65 | I/II | Chemotherapy | cisplatin | CR | |
| TSEN15 | SNV | Missense_Mutation | novel | c.76G>A | p.Asp26Asn | p.D26N | Q8WW01 | protein_coding | tolerated_low_confidence(0.51) | benign(0.003) | TCGA-VS-A9V3-01 | Cervix | cervical & endocervical cancer | Female | <65 | I/II | Chemotherapy | cisplatin | PD |
| TSEN15 | SNV | Missense_Mutation | c.413C>T | p.Ser138Phe | p.S138F | Q8WW01 | protein_coding | deleterious(0.04) | probably_damaging(0.997) | TCGA-CK-4951-01 | Colorectum | colon adenocarcinoma | Female | >=65 | I/II | Unknown | Unknown | PD | |
| TSEN15 | SNV | Missense_Mutation | c.467N>T | p.Thr156Ile | p.T156I | Q8WW01 | protein_coding | deleterious(0.01) | probably_damaging(0.995) | TCGA-D5-6928-01 | Colorectum | colon adenocarcinoma | Male | >=65 | I/II | Unknown | Unknown | SD | |
| TSEN15 | SNV | Missense_Mutation | c.503C>A | p.Ser168Tyr | p.S168Y | Q8WW01 | protein_coding | deleterious_low_confidence(0.01) | benign(0.28) | TCGA-AG-A002-01 | Colorectum | rectum adenocarcinoma | Male | <65 | I/II | Unknown | Unknown | SD | |
| TSEN15 | SNV | Missense_Mutation | c.391G>A | p.Gly131Ser | p.G131S | Q8WW01 | protein_coding | tolerated(0.61) | benign(0) | TCGA-AG-A02X-01 | Colorectum | rectum adenocarcinoma | Male | >=65 | I/II | Unknown | Unknown | SD | |
| TSEN15 | SNV | Missense_Mutation | c.503C>A | p.Ser168Tyr | p.S168Y | Q8WW01 | protein_coding | deleterious_low_confidence(0.01) | benign(0.28) | TCGA-F5-6814-01 | Colorectum | rectum adenocarcinoma | Male | <65 | I/II | Unknown | Unknown | SD | |
| TSEN15 | deletion | Frame_Shift_Del | c.323delN | p.Ile110SerfsTer10 | p.I110Sfs*10 | Q8WW01 | protein_coding | TCGA-AA-3715-01 | Colorectum | colon adenocarcinoma | Male | >=65 | I/II | Unknown | Unknown | PD | |||
| TSEN15 | SNV | Missense_Mutation | novel | c.185N>A | p.Val62Glu | p.V62E | Q8WW01 | protein_coding | deleterious(0.05) | possibly_damaging(0.492) | TCGA-AX-A3G9-01 | Endometrium | uterine corpus endometrioid carcinoma | Female | <65 | III/IV | Chemotherapy | carboplatin | SD |
| Page: 1 2 |
Top |
Related drugs of malignant transformation related genes |
| Identification of chemicals and drugs interact with genes involved in malignant transfromation |
| (DGIdb 4.0) |
| Entrez ID | Symbol | Category | Interaction Types | Drug Claim Name | Drug Name | PMIDs |
| Page: 1 |

Copyright 2023-Present -The University of Texas Health Science Center at Houston |