
|
|||||
|
 | |
| |
| |
| |
| |
| |
|
Gene: TSC22D4 |
Gene summary for TSC22D4 |
| Gene information | Species | Human | Gene symbol | TSC22D4 | Gene ID | 81628 |
| Gene name | TSC22 domain family member 4 | |
| Gene Alias | THG-1 | |
| Cytomap | 7q22.1 | |
| Gene Type | protein-coding | GO ID | GO:0006139 | UniProtAcc | B4DKI8 |
Top |
Malignant transformation analysis |
| Identification of the aberrant gene expression in precancerous and cancerous lesions by comparing the gene expression of stem-like cells in diseased tissues with normal stem cells |
| Entrez ID | Symbol | Replicates | Species | Organ | Tissue | Adj P-value | Log2FC | Malignancy |
| 81628 | TSC22D4 | LZE2T | Human | Esophagus | ESCC | 4.88e-02 | 4.11e-01 | 0.082 |
| 81628 | TSC22D4 | LZE4T | Human | Esophagus | ESCC | 4.03e-12 | 1.95e-01 | 0.0811 |
| 81628 | TSC22D4 | LZE7T | Human | Esophagus | ESCC | 2.85e-07 | 2.64e-01 | 0.0667 |
| 81628 | TSC22D4 | LZE8T | Human | Esophagus | ESCC | 9.22e-07 | 1.82e-01 | 0.067 |
| 81628 | TSC22D4 | LZE20T | Human | Esophagus | ESCC | 4.66e-05 | 2.48e-01 | 0.0662 |
| 81628 | TSC22D4 | LZE22T | Human | Esophagus | ESCC | 4.07e-09 | 5.04e-01 | 0.068 |
| 81628 | TSC22D4 | LZE24T | Human | Esophagus | ESCC | 1.84e-22 | 5.80e-01 | 0.0596 |
| 81628 | TSC22D4 | LZE21T | Human | Esophagus | ESCC | 2.98e-02 | 2.18e-01 | 0.0655 |
| 81628 | TSC22D4 | LZE6T | Human | Esophagus | ESCC | 8.22e-06 | 3.07e-01 | 0.0845 |
| 81628 | TSC22D4 | P1T-E | Human | Esophagus | ESCC | 5.65e-17 | 6.46e-01 | 0.0875 |
| 81628 | TSC22D4 | P2T-E | Human | Esophagus | ESCC | 3.67e-65 | 9.79e-01 | 0.1177 |
| 81628 | TSC22D4 | P4T-E | Human | Esophagus | ESCC | 4.57e-21 | 3.94e-01 | 0.1323 |
| 81628 | TSC22D4 | P5T-E | Human | Esophagus | ESCC | 6.45e-21 | 2.19e-01 | 0.1327 |
| 81628 | TSC22D4 | P8T-E | Human | Esophagus | ESCC | 2.03e-30 | 5.67e-01 | 0.0889 |
| 81628 | TSC22D4 | P9T-E | Human | Esophagus | ESCC | 5.35e-15 | 3.48e-01 | 0.1131 |
| 81628 | TSC22D4 | P10T-E | Human | Esophagus | ESCC | 1.19e-35 | 5.82e-01 | 0.116 |
| 81628 | TSC22D4 | P11T-E | Human | Esophagus | ESCC | 7.44e-24 | 6.33e-01 | 0.1426 |
| 81628 | TSC22D4 | P12T-E | Human | Esophagus | ESCC | 5.06e-41 | 6.73e-01 | 0.1122 |
| 81628 | TSC22D4 | P15T-E | Human | Esophagus | ESCC | 9.75e-40 | 9.03e-01 | 0.1149 |
| 81628 | TSC22D4 | P16T-E | Human | Esophagus | ESCC | 1.04e-51 | 9.21e-01 | 0.1153 |
| Page: 1 2 3 4 5 6 |
| Tissue | Expression Dynamics | Abbreviation |
| Esophagus | 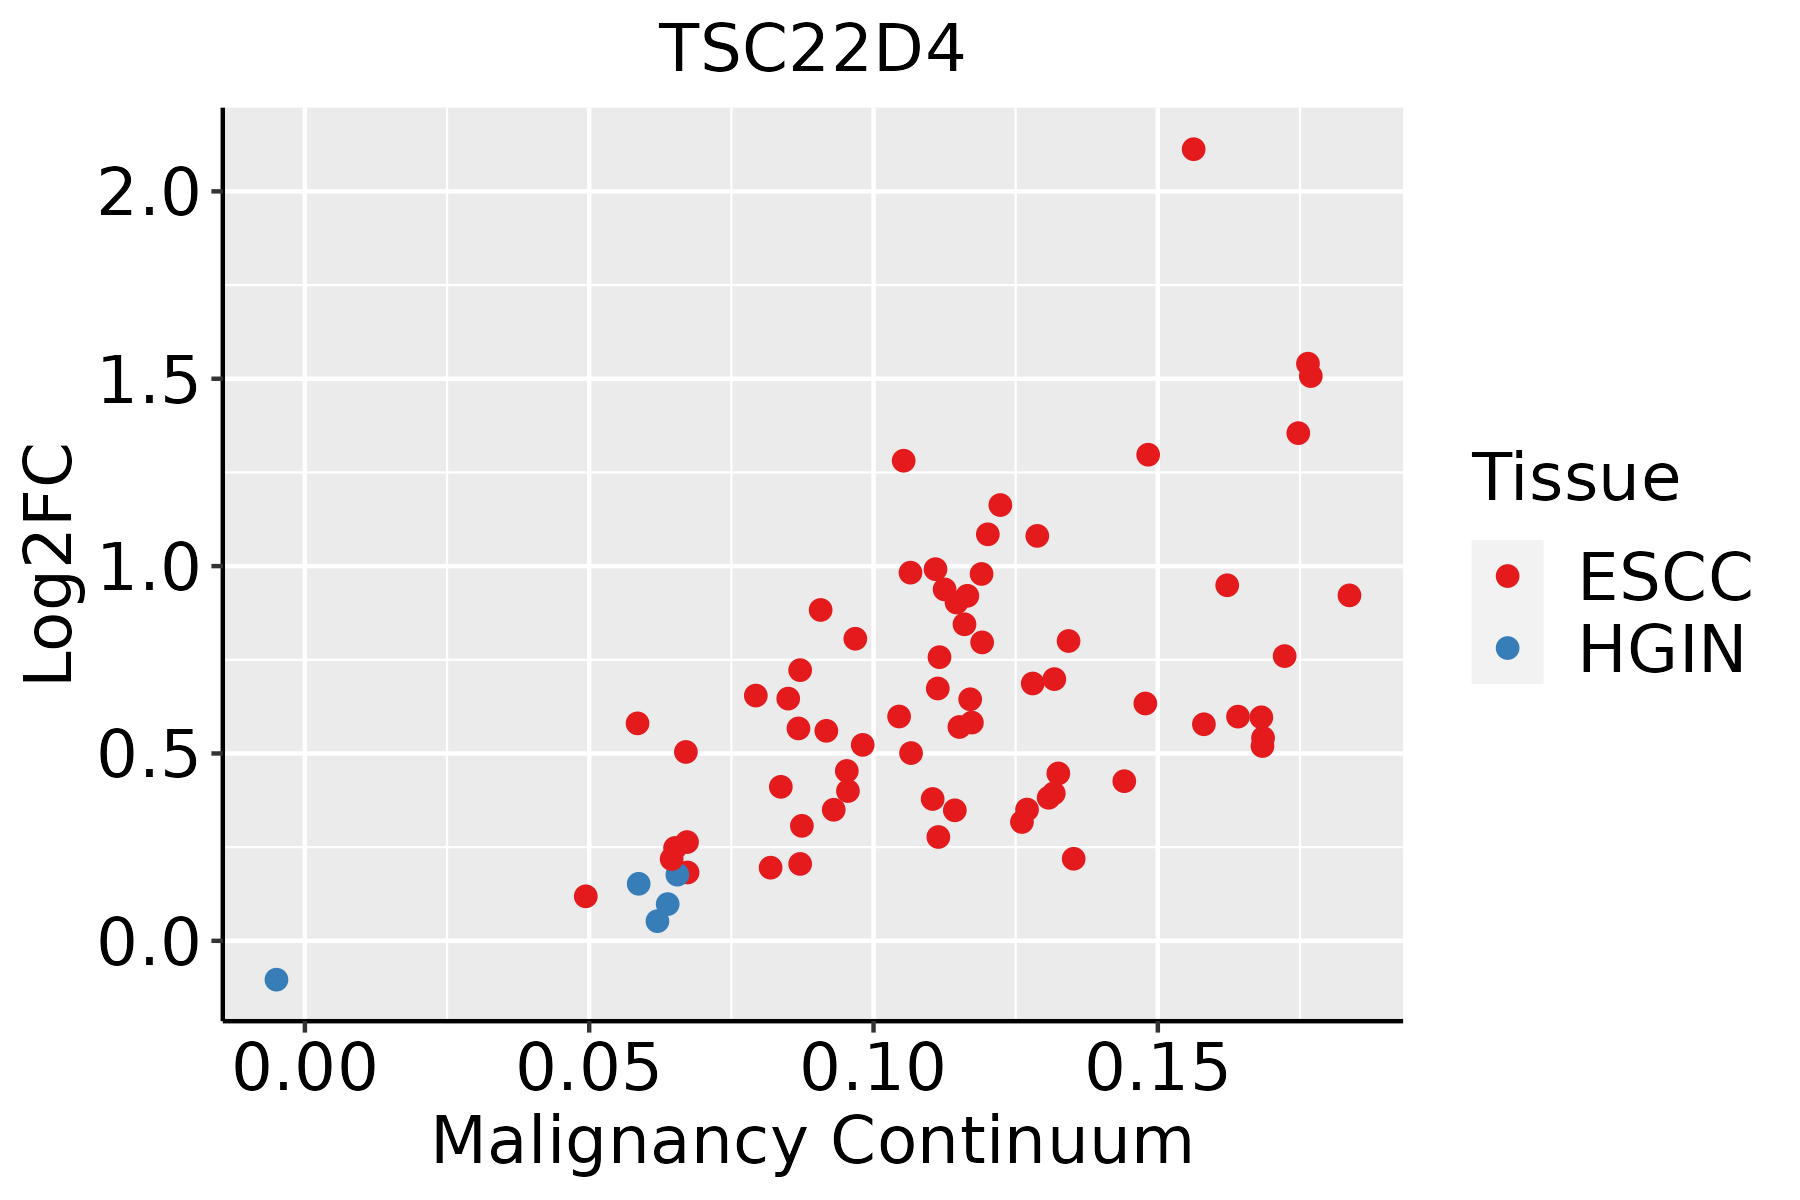 | ESCC: Esophageal squamous cell carcinoma |
| HGIN: High-grade intraepithelial neoplasias | ||
| LGIN: Low-grade intraepithelial neoplasias | ||
| Liver | 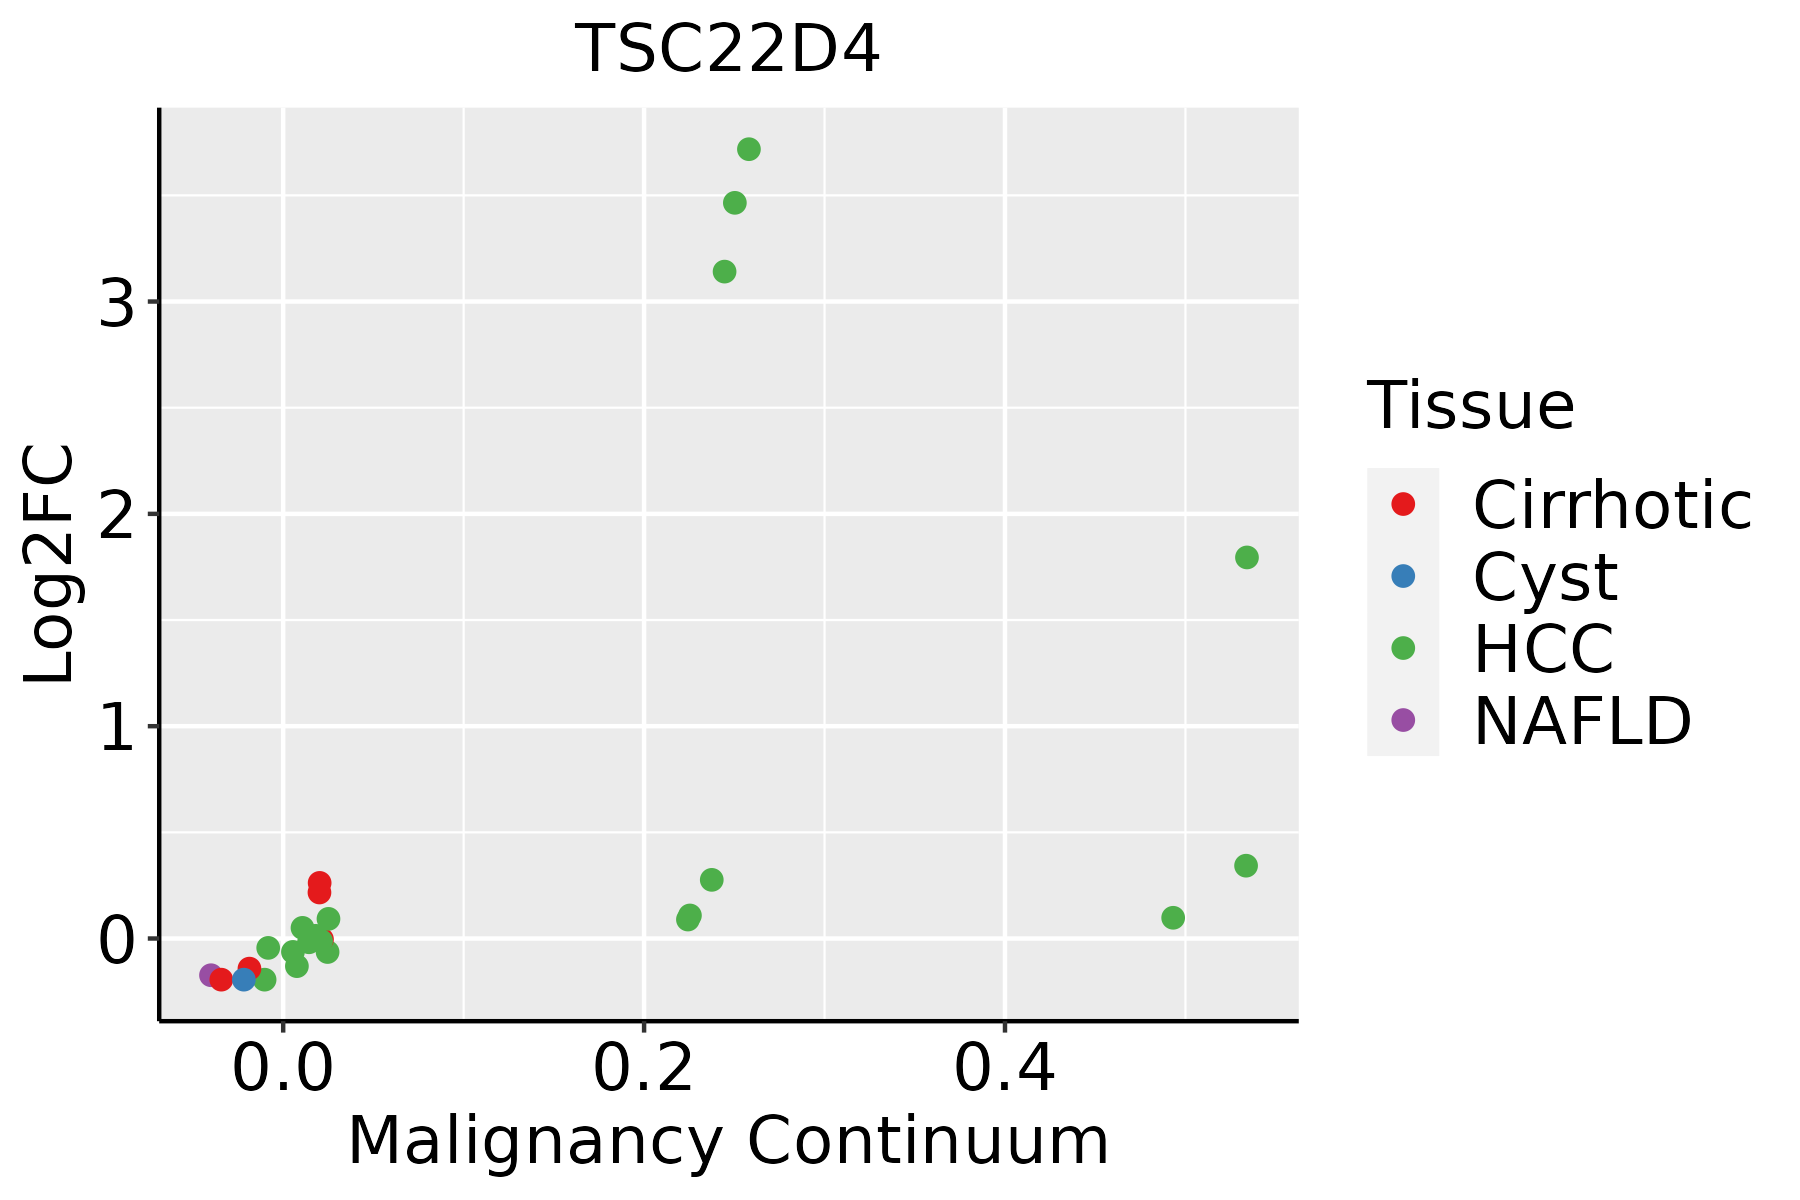 | HCC: Hepatocellular carcinoma |
| NAFLD: Non-alcoholic fatty liver disease | ||
| Oral Cavity |  | EOLP: Erosive Oral lichen planus |
| LP: leukoplakia | ||
| NEOLP: Non-erosive oral lichen planus | ||
| OSCC: Oral squamous cell carcinoma | ||
| Prostate |  | BPH: Benign Prostatic Hyperplasia |
| Skin | 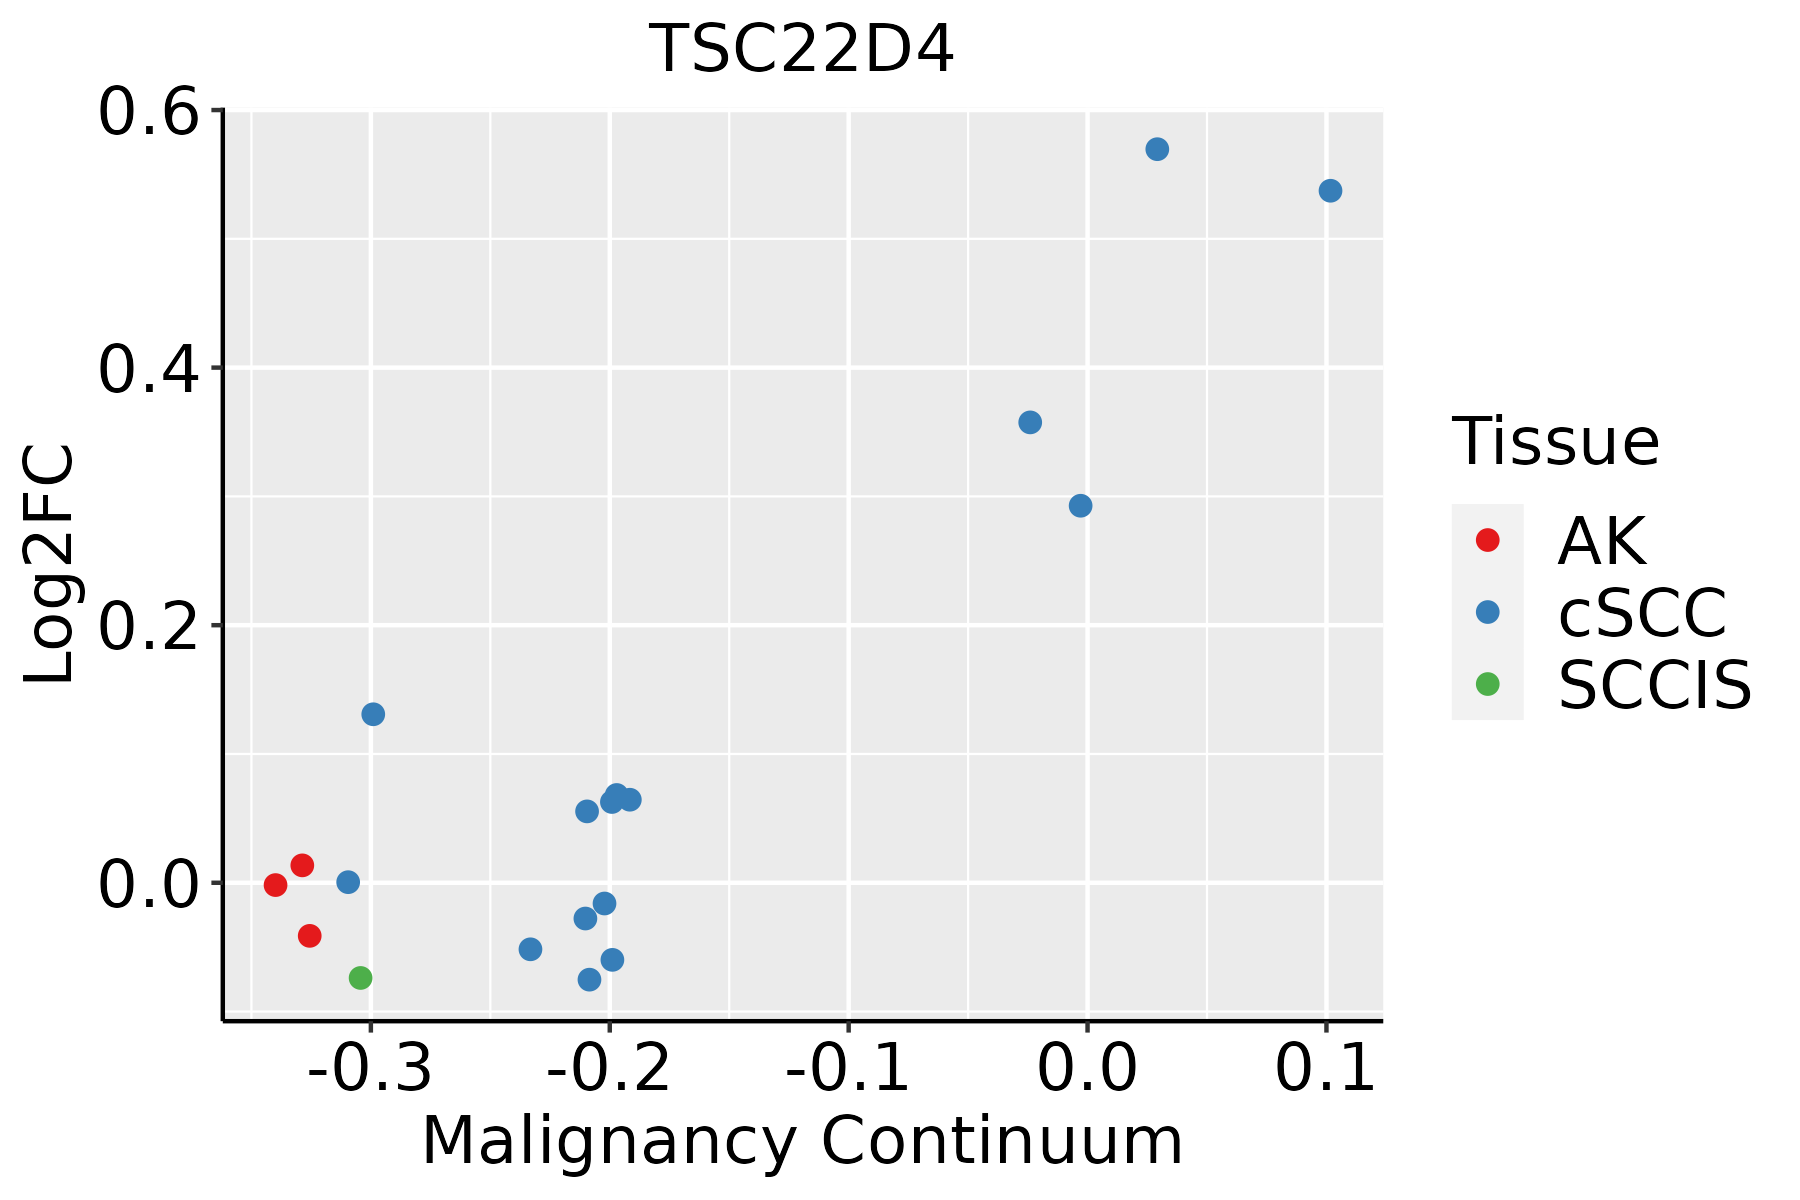 | AK: Actinic keratosis |
| cSCC: Cutaneous squamous cell carcinoma | ||
| SCCIS:squamous cell carcinoma in situ | ||
| Thyroid | 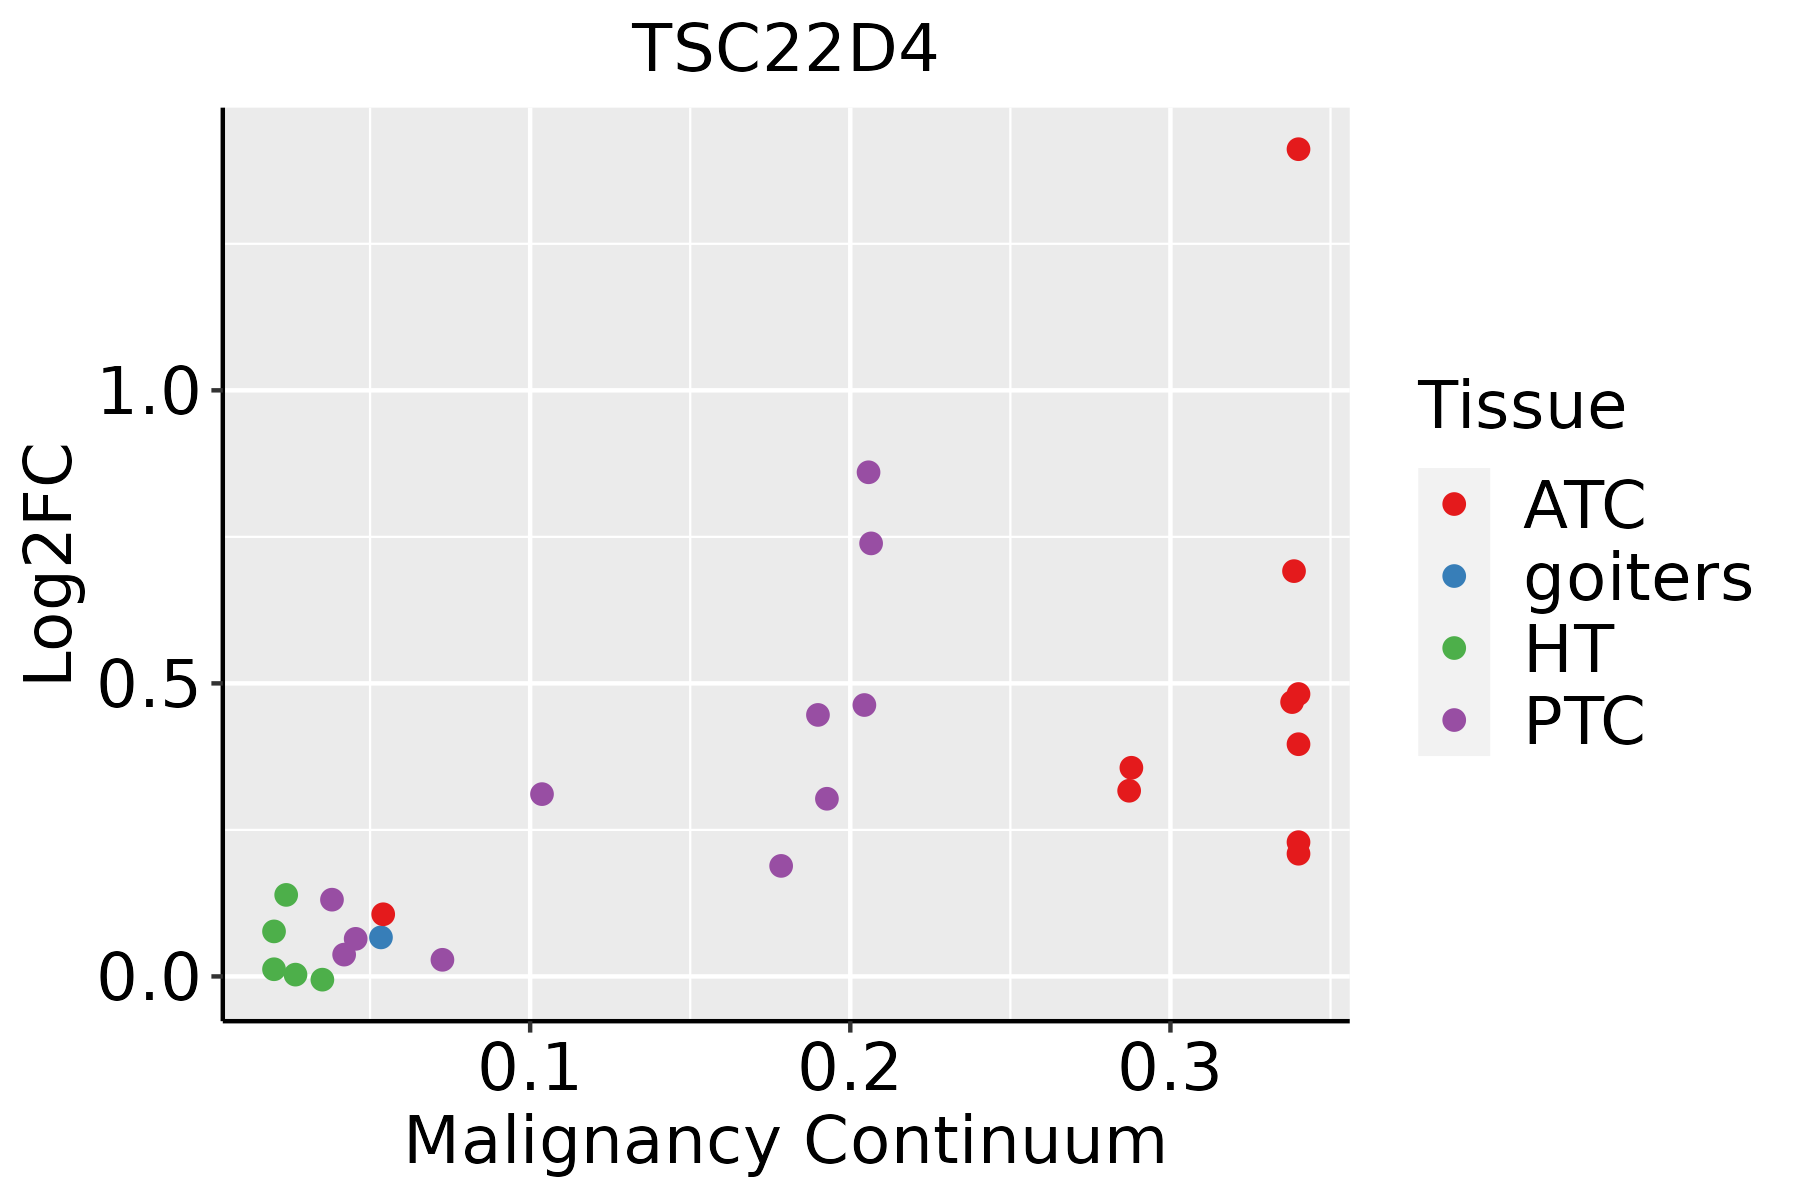 | ATC: Anaplastic thyroid cancer |
| HT: Hashimoto's thyroiditis | ||
| PTC: Papillary thyroid cancer |
| ∗log2FC in expression of this searched gene in stem-like cells from each diseased tissue sample relative to stem-like cells in normal samples in each tissue plotted against the malignancy continuum. Samples are colored based on if they are from different disease stage. |
Top |
Malignant transformation related pathway analysis |
| Find out the enriched GO biological processes and KEGG pathways involved in transition from healthy to precancer to cancer |
| Tissue | Disease Stage | Enriched GO biological Processes |
| Colorectum | AD |  |
| Colorectum | SER |  |
| Colorectum | MSS |  |
| Colorectum | MSI-H |  |
| Colorectum | FAP |  |
| ∗Top 15 enriched GO BP terms are showed in the bar plot of each disease state in each tissue. Each row represents a significant GO biological process which is colored according to the -log10(p.adjust). |
| Page: 1 2 3 4 5 6 7 8 9 |
| GO ID | Tissue | Disease Stage | Description | Gene Ratio | Bg Ratio | pvalue | p.adjust | Count |
| GO:00069707 | Esophagus | ESCC | response to osmotic stress | 57/8552 | 84/18723 | 3.26e-05 | 2.70e-04 | 57 |
| GO:000697011 | Liver | Cirrhotic | response to osmotic stress | 34/4634 | 84/18723 | 1.06e-03 | 7.40e-03 | 34 |
| GO:00069702 | Liver | HCC | response to osmotic stress | 52/7958 | 84/18723 | 2.58e-04 | 1.92e-03 | 52 |
| GO:00069706 | Oral cavity | OSCC | response to osmotic stress | 50/7305 | 84/18723 | 1.11e-04 | 8.15e-04 | 50 |
| GO:000697014 | Oral cavity | LP | response to osmotic stress | 32/4623 | 84/18723 | 4.36e-03 | 2.79e-02 | 32 |
| GO:00069705 | Prostate | BPH | response to osmotic stress | 27/3107 | 84/18723 | 3.35e-04 | 2.52e-03 | 27 |
| GO:000697013 | Prostate | Tumor | response to osmotic stress | 26/3246 | 84/18723 | 1.58e-03 | 9.63e-03 | 26 |
| GO:000697021 | Skin | cSCC | response to osmotic stress | 35/4864 | 84/18723 | 1.23e-03 | 7.97e-03 | 35 |
| GO:00069709 | Thyroid | PTC | response to osmotic stress | 42/5968 | 84/18723 | 4.07e-04 | 2.73e-03 | 42 |
| GO:000697016 | Thyroid | ATC | response to osmotic stress | 45/6293 | 84/18723 | 1.27e-04 | 9.03e-04 | 45 |
| Page: 1 |
| Pathway ID | Tissue | Disease Stage | Description | Gene Ratio | Bg Ratio | pvalue | p.adjust | qvalue | Count |
| Page: 1 |
Top |
Cell-cell communication analysis |
| Identification of potential cell-cell interactions between two cell types and their ligand-receptor pairs for different disease states |
| Ligand | Receptor | LRpair | Pathway | Tissue | Disease Stage |
| Page: 1 |
Top |
Single-cell gene regulatory network inference analysis |
| Find out the significant the regulons (TFs) and the target genes of each regulon across cell types for different disease states |
| TF | Cell Type | Tissue | Disease Stage | Target Gene | RSS | Regulon Activity |
| TSC22D4 | CD8TCM | Skin | Healthy | LIMD2,EVL,ZNF683, etc. | 8.11e-02 |  |
| ∗The dot plots of a searched regulon are shown for all cell subpopulations in each disease state of each tissue based on the regulon specific score inferred using pySCENIC and by calculating the average expression. |
| Page: 1 |
Top |
Somatic mutation of malignant transformation related genes |
| Annotation of somatic variants for genes involved in malignant transformation |
| Hugo Symbol | Variant Class | Variant Classification | dbSNP RS | HGVSc | HGVSp | HGVSp Short | SWISSPROT | BIOTYPE | SIFT | PolyPhen | Tumor Sample Barcode | Tissue | Histology | Sex | Age | Stage | Therapy Types | Drugs | Outcome |
| TSC22D4 | SNV | Missense_Mutation | c.664N>A | p.Ala222Thr | p.A222T | Q9Y3Q8 | protein_coding | tolerated_low_confidence(0.15) | benign(0.055) | TCGA-AO-A128-01 | Breast | breast invasive carcinoma | Female | <65 | I/II | Chemotherapy | doxorubicin | SD | |
| TSC22D4 | SNV | Missense_Mutation | c.745N>G | p.Pro249Ala | p.P249A | Q9Y3Q8 | protein_coding | deleterious_low_confidence(0.01) | benign(0.068) | TCGA-IR-A3LH-01 | Cervix | cervical & endocervical cancer | Female | <65 | I/II | Chemotherapy | cisplatin | CR | |
| TSC22D4 | SNV | Missense_Mutation | novel | c.854N>T | p.Ala285Val | p.A285V | Q9Y3Q8 | protein_coding | tolerated(0.07) | benign(0.068) | TCGA-ZJ-AB0I-01 | Cervix | cervical & endocervical cancer | Female | <65 | I/II | Unknown | Unknown | SD |
| TSC22D4 | SNV | Missense_Mutation | c.1073T>C | p.Leu358Pro | p.L358P | Q9Y3Q8 | protein_coding | deleterious(0) | probably_damaging(0.999) | TCGA-AA-3492-01 | Colorectum | colon adenocarcinoma | Female | >=65 | I/II | Unknown | Unknown | SD | |
| TSC22D4 | SNV | Missense_Mutation | c.1012N>T | p.Arg338Trp | p.R338W | Q9Y3Q8 | protein_coding | deleterious(0) | possibly_damaging(0.8) | TCGA-AD-A5EJ-01 | Colorectum | colon adenocarcinoma | Female | >=65 | I/II | Unknown | Unknown | SD | |
| TSC22D4 | SNV | Missense_Mutation | rs773665153 | c.1013N>A | p.Arg338Gln | p.R338Q | Q9Y3Q8 | protein_coding | deleterious(0) | probably_damaging(0.995) | TCGA-G4-6320-01 | Colorectum | colon adenocarcinoma | Male | >=65 | III/IV | Chemotherapy | oxaliplatin | SD |
| TSC22D4 | SNV | Missense_Mutation | novel | c.787A>C | p.Ser263Arg | p.S263R | Q9Y3Q8 | protein_coding | tolerated(0.05) | benign(0.034) | TCGA-F5-6814-01 | Colorectum | rectum adenocarcinoma | Male | <65 | I/II | Unknown | Unknown | SD |
| TSC22D4 | SNV | Missense_Mutation | novel | c.851G>A | p.Gly284Glu | p.G284E | Q9Y3Q8 | protein_coding | deleterious(0) | probably_damaging(0.996) | TCGA-A5-A0G1-01 | Endometrium | uterine corpus endometrioid carcinoma | Female | >=65 | I/II | Unknown | Unknown | SD |
| TSC22D4 | SNV | Missense_Mutation | c.859G>A | p.Ala287Thr | p.A287T | Q9Y3Q8 | protein_coding | deleterious_low_confidence(0.03) | benign(0.1) | TCGA-B5-A11E-01 | Endometrium | uterine corpus endometrioid carcinoma | Female | <65 | I/II | Unknown | Unknown | SD | |
| TSC22D4 | SNV | Missense_Mutation | rs143784300 | c.1045N>T | p.Arg349Trp | p.R349W | Q9Y3Q8 | protein_coding | deleterious(0) | probably_damaging(0.987) | TCGA-B5-A11Y-01 | Endometrium | uterine corpus endometrioid carcinoma | Female | <65 | I/II | Unknown | Unknown | SD |
| Page: 1 2 3 |
Top |
Related drugs of malignant transformation related genes |
| Identification of chemicals and drugs interact with genes involved in malignant transfromation |
| (DGIdb 4.0) |
| Entrez ID | Symbol | Category | Interaction Types | Drug Claim Name | Drug Name | PMIDs |
| Page: 1 |

Copyright 2023-Present -The University of Texas Health Science Center at Houston |