Schematic overview of the cellular and molecular mechanisms involved in the cancer progression, including the proposed cellular and molecular mechanisms in cancer cells trajectory. AT1: alveolar type 1 cells; AT2: alveolar type 2 cells; AAH: atypical adenomatous hyperplasia; AIS: adenocarcinoma in situ; MIA: minimally invasive adenocarcinoma; IA: invasive adenocarcinoma; EMT: epithelial-mesenchymal transition

Home

Download

Statistics

Help

Contact

Center for Computational Systems Medicine
leaf

Gene summary

leaf

Malignant transformation analysis

leaf

Malignant transformation related pathway analysis

leaf

Cell-cell communication analysis

leaf

Single-cell gene regulatory network inference analysis

leaf

Somatic mutation of malignant transformation related genes

leaf

Related drugs of malignant transformation related genes

Gene: TSC22D3

Gene summary for TSC22D3

check button Gene summary.

Gene informationSpeciesHuman
Gene symbol

TSC22D3

Gene ID

1831

Gene nameTSC22 domain family member 3
Gene AliasDIP
CytomapXq22.3
Gene Typeprotein-coding
GO ID

GO:0001776

UniProtAcc

Q5JRJ2


Top

Malignant transformation analysis

check button Identification of the aberrant gene expression in precancerous and cancerous lesions by comparing the gene expression of stem-like cells in diseased tissues with normal stem cells
check button Malignant transformation involving gene list.
Entrez IDSymbolReplicatesSpeciesOrganTissueAdj P-valueLog2FCMalignancy
1831TSC22D3GSM4909286HumanBreastIDC2.89e-02-2.08e-010.1081
1831TSC22D3GSM4909290HumanBreastIDC3.01e-023.01e-010.2096
1831TSC22D3GSM4909293HumanBreastIDC2.12e-194.16e-010.1581
1831TSC22D3GSM4909297HumanBreastIDC4.63e-083.26e-010.1517
1831TSC22D3GSM4909298HumanBreastIDC1.26e-052.39e-010.1551
1831TSC22D3GSM4909304HumanBreastIDC1.56e-052.84e-010.1636
1831TSC22D3GSM4909306HumanBreastIDC1.53e-286.60e-010.1564
1831TSC22D3GSM4909308HumanBreastIDC9.68e-144.55e-010.158
1831TSC22D3GSM4909311HumanBreastIDC1.39e-05-5.53e-020.1534
1831TSC22D3GSM4909312HumanBreastIDC8.60e-053.43e-010.1552
1831TSC22D3GSM4909313HumanBreastIDC2.99e-023.64e-010.0391
1831TSC22D3GSM4909317HumanBreastIDC1.23e-176.35e-010.1355
1831TSC22D3GSM4909319HumanBreastIDC2.08e-244.19e-010.1563
1831TSC22D3GSM4909320HumanBreastIDC2.77e-02-1.96e-010.1575
1831TSC22D3GSM4909321HumanBreastIDC2.85e-073.55e-010.1559
1831TSC22D3M1HumanBreastIDC5.02e-033.18e-010.1577
1831TSC22D3DCIS2HumanBreastDCIS3.13e-313.59e-010.0085
1831TSC22D3LZE4THumanEsophagusESCC1.31e-033.66e-010.0811
1831TSC22D3LZE7THumanEsophagusESCC1.14e-071.69e+000.0667
1831TSC22D3LZE8THumanEsophagusESCC4.57e-025.77e-010.067
Page: 1 2 3 4 5 6 7 8 

check button Transcriptomic changes along malignancy continuum.
TissueExpression DynamicsAbbreviation
BreastThe image shows the transcriptomic changes along malignancy continuum.log2FC in expression of this searched gene in stem-like cells from each diseased tissue sample relative to stem-like cells in normal samples in each tissue plotted against the malignancy continuum. Samples are colored based on if they are from different disease stage.IDC: Invasive ductal carcinoma
DCIS: Ductal carcinoma in situ
Precancer(BRCA1-mut): Precancerous lesion from BRCA1 mutation carriers
EsophagusThe image shows the transcriptomic changes along malignancy continuum.log2FC in expression of this searched gene in stem-like cells from each diseased tissue sample relative to stem-like cells in normal samples in each tissue plotted against the malignancy continuum. Samples are colored based on if they are from different disease stage.
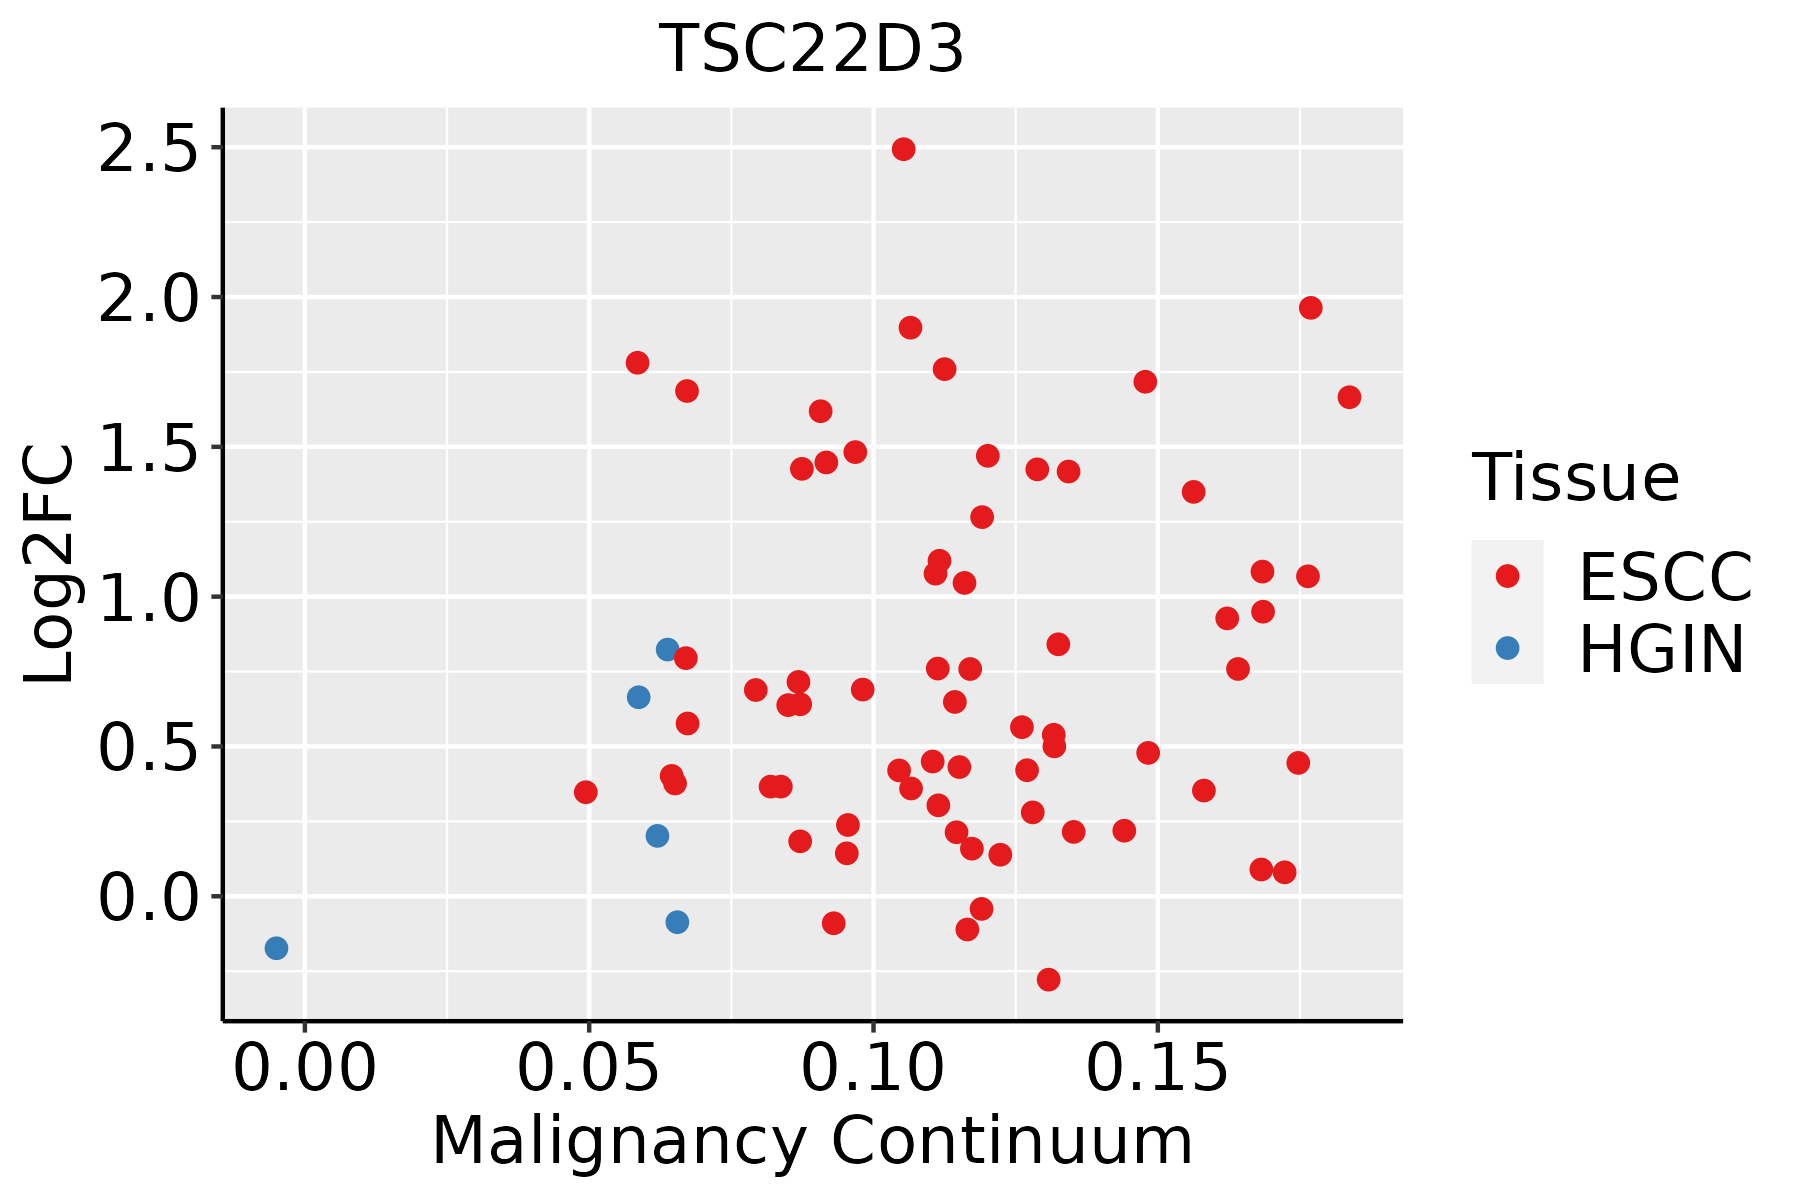
ESCC: Esophageal squamous cell carcinoma
HGIN: High-grade intraepithelial neoplasias
LGIN: Low-grade intraepithelial neoplasias
LiverThe image shows the transcriptomic changes along malignancy continuum.log2FC in expression of this searched gene in stem-like cells from each diseased tissue sample relative to stem-like cells in normal samples in each tissue plotted against the malignancy continuum. Samples are colored based on if they are from different disease stage.
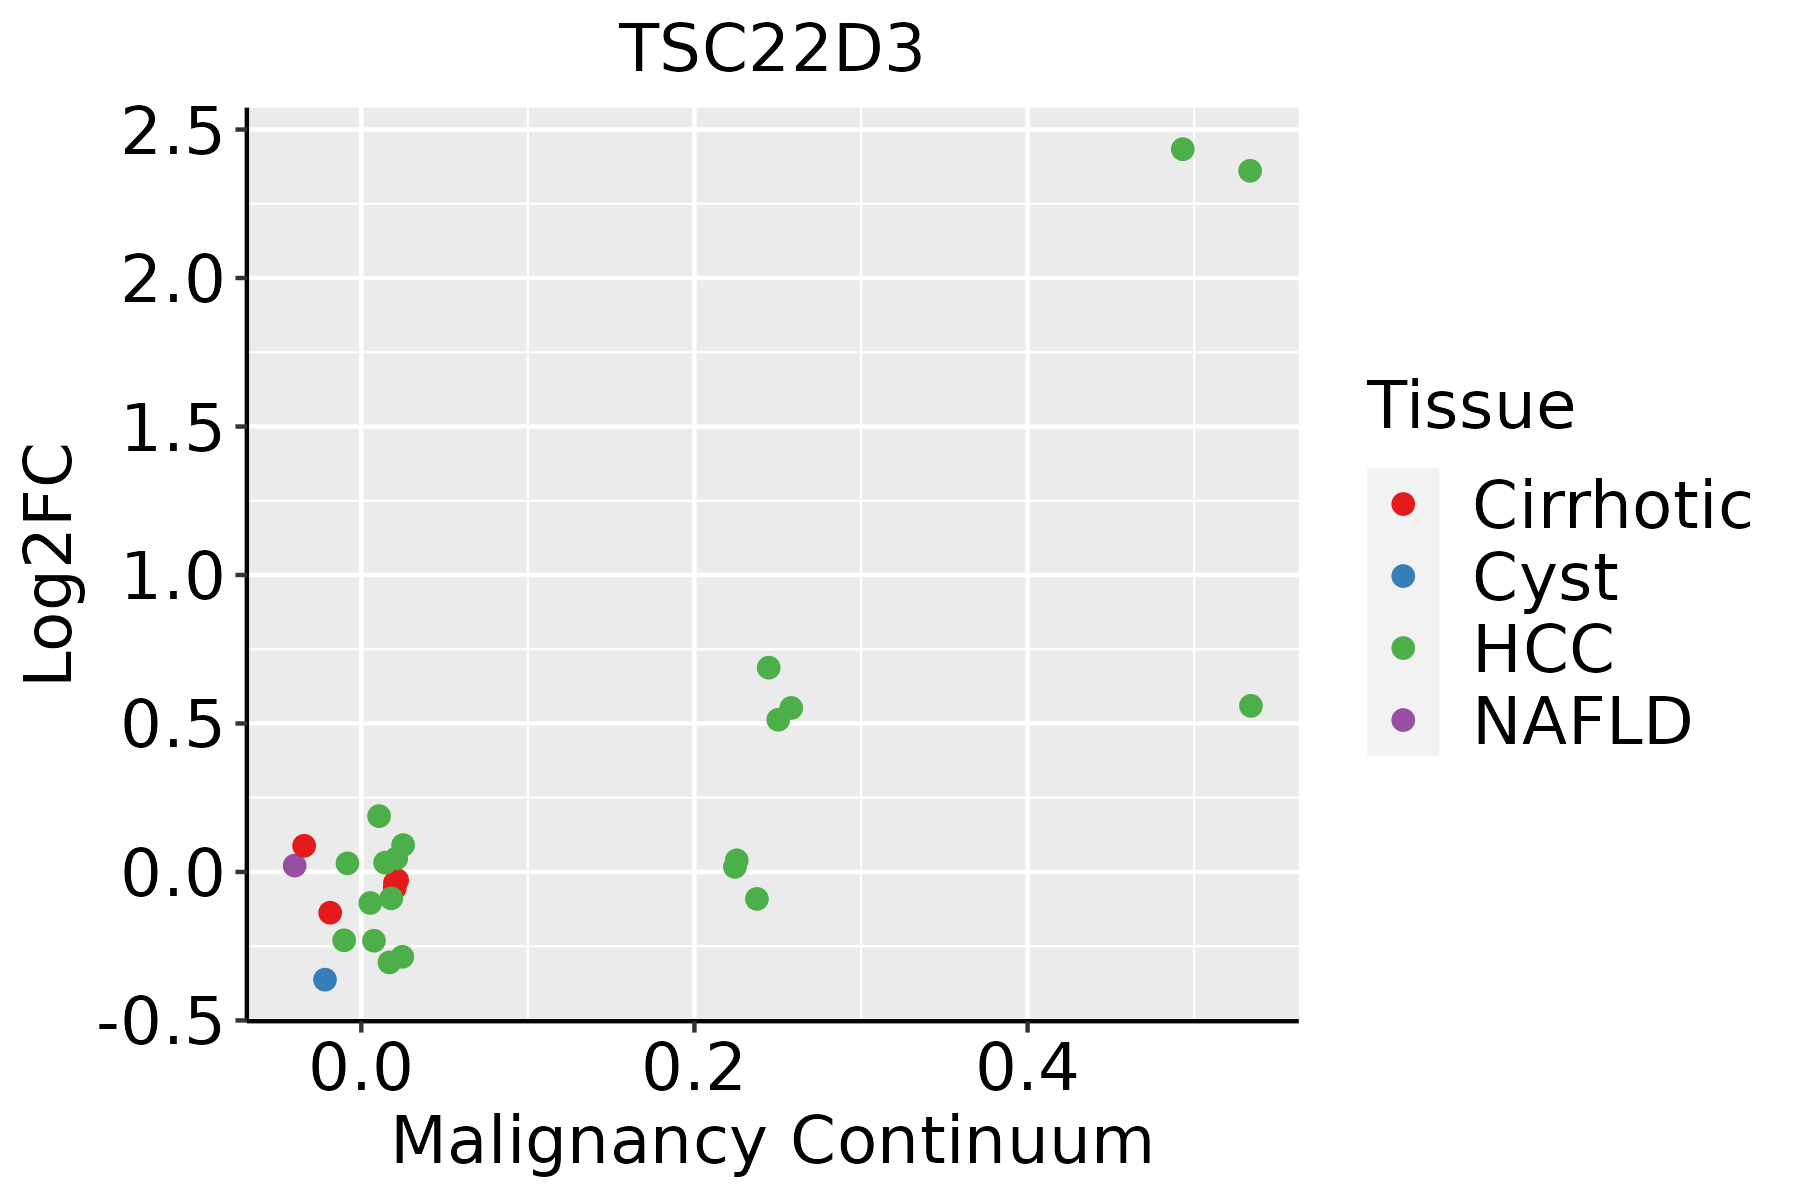
HCC: Hepatocellular carcinoma
NAFLD: Non-alcoholic fatty liver disease
Oral CavityThe image shows the transcriptomic changes along malignancy continuum.log2FC in expression of this searched gene in stem-like cells from each diseased tissue sample relative to stem-like cells in normal samples in each tissue plotted against the malignancy continuum. Samples are colored based on if they are from different disease stage.
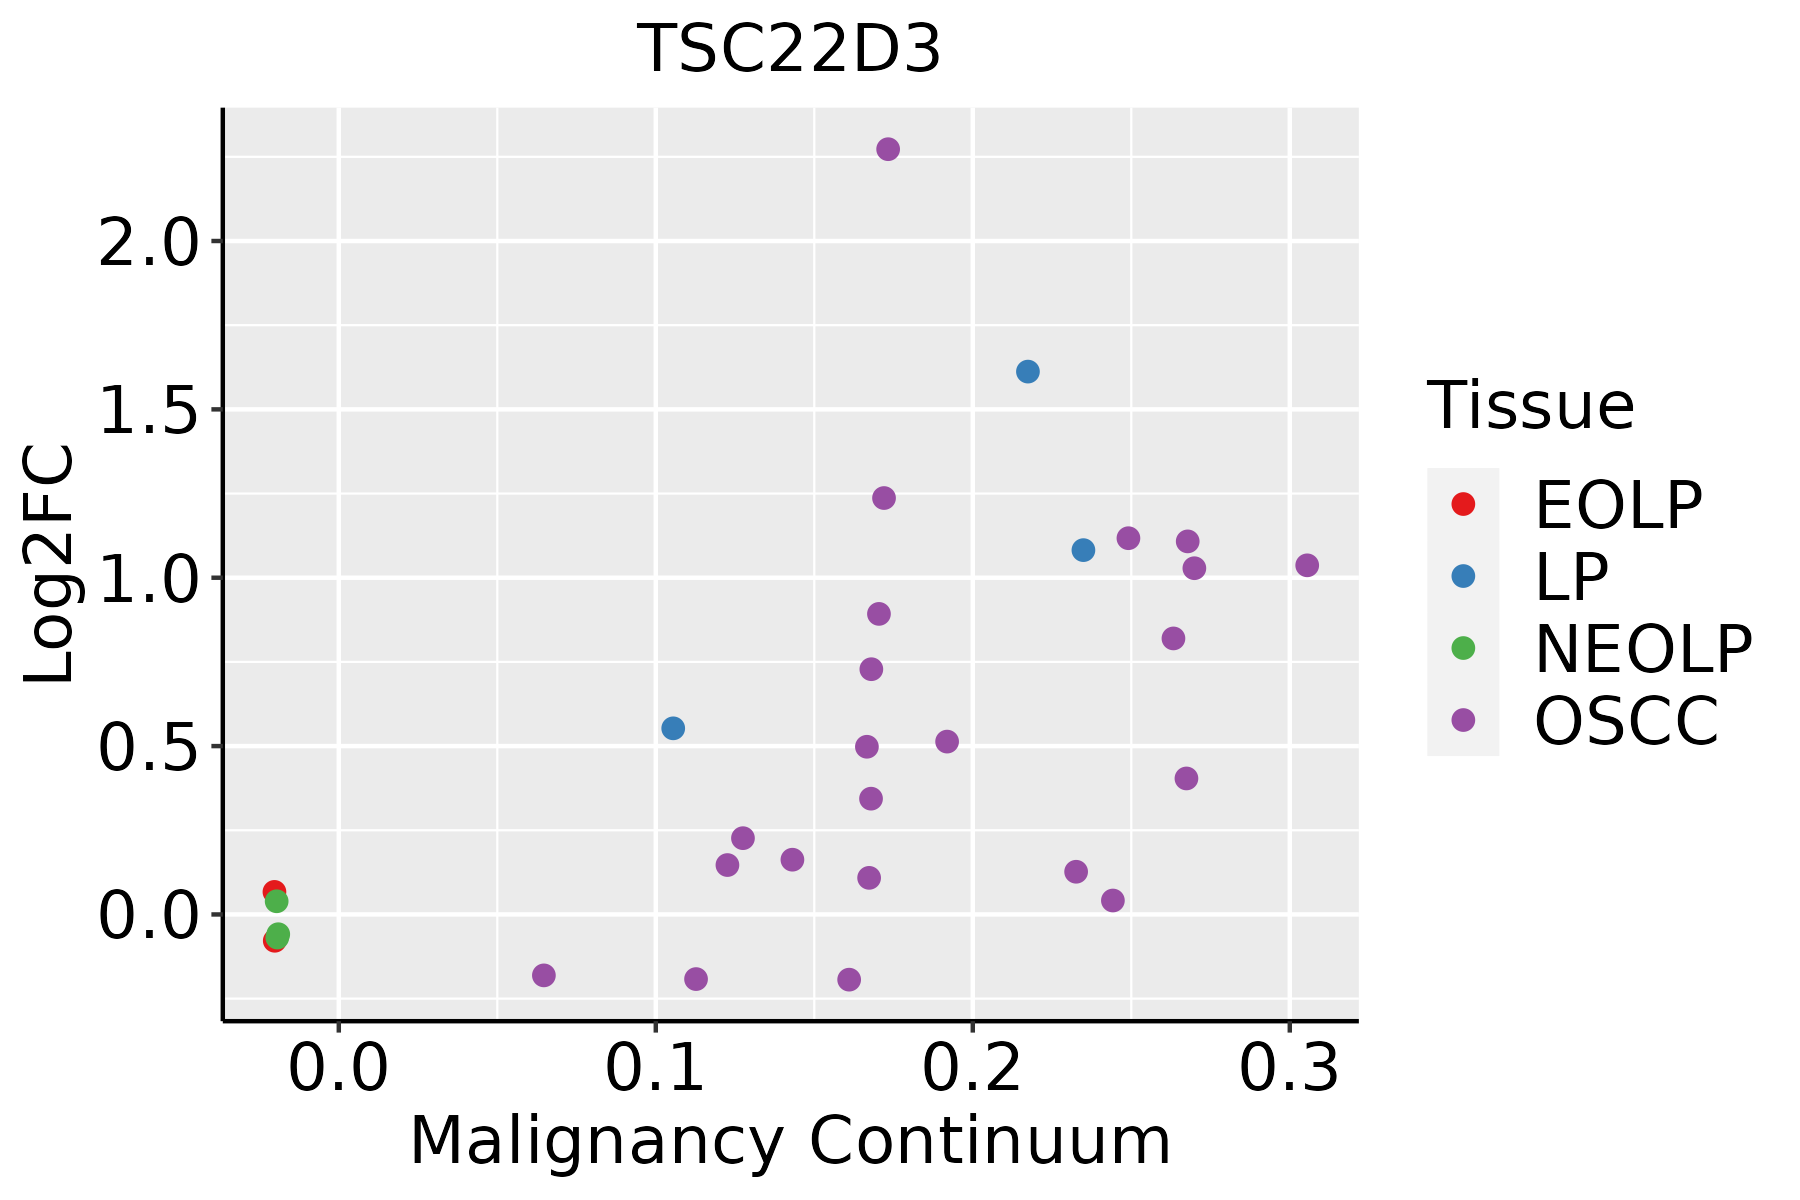
EOLP: Erosive Oral lichen planus
LP: leukoplakia
NEOLP: Non-erosive oral lichen planus
OSCC: Oral squamous cell carcinoma
ProstateThe image shows the transcriptomic changes along malignancy continuum.log2FC in expression of this searched gene in stem-like cells from each diseased tissue sample relative to stem-like cells in normal samples in each tissue plotted against the malignancy continuum. Samples are colored based on if they are from different disease stage.
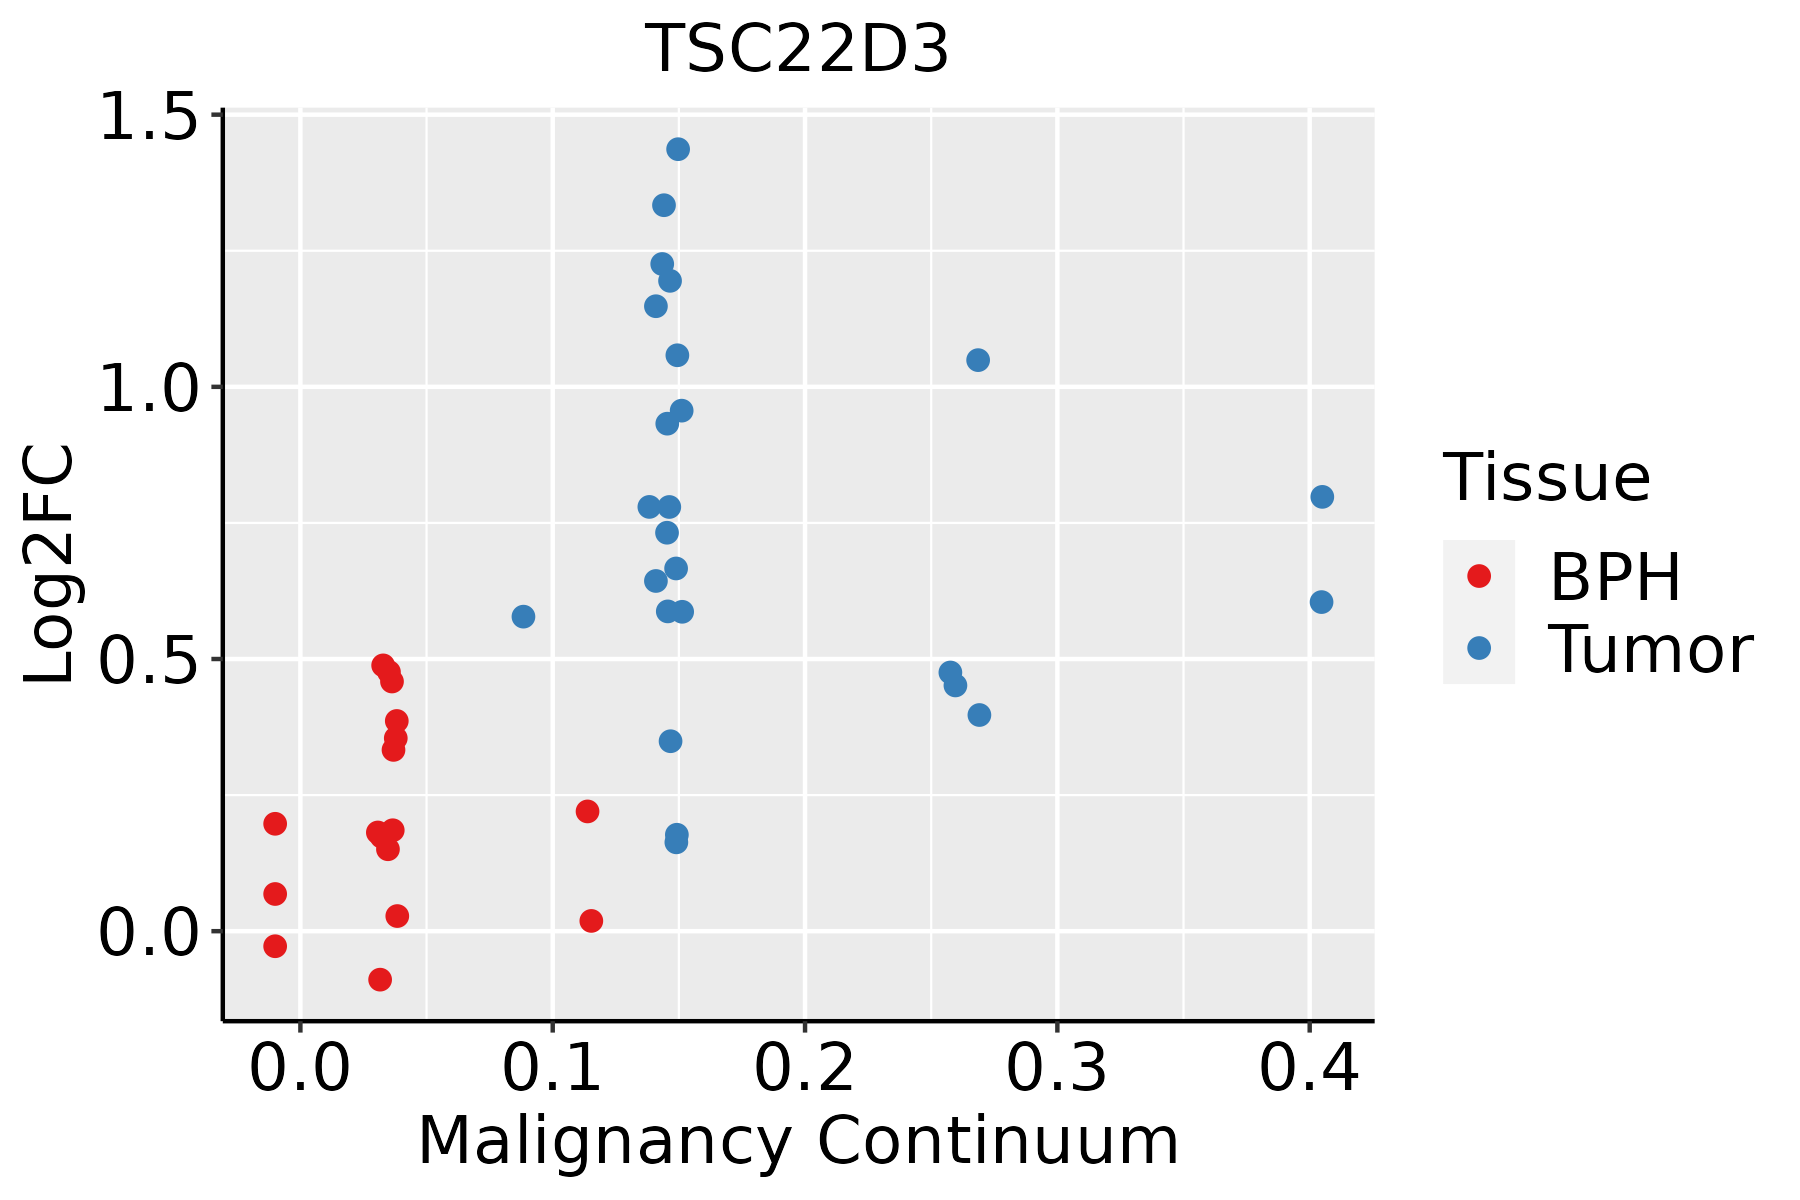
BPH: Benign Prostatic Hyperplasia
SkinThe image shows the transcriptomic changes along malignancy continuum.log2FC in expression of this searched gene in stem-like cells from each diseased tissue sample relative to stem-like cells in normal samples in each tissue plotted against the malignancy continuum. Samples are colored based on if they are from different disease stage.
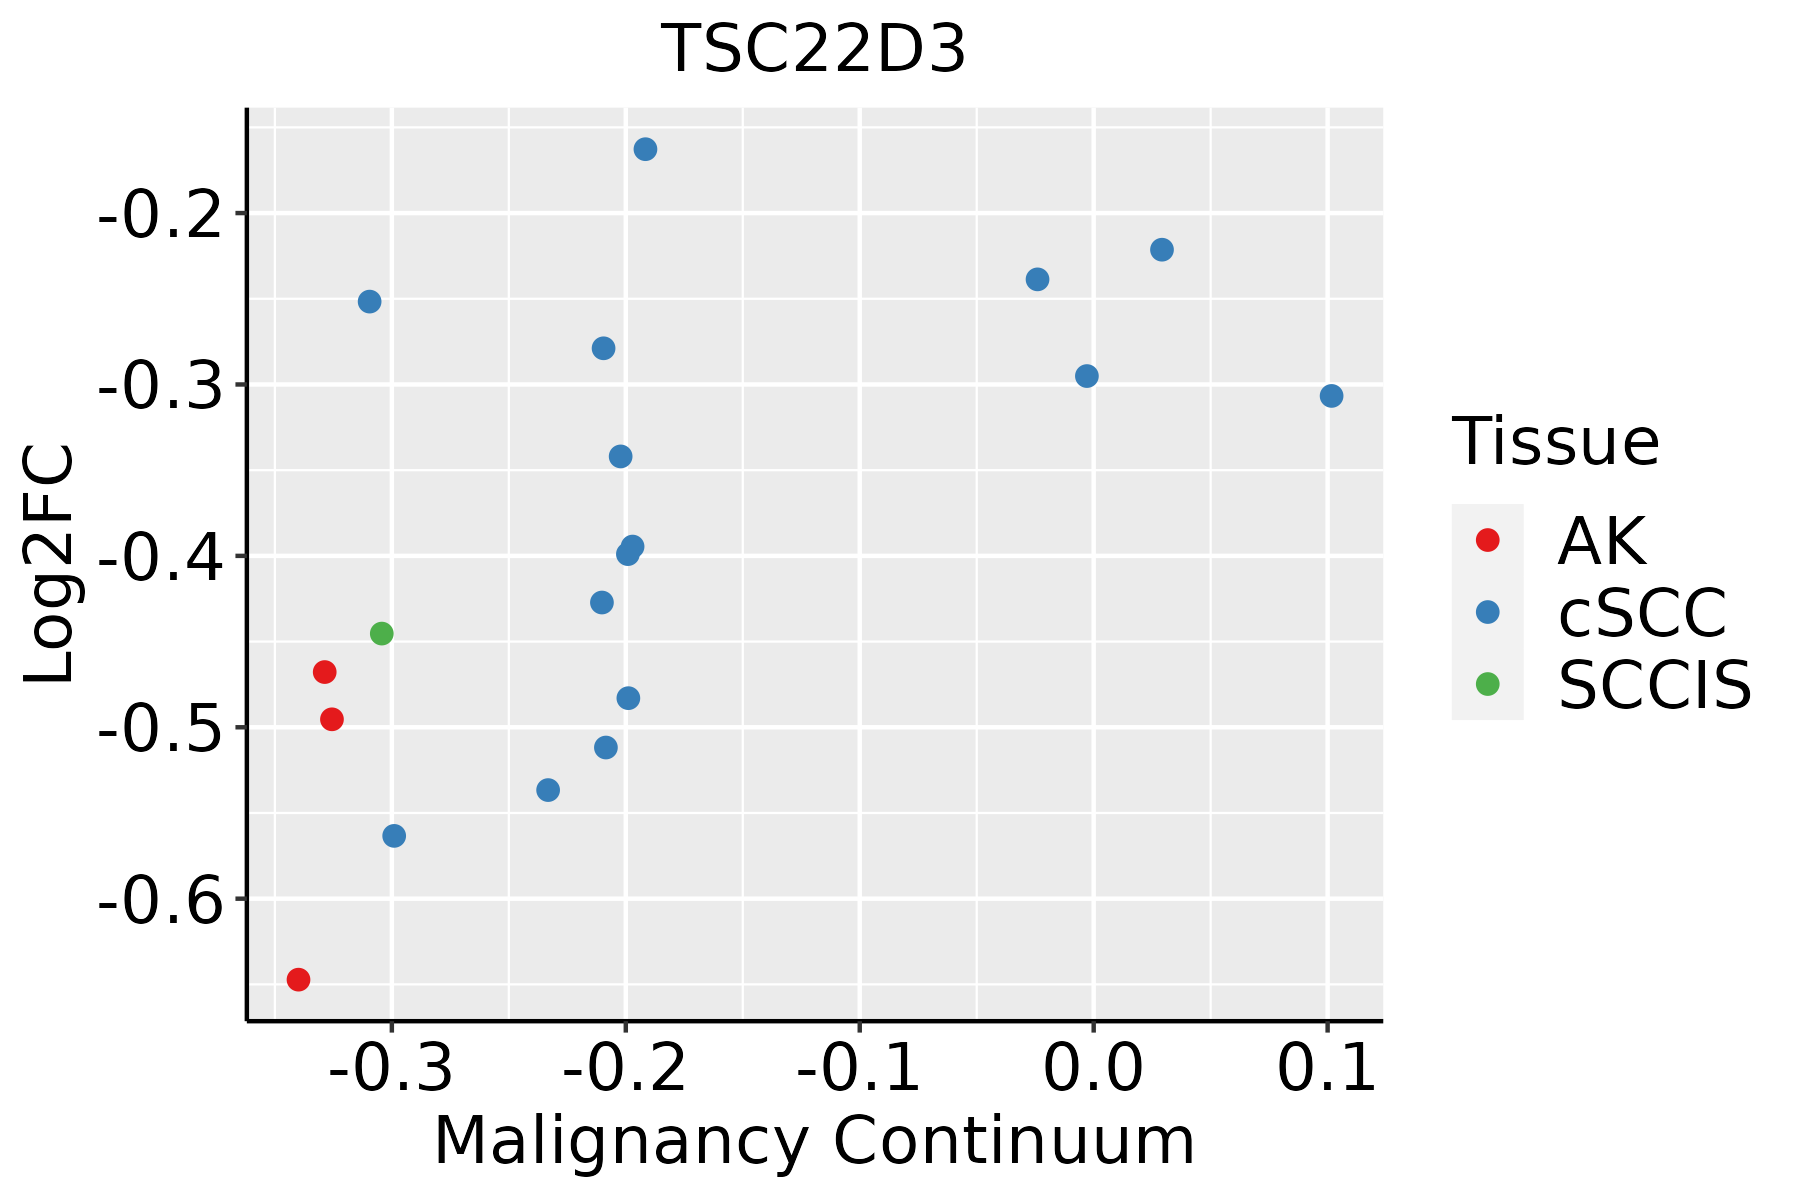
AK: Actinic keratosis
cSCC: Cutaneous squamous cell carcinoma
SCCIS:squamous cell carcinoma in situ
ThyroidThe image shows the transcriptomic changes along malignancy continuum.log2FC in expression of this searched gene in stem-like cells from each diseased tissue sample relative to stem-like cells in normal samples in each tissue plotted against the malignancy continuum. Samples are colored based on if they are from different disease stage.
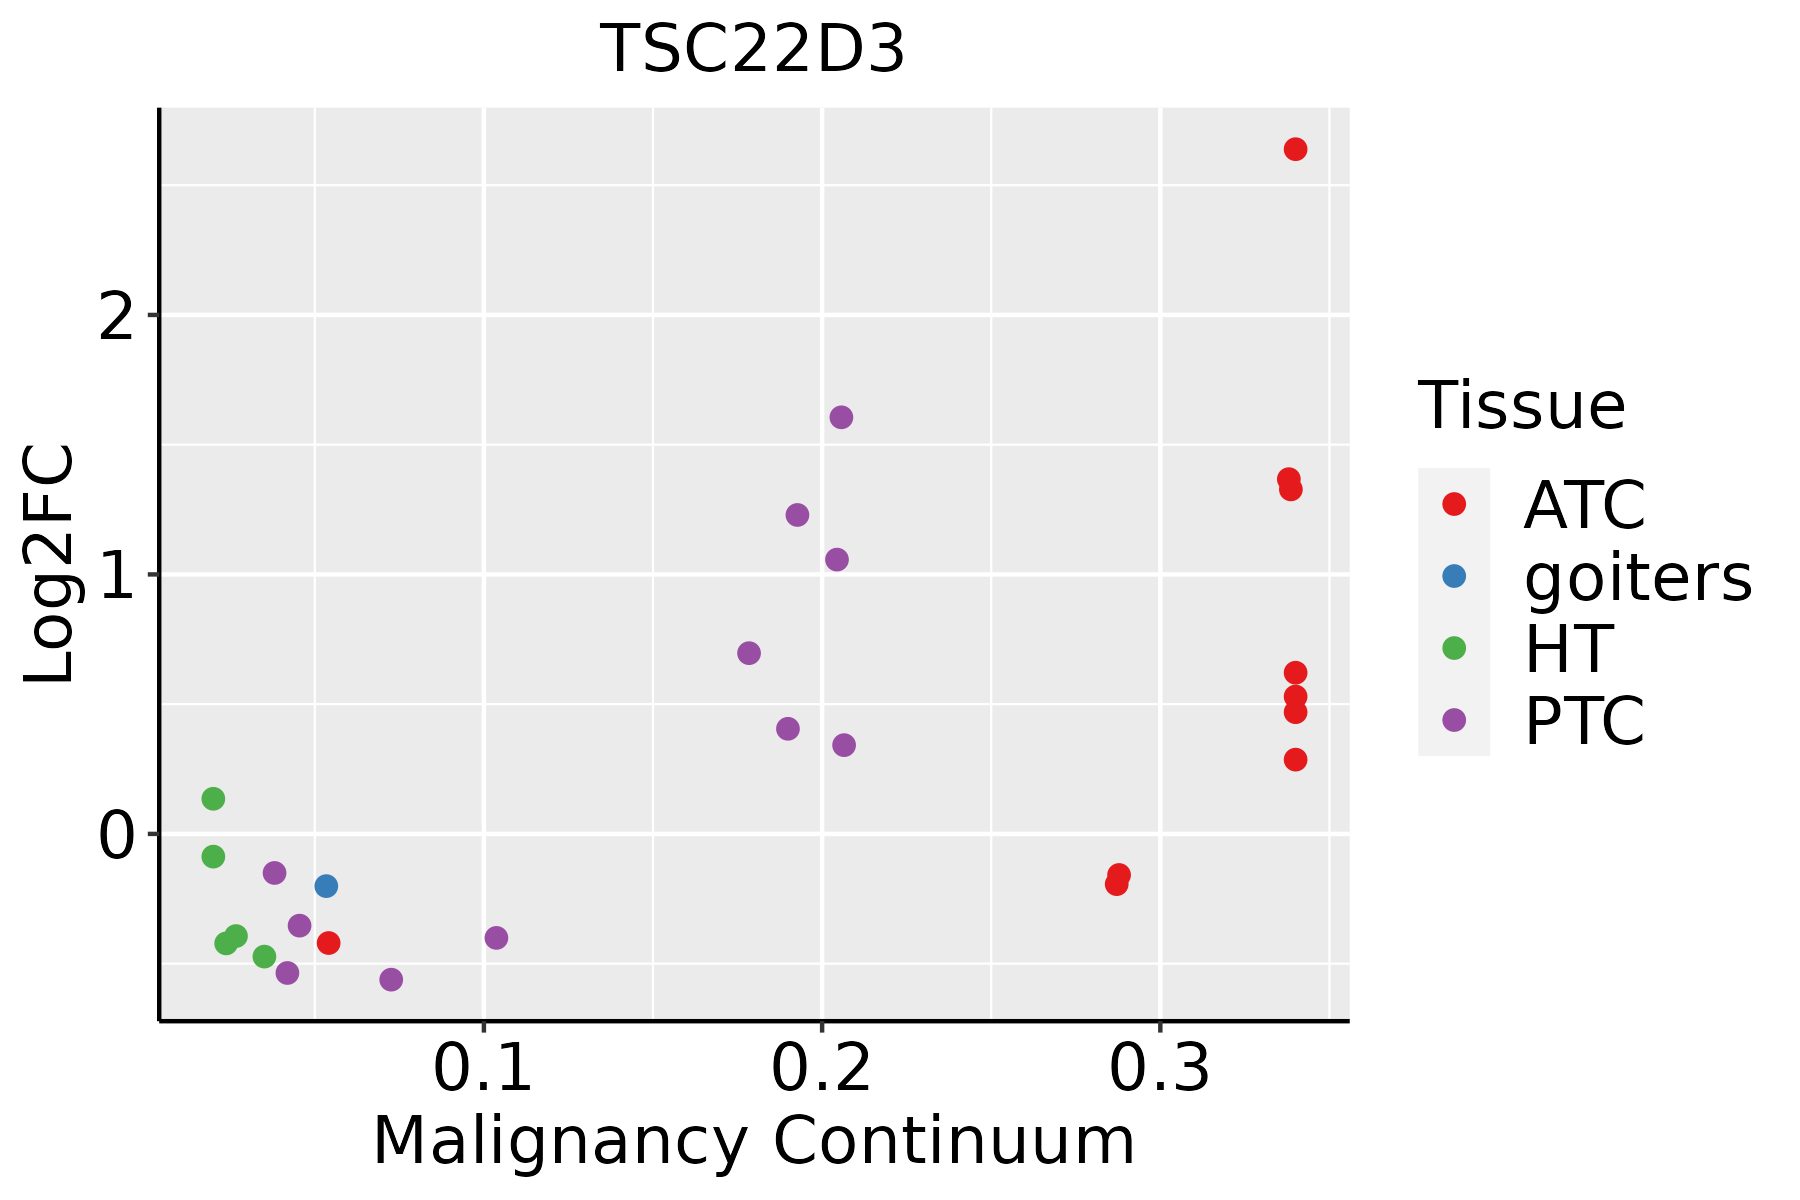
ATC: Anaplastic thyroid cancer
HT: Hashimoto's thyroiditis
PTC: Papillary thyroid cancer
∗log2FC in expression of this searched gene in stem-like cells from each diseased tissue sample relative to stem-like cells in normal samples in each tissue plotted against the malignancy continuum. Samples are colored based on if they are from different disease stage.

Top

Malignant transformation related pathway analysis

check buttonFind out the enriched GO biological processes and KEGG pathways involved in transition from healthy to precancer to cancer
check button Figure of enriched GO biological processes.
TissueDisease StageEnriched GO biological Processes
ColorectumADGO analysis - Figure of enriched GO biological processes: Top 15 enriched GO BP terms are showed in the bar plot of each disease state in each tissue. Each row represents a significant GO biological process which is colored according to the -log10(p.adjust).
ColorectumSERGO analysis - Figure of enriched GO biological processes: Top 15 enriched GO BP terms are showed in the bar plot of each disease state in each tissue. Each row represents a significant GO biological process which is colored according to the -log10(p.adjust).
ColorectumMSSGO analysis - Figure of enriched GO biological processes: Top 15 enriched GO BP terms are showed in the bar plot of each disease state in each tissue. Each row represents a significant GO biological process which is colored according to the -log10(p.adjust).
ColorectumMSI-HGO analysis - Figure of enriched GO biological processes: Top 15 enriched GO BP terms are showed in the bar plot of each disease state in each tissue. Each row represents a significant GO biological process which is colored according to the -log10(p.adjust).
ColorectumFAPGO analysis - Figure of enriched GO biological processes: Top 15 enriched GO BP terms are showed in the bar plot of each disease state in each tissue. Each row represents a significant GO biological process which is colored according to the -log10(p.adjust).
∗Top 15 enriched GO BP terms are showed in the bar plot of each disease state in each tissue. Each row represents a significant GO biological process which is colored according to the -log10(p.adjust).
Page: 1 2 3 4 5 6 7 8 9 

check button Enriched GO biological processes.
GO IDTissueDisease StageDescriptionGene RatioBg Ratiopvaluep.adjustCount
GO:000268311BreastIDCnegative regulation of immune system process55/1434434/187231.53e-042.67e-0355
GO:004887214BreastIDChomeostasis of number of cells36/1434272/187239.10e-041.04e-0236
GO:0070229BreastIDCnegative regulation of lymphocyte apoptotic process7/143430/187236.48e-034.56e-027
GO:000268321BreastDCISnegative regulation of immune system process57/1390434/187231.81e-054.35e-0457
GO:004887224BreastDCIShomeostasis of number of cells36/1390272/187235.17e-046.73e-0336
GO:004887227EsophagusHGINhomeostasis of number of cells54/2587272/187233.50e-033.23e-0254
GO:0048872111EsophagusESCChomeostasis of number of cells163/8552272/187231.40e-061.69e-05163
GO:00069707EsophagusESCCresponse to osmotic stress57/855284/187233.26e-052.70e-0457
GO:00718871EsophagusESCCleukocyte apoptotic process65/8552106/187238.39e-044.32e-0365
GO:000268316EsophagusESCCnegative regulation of immune system process231/8552434/187238.48e-044.36e-03231
GO:00702271EsophagusESCClymphocyte apoptotic process46/855272/187231.39e-036.62e-0346
GO:0070231EsophagusESCCT cell apoptotic process31/855250/187231.48e-024.79e-0231
GO:000697011LiverCirrhoticresponse to osmotic stress34/463484/187231.06e-037.40e-0334
GO:004887212LiverCirrhotichomeostasis of number of cells89/4634272/187231.76e-031.12e-0289
GO:004887222LiverHCChomeostasis of number of cells147/7958272/187237.48e-056.70e-04147
GO:00069702LiverHCCresponse to osmotic stress52/795884/187232.58e-041.92e-0352
GO:004887220Oral cavityOSCChomeostasis of number of cells152/7305272/187231.08e-082.23e-07152
GO:00069706Oral cavityOSCCresponse to osmotic stress50/730584/187231.11e-048.15e-0450
GO:0071887Oral cavityOSCCleukocyte apoptotic process60/7305106/187231.78e-041.21e-0360
GO:000268310Oral cavityOSCCnegative regulation of immune system process204/7305434/187233.72e-042.27e-03204
Page: 1 2 3 

check button Enriched KEGG pathways.
Pathway IDTissueDisease StageDescriptionGene RatioBg Ratiopvaluep.adjustqvalueCount
Page: 1 

Top

Cell-cell communication analysis

check buttonIdentification of potential cell-cell interactions between two cell types and their ligand-receptor pairs for different disease states
LigandReceptorLRpairPathwayTissueDisease Stage
Page: 1 

Top

Single-cell gene regulatory network inference analysis

check buttonFind out the significant the regulons (TFs) and the target genes of each regulon across cell types for different disease states
TFCell TypeTissueDisease StageTarget GeneRSSRegulon Activity
∗The dot plots of a searched regulon are shown for all cell subpopulations in each disease state of each tissue based on the regulon specific score inferred using pySCENIC and by calculating the average expression.
Page: 1 

Top

Somatic mutation of malignant transformation related genes

check buttonAnnotation of somatic variants for genes involved in malignant transformation
Hugo SymbolVariant ClassVariant ClassificationdbSNP RSHGVScHGVSpHGVSp ShortSWISSPROTBIOTYPESIFTPolyPhenTumor Sample BarcodeTissueHistologySexAgeStageTherapy TypesDrugsOutcome
TSC22D3SNVMissense_Mutationnovelc.145C>Tp.Arg49Trpp.R49WQ99576protein_codingdeleterious_low_confidence(0)possibly_damaging(0.895)TCGA-AN-A046-01Breastbreast invasive carcinomaFemale>=65I/IIUnknownUnknownSD
TSC22D3SNVMissense_Mutationc.274C>Tp.Arg92Cysp.R92CQ99576protein_codingdeleterious(0.01)benign(0.134)TCGA-AO-A0J9-01Breastbreast invasive carcinomaFemale<65III/IVChemotherapycyclophosphamidePD
TSC22D3SNVMissense_Mutationc.98N>Cp.Ser33Thrp.S33TQ99576protein_codingtolerated_low_confidence(0.27)benign(0.005)TCGA-BH-A0BW-01Breastbreast invasive carcinomaFemale>=65I/IIChemotherapyadriamycinCR
TSC22D3SNVMissense_Mutationnovelc.337N>Ap.Val113Metp.V113MQ99576protein_codingdeleterious(0.04)possibly_damaging(0.698)TCGA-EA-A3HU-01Cervixcervical & endocervical cancerFemale<65I/IIUnknownUnknownSD
TSC22D3SNVMissense_Mutationc.37N>Ap.Gly13Serp.G13SQ99576protein_codingdeleterious_low_confidence(0)probably_damaging(0.999)TCGA-IR-A3L7-01Cervixcervical & endocervical cancerFemale<65I/IIChemotherapycisplatinCR
TSC22D3SNVMissense_Mutationc.361N>Ap.Glu121Lysp.E121KQ99576protein_codingdeleterious(0.01)probably_damaging(0.992)TCGA-AA-3984-01Colorectumcolon adenocarcinomaFemale<65I/IIUnknownUnknownSD
TSC22D3SNVMissense_Mutationc.209N>Ap.Arg70Glnp.R70QQ99576protein_codingtolerated(0.12)probably_damaging(0.979)TCGA-EI-6510-01Colorectumrectum adenocarcinomaFemale>=65I/IIUnknownUnknownSD
TSC22D3SNVMissense_Mutationnovelc.226C>Tp.Pro76Serp.P76SQ99576protein_codingtolerated(0.33)benign(0.005)TCGA-A5-A0G1-01Endometriumuterine corpus endometrioid carcinomaFemale>=65I/IIUnknownUnknownSD
TSC22D3SNVMissense_Mutationc.361N>Ap.Glu121Lysp.E121KQ99576protein_codingdeleterious(0.01)probably_damaging(0.992)TCGA-A5-A2K5-01Endometriumuterine corpus endometrioid carcinomaFemale>=65I/IIUnknownUnknownSD
TSC22D3SNVMissense_Mutationnovelc.80N>Ap.Ser27Asnp.S27NQ99576protein_codingdeleterious_low_confidence(0.05)benign(0.043)TCGA-AJ-A3BH-01Endometriumuterine corpus endometrioid carcinomaFemaleUnknownI/IIUnknownUnknownSD
Page: 1 2 3 

Top

Related drugs of malignant transformation related genes

check buttonIdentification of chemicals and drugs interact with genes involved in malignant transfromation
(DGIdb 4.0)
Entrez IDSymbolCategoryInteraction TypesDrug Claim NameDrug NamePMIDs
1831TSC22D3NAHYDROCORTISONEHYDROCORTISONE15728202
1831TSC22D3NACORTICOSTEROIDS17208592
1831TSC22D3NADEXAMETHASONEDEXAMETHASONE15728202,12707381
Page: 1