
|
|||||
|
 | |
| |
| |
| |
| |
| |
|
Gene: TRUB2 |
Gene summary for TRUB2 |
| Gene information | Species | Human | Gene symbol | TRUB2 | Gene ID | 26995 |
| Gene name | TruB pseudouridine synthase family member 2 | |
| Gene Alias | CLONE24922 | |
| Cytomap | 9q34.11 | |
| Gene Type | protein-coding | GO ID | GO:0001522 | UniProtAcc | O95900 |
Top |
Malignant transformation analysis |
| Identification of the aberrant gene expression in precancerous and cancerous lesions by comparing the gene expression of stem-like cells in diseased tissues with normal stem cells |
| Entrez ID | Symbol | Replicates | Species | Organ | Tissue | Adj P-value | Log2FC | Malignancy |
| 26995 | TRUB2 | HTA11_78_2000001011 | Human | Colorectum | AD | 3.28e-02 | 1.58e-01 | -0.1088 |
| 26995 | TRUB2 | HTA11_347_2000001011 | Human | Colorectum | AD | 6.10e-11 | 3.08e-01 | -0.1954 |
| 26995 | TRUB2 | HTA11_3361_2000001011 | Human | Colorectum | AD | 2.24e-03 | 2.56e-01 | -0.1207 |
| 26995 | TRUB2 | HTA11_696_2000001011 | Human | Colorectum | AD | 9.75e-03 | 1.96e-01 | -0.1464 |
| 26995 | TRUB2 | HTA11_1391_2000001011 | Human | Colorectum | AD | 2.79e-06 | 3.31e-01 | -0.059 |
| 26995 | TRUB2 | HTA11_866_3004761011 | Human | Colorectum | AD | 8.29e-04 | 2.41e-01 | 0.096 |
| 26995 | TRUB2 | HTA11_10623_2000001011 | Human | Colorectum | AD | 7.52e-04 | 3.03e-01 | -0.0177 |
| 26995 | TRUB2 | HTA11_7696_3000711011 | Human | Colorectum | AD | 3.19e-04 | 2.74e-01 | 0.0674 |
| 26995 | TRUB2 | HTA11_99999965062_69753 | Human | Colorectum | MSI-H | 1.01e-08 | 9.16e-01 | 0.3487 |
| 26995 | TRUB2 | HTA11_99999965104_69814 | Human | Colorectum | MSS | 2.43e-06 | 3.53e-01 | 0.281 |
| 26995 | TRUB2 | HTA11_99999971662_82457 | Human | Colorectum | MSS | 5.05e-06 | 3.18e-01 | 0.3859 |
| 26995 | TRUB2 | LZE4T | Human | Esophagus | ESCC | 2.20e-05 | 1.97e-01 | 0.0811 |
| 26995 | TRUB2 | LZE7T | Human | Esophagus | ESCC | 7.53e-05 | 3.26e-01 | 0.0667 |
| 26995 | TRUB2 | LZE8T | Human | Esophagus | ESCC | 2.28e-04 | 1.81e-01 | 0.067 |
| 26995 | TRUB2 | LZE20T | Human | Esophagus | ESCC | 9.22e-04 | 2.78e-01 | 0.0662 |
| 26995 | TRUB2 | LZE22T | Human | Esophagus | ESCC | 5.15e-04 | 2.07e-01 | 0.068 |
| 26995 | TRUB2 | LZE24T | Human | Esophagus | ESCC | 1.19e-12 | 3.88e-01 | 0.0596 |
| 26995 | TRUB2 | P1T-E | Human | Esophagus | ESCC | 2.34e-06 | 2.57e-01 | 0.0875 |
| 26995 | TRUB2 | P2T-E | Human | Esophagus | ESCC | 2.40e-43 | 7.23e-01 | 0.1177 |
| 26995 | TRUB2 | P4T-E | Human | Esophagus | ESCC | 1.76e-25 | 6.46e-01 | 0.1323 |
| Page: 1 2 3 4 5 6 |
| Tissue | Expression Dynamics | Abbreviation |
| Colorectum (GSE201348) |  | FAP: Familial adenomatous polyposis |
| CRC: Colorectal cancer | ||
| Colorectum (HTA11) |  | AD: Adenomas |
| SER: Sessile serrated lesions | ||
| MSI-H: Microsatellite-high colorectal cancer | ||
| MSS: Microsatellite stable colorectal cancer | ||
| Esophagus | 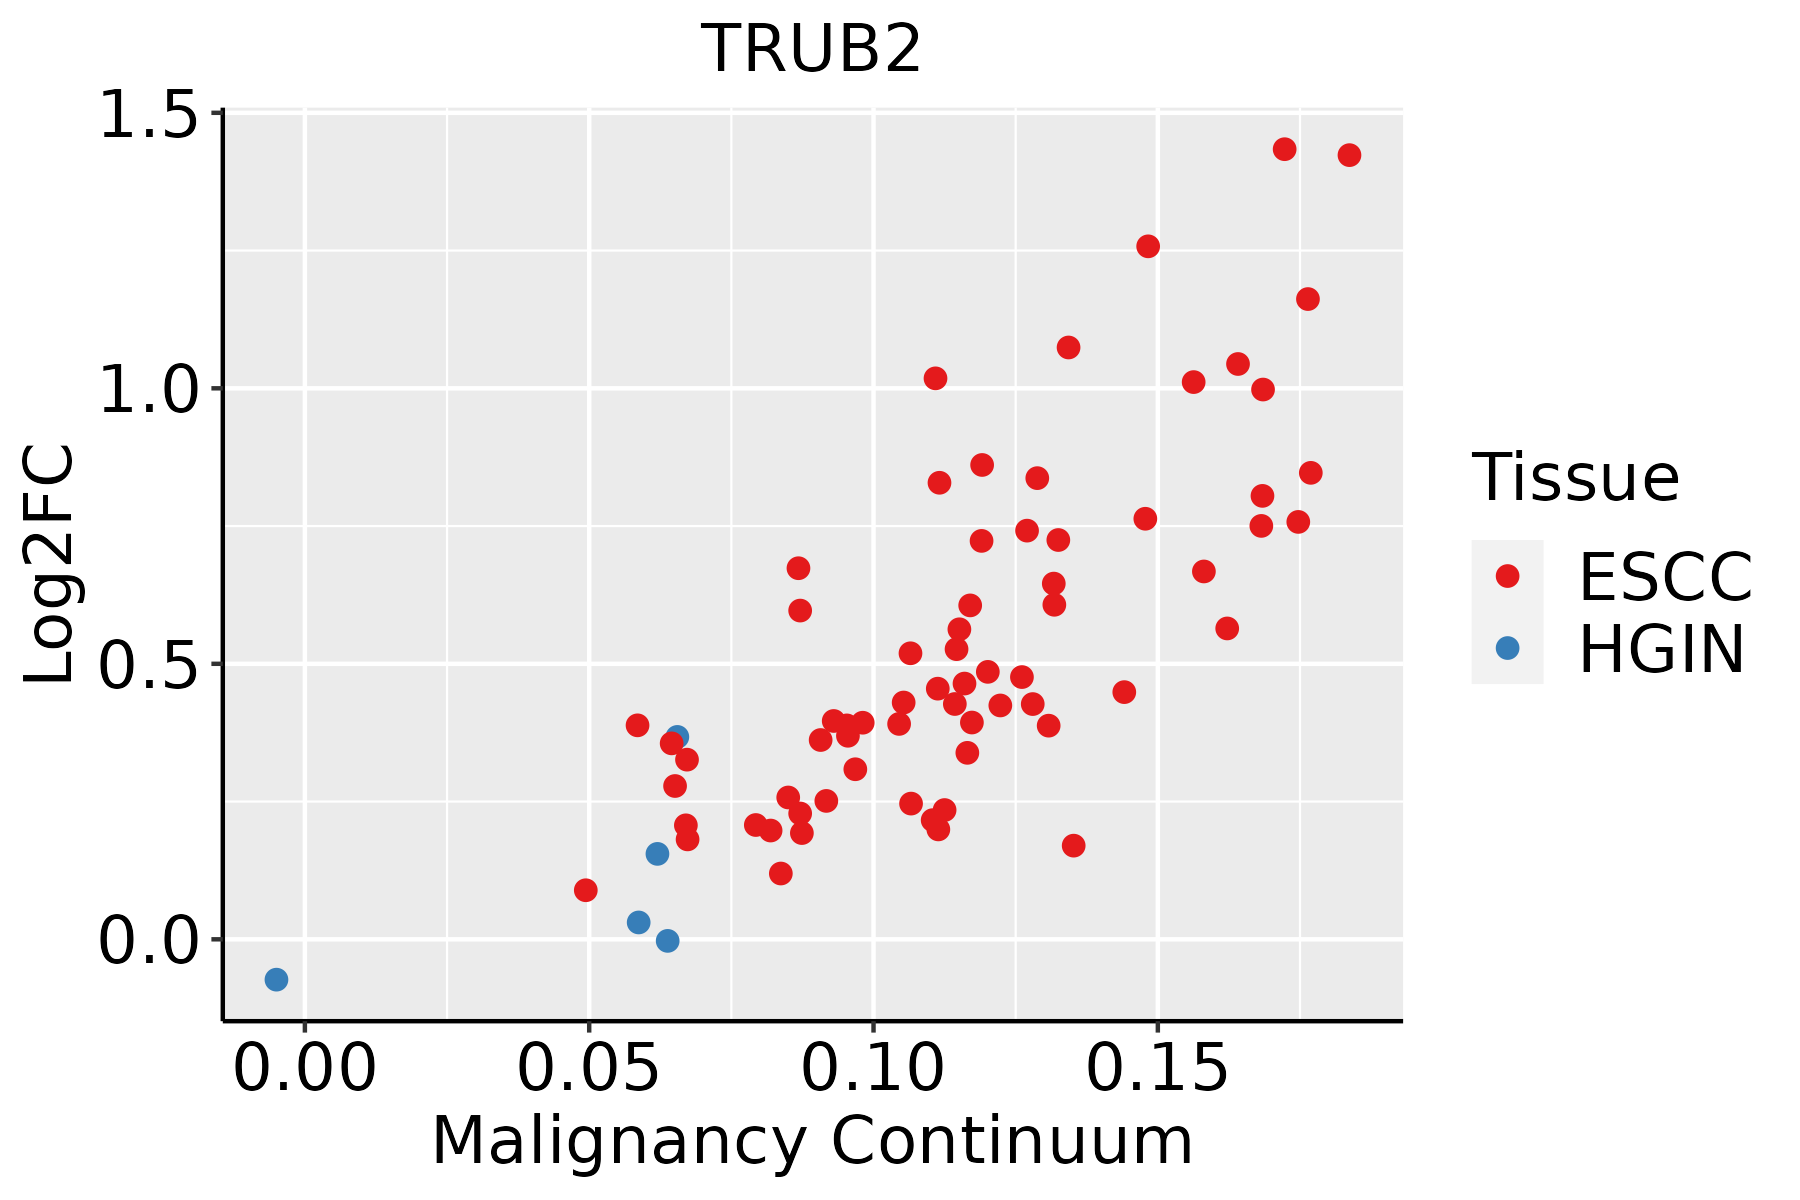 | ESCC: Esophageal squamous cell carcinoma |
| HGIN: High-grade intraepithelial neoplasias | ||
| LGIN: Low-grade intraepithelial neoplasias | ||
| Liver | 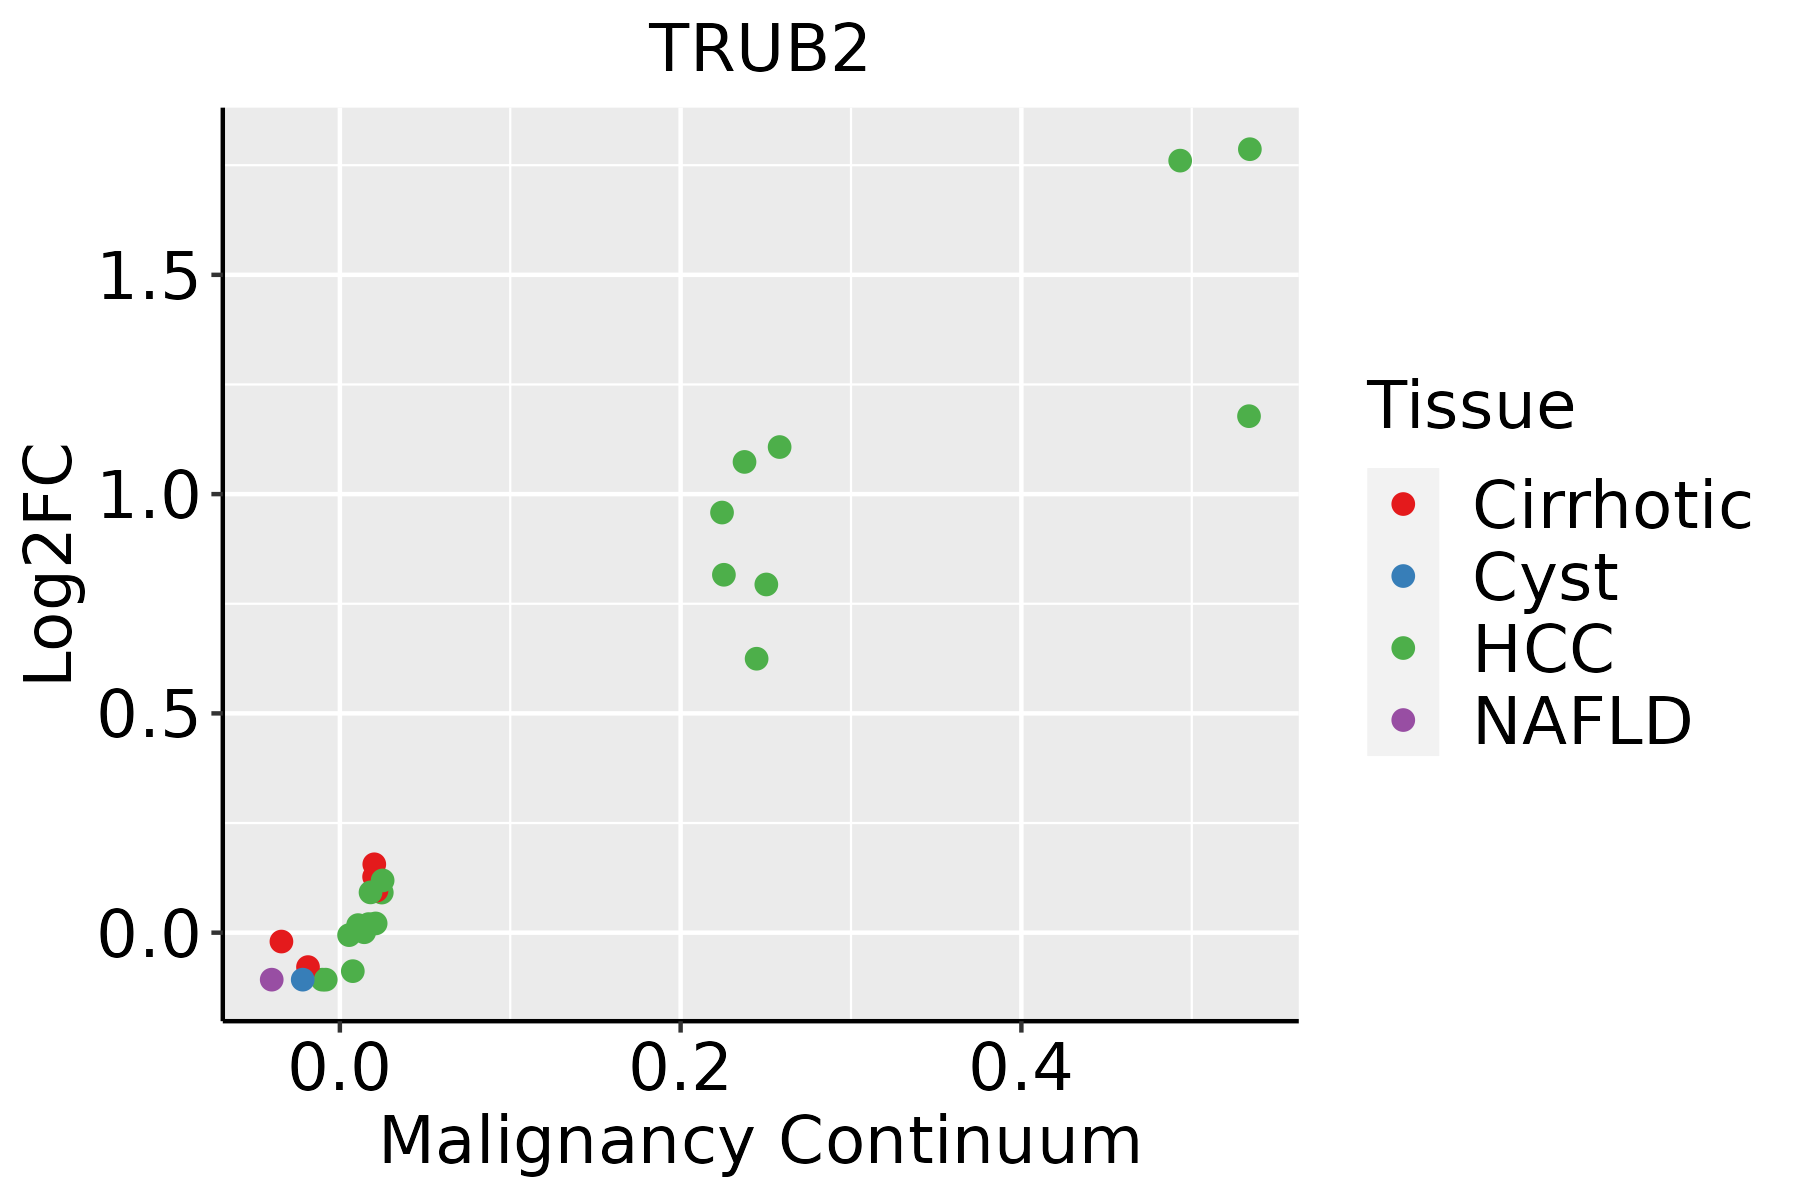 | HCC: Hepatocellular carcinoma |
| NAFLD: Non-alcoholic fatty liver disease | ||
| Oral Cavity | 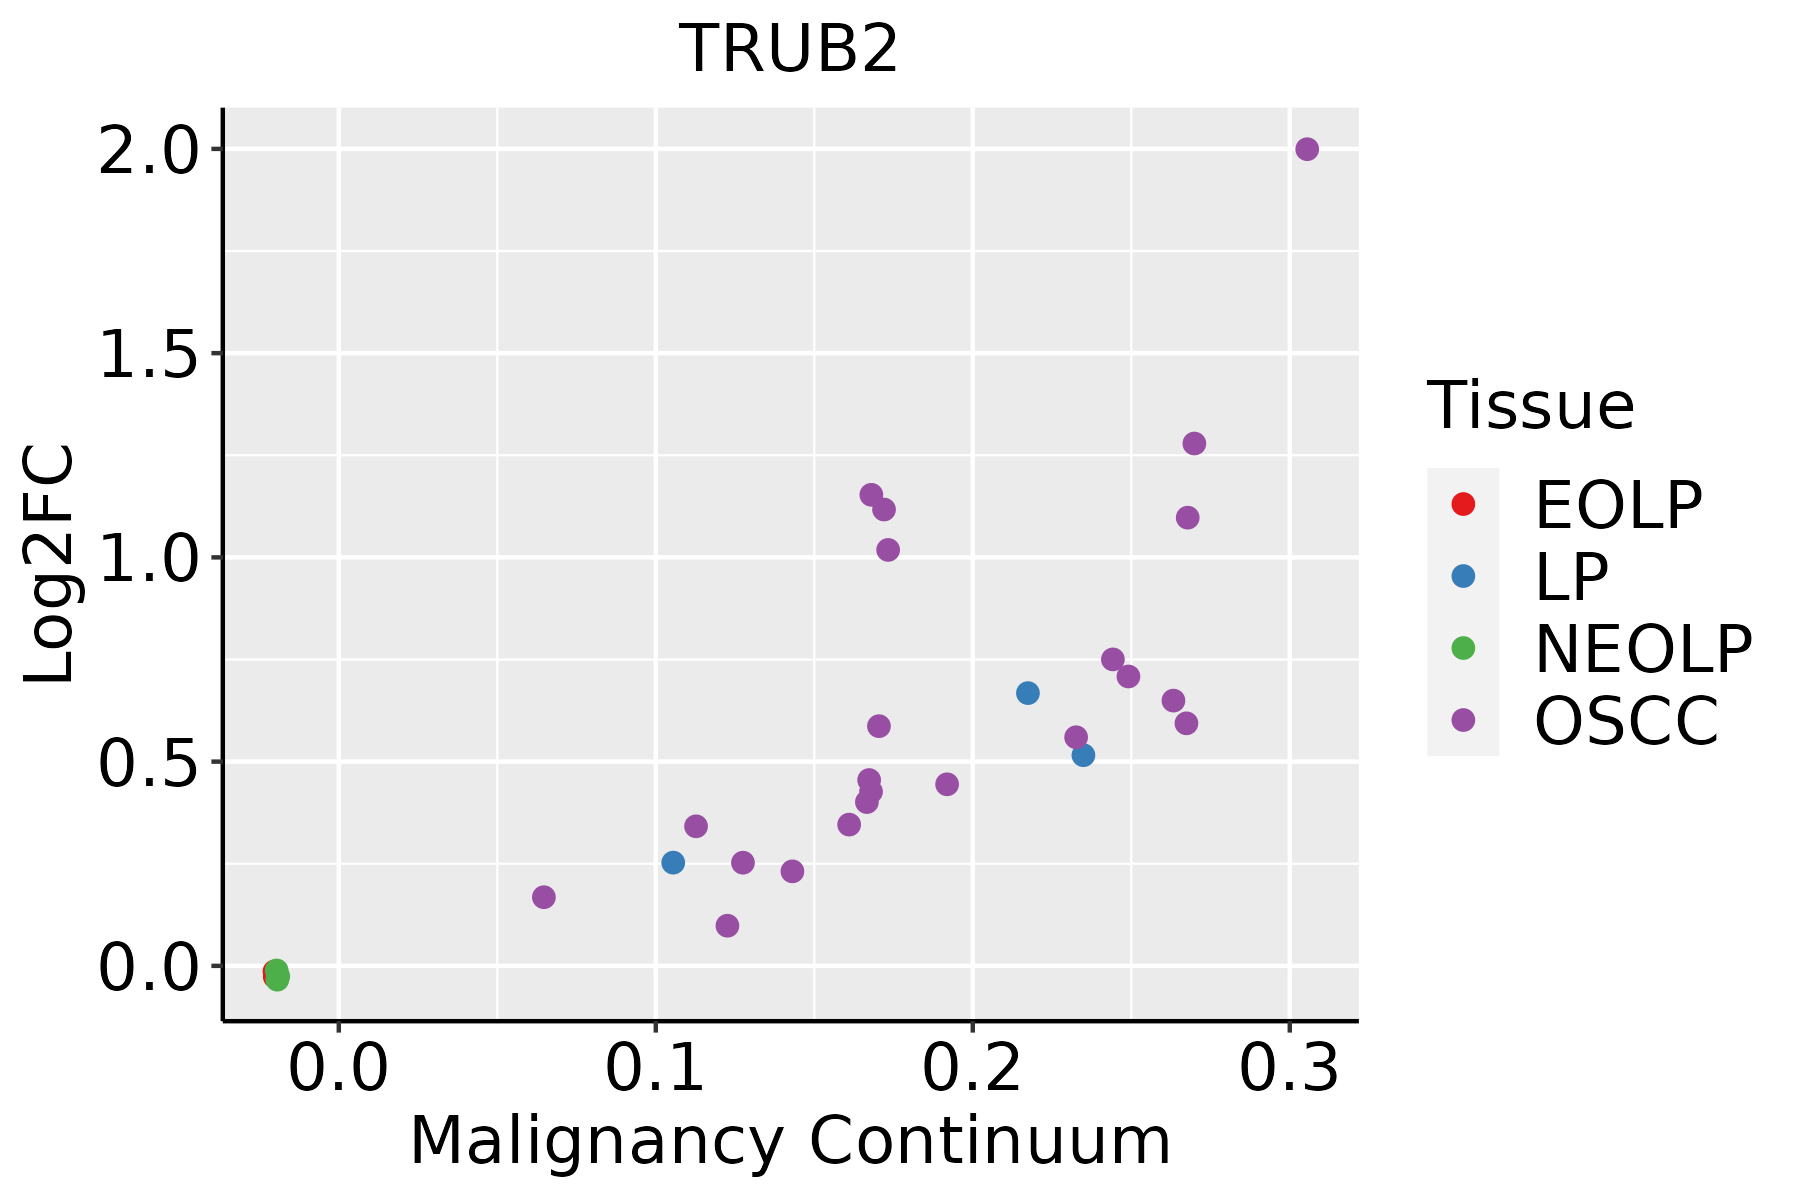 | EOLP: Erosive Oral lichen planus |
| LP: leukoplakia | ||
| NEOLP: Non-erosive oral lichen planus | ||
| OSCC: Oral squamous cell carcinoma | ||
| Skin | 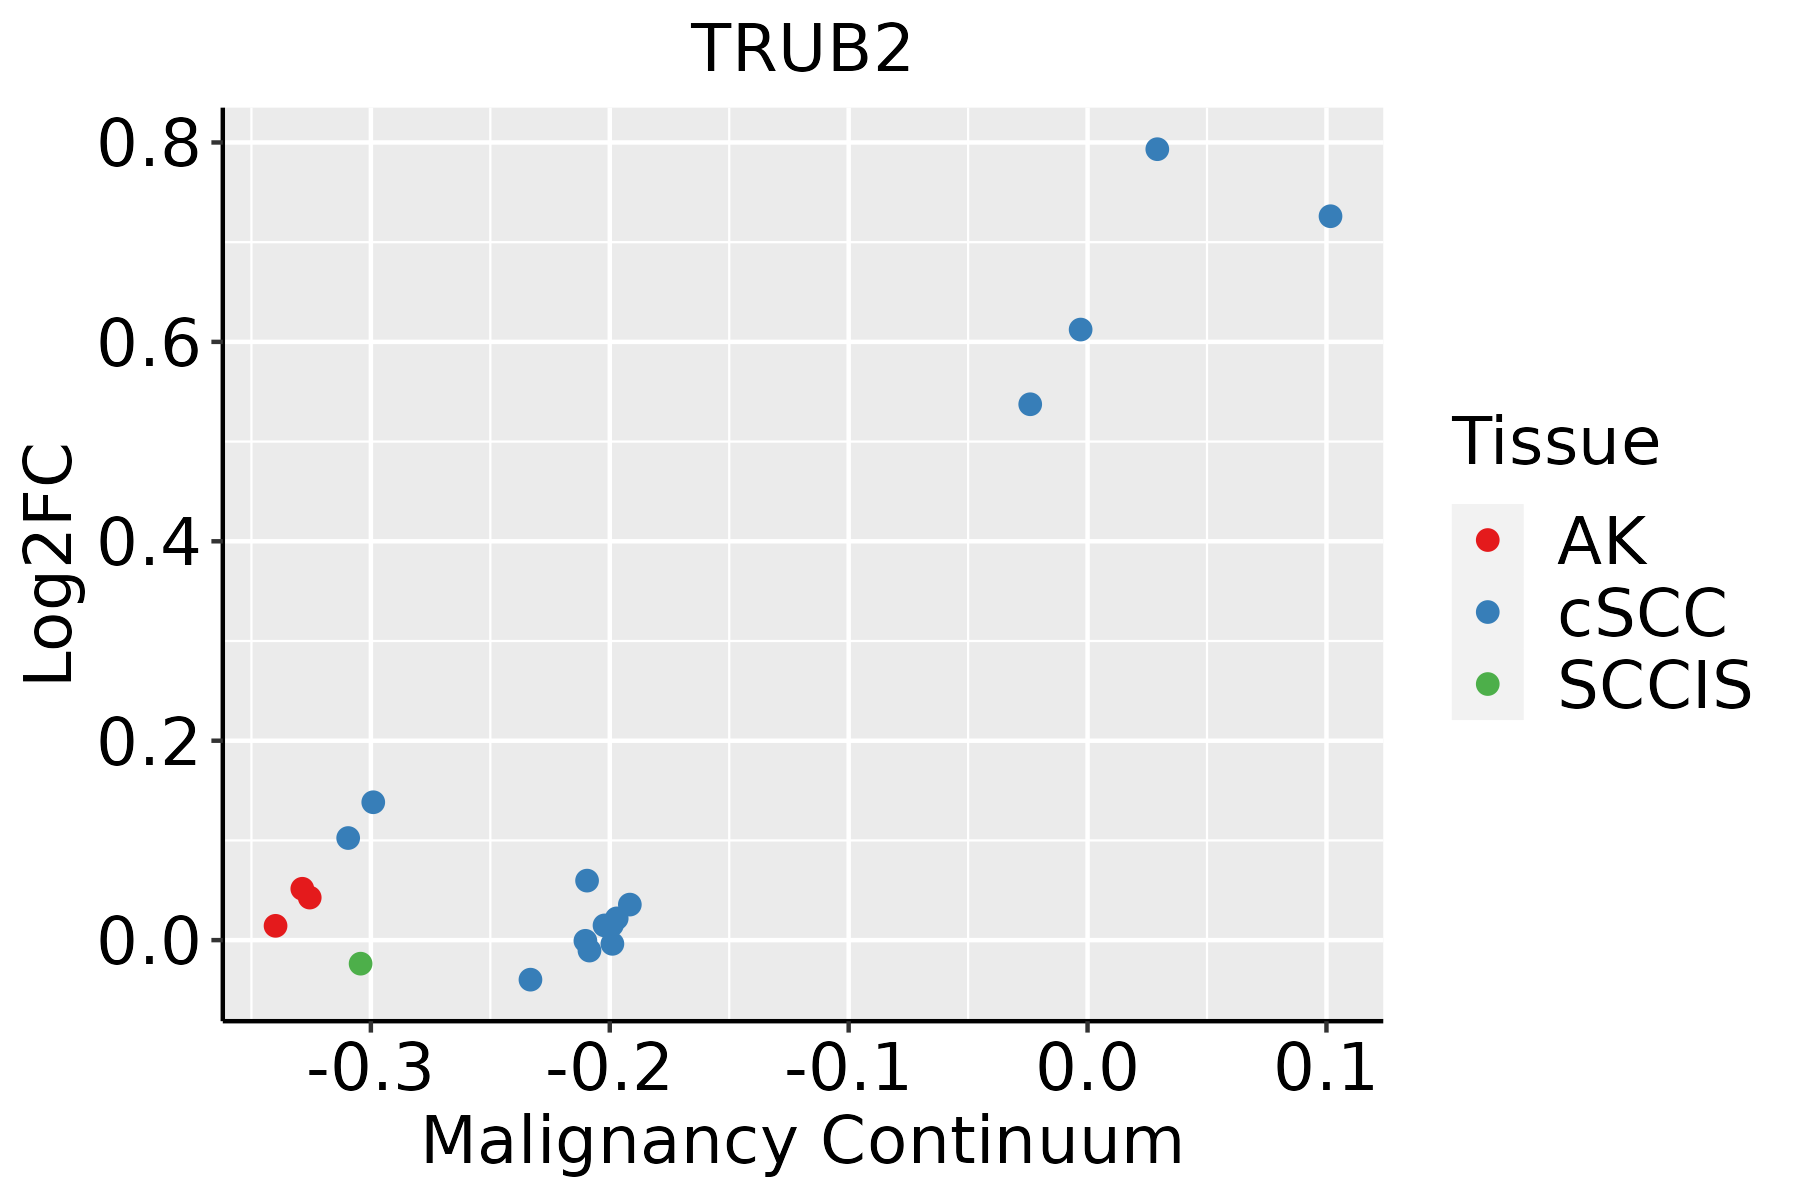 | AK: Actinic keratosis |
| cSCC: Cutaneous squamous cell carcinoma | ||
| SCCIS:squamous cell carcinoma in situ |
| ∗log2FC in expression of this searched gene in stem-like cells from each diseased tissue sample relative to stem-like cells in normal samples in each tissue plotted against the malignancy continuum. Samples are colored based on if they are from different disease stage. |
Top |
Malignant transformation related pathway analysis |
| Find out the enriched GO biological processes and KEGG pathways involved in transition from healthy to precancer to cancer |
| Tissue | Disease Stage | Enriched GO biological Processes |
| Colorectum | AD |  |
| Colorectum | SER |  |
| Colorectum | MSS |  |
| Colorectum | MSI-H |  |
| Colorectum | FAP |  |
| ∗Top 15 enriched GO BP terms are showed in the bar plot of each disease state in each tissue. Each row represents a significant GO biological process which is colored according to the -log10(p.adjust). |
| Page: 1 2 3 4 5 6 7 8 9 |
| GO ID | Tissue | Disease Stage | Description | Gene Ratio | Bg Ratio | pvalue | p.adjust | Count |
| GO:0006417 | Colorectum | AD | regulation of translation | 141/3918 | 468/18723 | 1.32e-06 | 4.22e-05 | 141 |
| GO:0034250 | Colorectum | AD | positive regulation of cellular amide metabolic process | 53/3918 | 162/18723 | 2.98e-04 | 3.60e-03 | 53 |
| GO:0045727 | Colorectum | AD | positive regulation of translation | 45/3918 | 136/18723 | 6.24e-04 | 6.48e-03 | 45 |
| GO:00064172 | Colorectum | MSS | regulation of translation | 134/3467 | 468/18723 | 4.43e-08 | 2.38e-06 | 134 |
| GO:00342502 | Colorectum | MSS | positive regulation of cellular amide metabolic process | 51/3467 | 162/18723 | 4.70e-05 | 8.60e-04 | 51 |
| GO:00457272 | Colorectum | MSS | positive regulation of translation | 43/3467 | 136/18723 | 1.60e-04 | 2.29e-03 | 43 |
| GO:00064173 | Colorectum | MSI-H | regulation of translation | 73/1319 | 468/18723 | 9.89e-11 | 1.66e-08 | 73 |
| GO:00457273 | Colorectum | MSI-H | positive regulation of translation | 33/1319 | 136/18723 | 2.28e-10 | 3.60e-08 | 33 |
| GO:00342503 | Colorectum | MSI-H | positive regulation of cellular amide metabolic process | 34/1319 | 162/18723 | 7.07e-09 | 8.93e-07 | 34 |
| GO:014005313 | Esophagus | ESCC | mitochondrial gene expression | 93/8552 | 108/18723 | 1.96e-18 | 2.03e-16 | 93 |
| GO:0006417111 | Esophagus | ESCC | regulation of translation | 304/8552 | 468/18723 | 1.53e-17 | 1.33e-15 | 304 |
| GO:003254314 | Esophagus | ESCC | mitochondrial translation | 68/8552 | 76/18723 | 1.02e-15 | 6.86e-14 | 68 |
| GO:0045727111 | Esophagus | ESCC | positive regulation of translation | 107/8552 | 136/18723 | 2.79e-15 | 1.68e-13 | 107 |
| GO:0034250111 | Esophagus | ESCC | positive regulation of cellular amide metabolic process | 123/8552 | 162/18723 | 3.32e-15 | 1.93e-13 | 123 |
| GO:00094512 | Esophagus | ESCC | RNA modification | 114/8552 | 167/18723 | 2.76e-09 | 6.04e-08 | 114 |
| GO:00701292 | Esophagus | ESCC | regulation of mitochondrial translation | 22/8552 | 24/18723 | 2.82e-06 | 3.21e-05 | 22 |
| GO:00621252 | Esophagus | ESCC | regulation of mitochondrial gene expression | 24/8552 | 28/18723 | 1.37e-05 | 1.25e-04 | 24 |
| GO:00701312 | Esophagus | ESCC | positive regulation of mitochondrial translation | 14/8552 | 15/18723 | 1.47e-04 | 9.85e-04 | 14 |
| GO:00015221 | Esophagus | ESCC | pseudouridine synthesis | 16/8552 | 18/18723 | 1.78e-04 | 1.15e-03 | 16 |
| GO:00165561 | Esophagus | ESCC | mRNA modification | 21/8552 | 27/18723 | 6.88e-04 | 3.61e-03 | 21 |
| Page: 1 2 3 |
| Pathway ID | Tissue | Disease Stage | Description | Gene Ratio | Bg Ratio | pvalue | p.adjust | qvalue | Count |
| Page: 1 |
Top |
Cell-cell communication analysis |
| Identification of potential cell-cell interactions between two cell types and their ligand-receptor pairs for different disease states |
| Ligand | Receptor | LRpair | Pathway | Tissue | Disease Stage |
| Page: 1 |
Top |
Single-cell gene regulatory network inference analysis |
| Find out the significant the regulons (TFs) and the target genes of each regulon across cell types for different disease states |
| TF | Cell Type | Tissue | Disease Stage | Target Gene | RSS | Regulon Activity |
| ∗The dot plots of a searched regulon are shown for all cell subpopulations in each disease state of each tissue based on the regulon specific score inferred using pySCENIC and by calculating the average expression. |
| Page: 1 |
Top |
Somatic mutation of malignant transformation related genes |
| Annotation of somatic variants for genes involved in malignant transformation |
| Hugo Symbol | Variant Class | Variant Classification | dbSNP RS | HGVSc | HGVSp | HGVSp Short | SWISSPROT | BIOTYPE | SIFT | PolyPhen | Tumor Sample Barcode | Tissue | Histology | Sex | Age | Stage | Therapy Types | Drugs | Outcome |
| TRUB2 | SNV | Missense_Mutation | novel | c.344T>A | p.Leu115His | p.L115H | O95900 | protein_coding | deleterious(0.04) | probably_damaging(0.99) | TCGA-A2-A0CP-01 | Breast | breast invasive carcinoma | Female | <65 | I/II | Chemotherapy | cytoxan | SD |
| TRUB2 | SNV | Missense_Mutation | novel | c.481N>A | p.Leu161Met | p.L161M | O95900 | protein_coding | tolerated(0.08) | probably_damaging(0.957) | TCGA-2W-A8YY-01 | Cervix | cervical & endocervical cancer | Female | <65 | I/II | Chemotherapy | cisplatin | CR |
| TRUB2 | SNV | Missense_Mutation | c.721N>C | p.Glu241Gln | p.E241Q | O95900 | protein_coding | deleterious(0.04) | probably_damaging(0.971) | TCGA-DS-A1OA-01 | Cervix | cervical & endocervical cancer | Female | >=65 | I/II | Chemotherapy | carboplatin | PD | |
| TRUB2 | SNV | Missense_Mutation | novel | c.218C>A | p.Pro73His | p.P73H | O95900 | protein_coding | deleterious(0) | probably_damaging(1) | TCGA-ZJ-AB0I-01 | Cervix | cervical & endocervical cancer | Female | <65 | I/II | Unknown | Unknown | SD |
| TRUB2 | SNV | Missense_Mutation | rs758941031 | c.706N>T | p.Arg236Trp | p.R236W | O95900 | protein_coding | deleterious(0.04) | probably_damaging(0.997) | TCGA-AA-3977-01 | Colorectum | colon adenocarcinoma | Male | >=65 | I/II | Unknown | Unknown | SD |
| TRUB2 | SNV | Missense_Mutation | rs549533426 | c.259G>A | p.Ala87Thr | p.A87T | O95900 | protein_coding | tolerated(1) | benign(0) | TCGA-AU-6004-01 | Colorectum | colon adenocarcinoma | Female | >=65 | I/II | Unknown | Unknown | SD |
| TRUB2 | SNV | Missense_Mutation | rs745336886 | c.773C>T | p.Thr258Met | p.T258M | O95900 | protein_coding | deleterious(0.02) | probably_damaging(0.95) | TCGA-AZ-4313-01 | Colorectum | colon adenocarcinoma | Female | <65 | I/II | Unknown | Unknown | SD |
| TRUB2 | SNV | Missense_Mutation | c.728G>C | p.Gly243Ala | p.G243A | O95900 | protein_coding | deleterious(0) | probably_damaging(0.999) | TCGA-CA-6715-01 | Colorectum | colon adenocarcinoma | Male | <65 | III/IV | Chemotherapy | oxaliplatin | CR | |
| TRUB2 | SNV | Missense_Mutation | novel | c.908A>G | p.Asp303Gly | p.D303G | O95900 | protein_coding | tolerated_low_confidence(1) | benign(0) | TCGA-CA-6717-01 | Colorectum | colon adenocarcinoma | Male | <65 | I/II | Chemotherapy | oxaliplatin | CR |
| TRUB2 | SNV | Missense_Mutation | c.698N>G | p.Lys233Arg | p.K233R | O95900 | protein_coding | tolerated(0.18) | benign(0.019) | TCGA-CA-6718-01 | Colorectum | colon adenocarcinoma | Male | <65 | I/II | Unknown | Unknown | PD |
| Page: 1 2 3 |
Top |
Related drugs of malignant transformation related genes |
| Identification of chemicals and drugs interact with genes involved in malignant transfromation |
| (DGIdb 4.0) |
| Entrez ID | Symbol | Category | Interaction Types | Drug Claim Name | Drug Name | PMIDs |
| Page: 1 |

Copyright 2023-Present -The University of Texas Health Science Center at Houston |