
|
|||||
|
 | |
| |
| |
| |
| |
| |
|
Gene: TRUB1 |
Gene summary for TRUB1 |
| Gene information | Species | Human | Gene symbol | TRUB1 | Gene ID | 142940 |
| Gene name | TruB pseudouridine synthase family member 1 | |
| Gene Alias | PUS4 | |
| Cytomap | 10q25.3 | |
| Gene Type | protein-coding | GO ID | GO:0001522 | UniProtAcc | Q8WWH5 |
Top |
Malignant transformation analysis |
| Identification of the aberrant gene expression in precancerous and cancerous lesions by comparing the gene expression of stem-like cells in diseased tissues with normal stem cells |
| Entrez ID | Symbol | Replicates | Species | Organ | Tissue | Adj P-value | Log2FC | Malignancy |
| 142940 | TRUB1 | LZE4T | Human | Esophagus | ESCC | 1.16e-04 | 7.67e-02 | 0.0811 |
| 142940 | TRUB1 | LZE7T | Human | Esophagus | ESCC | 1.14e-02 | 1.33e-01 | 0.0667 |
| 142940 | TRUB1 | LZE8T | Human | Esophagus | ESCC | 2.06e-06 | 1.12e-01 | 0.067 |
| 142940 | TRUB1 | LZE24T | Human | Esophagus | ESCC | 5.34e-10 | 2.35e-01 | 0.0596 |
| 142940 | TRUB1 | P2T-E | Human | Esophagus | ESCC | 3.69e-28 | 3.51e-01 | 0.1177 |
| 142940 | TRUB1 | P4T-E | Human | Esophagus | ESCC | 3.48e-25 | 5.16e-01 | 0.1323 |
| 142940 | TRUB1 | P5T-E | Human | Esophagus | ESCC | 8.39e-14 | 2.47e-01 | 0.1327 |
| 142940 | TRUB1 | P8T-E | Human | Esophagus | ESCC | 1.72e-08 | 1.48e-01 | 0.0889 |
| 142940 | TRUB1 | P10T-E | Human | Esophagus | ESCC | 1.30e-10 | 8.32e-02 | 0.116 |
| 142940 | TRUB1 | P11T-E | Human | Esophagus | ESCC | 6.14e-09 | 3.18e-01 | 0.1426 |
| 142940 | TRUB1 | P12T-E | Human | Esophagus | ESCC | 1.02e-16 | 2.61e-01 | 0.1122 |
| 142940 | TRUB1 | P15T-E | Human | Esophagus | ESCC | 7.88e-17 | 2.03e-01 | 0.1149 |
| 142940 | TRUB1 | P16T-E | Human | Esophagus | ESCC | 9.19e-20 | 3.64e-01 | 0.1153 |
| 142940 | TRUB1 | P17T-E | Human | Esophagus | ESCC | 2.28e-03 | 9.68e-02 | 0.1278 |
| 142940 | TRUB1 | P20T-E | Human | Esophagus | ESCC | 2.99e-08 | 1.21e-01 | 0.1124 |
| 142940 | TRUB1 | P21T-E | Human | Esophagus | ESCC | 9.16e-12 | 1.70e-01 | 0.1617 |
| 142940 | TRUB1 | P22T-E | Human | Esophagus | ESCC | 2.09e-13 | 1.62e-01 | 0.1236 |
| 142940 | TRUB1 | P23T-E | Human | Esophagus | ESCC | 4.19e-12 | 2.66e-01 | 0.108 |
| 142940 | TRUB1 | P24T-E | Human | Esophagus | ESCC | 6.64e-09 | 1.35e-01 | 0.1287 |
| 142940 | TRUB1 | P26T-E | Human | Esophagus | ESCC | 1.97e-23 | 3.73e-01 | 0.1276 |
| Page: 1 2 3 |
| Tissue | Expression Dynamics | Abbreviation |
| Esophagus | 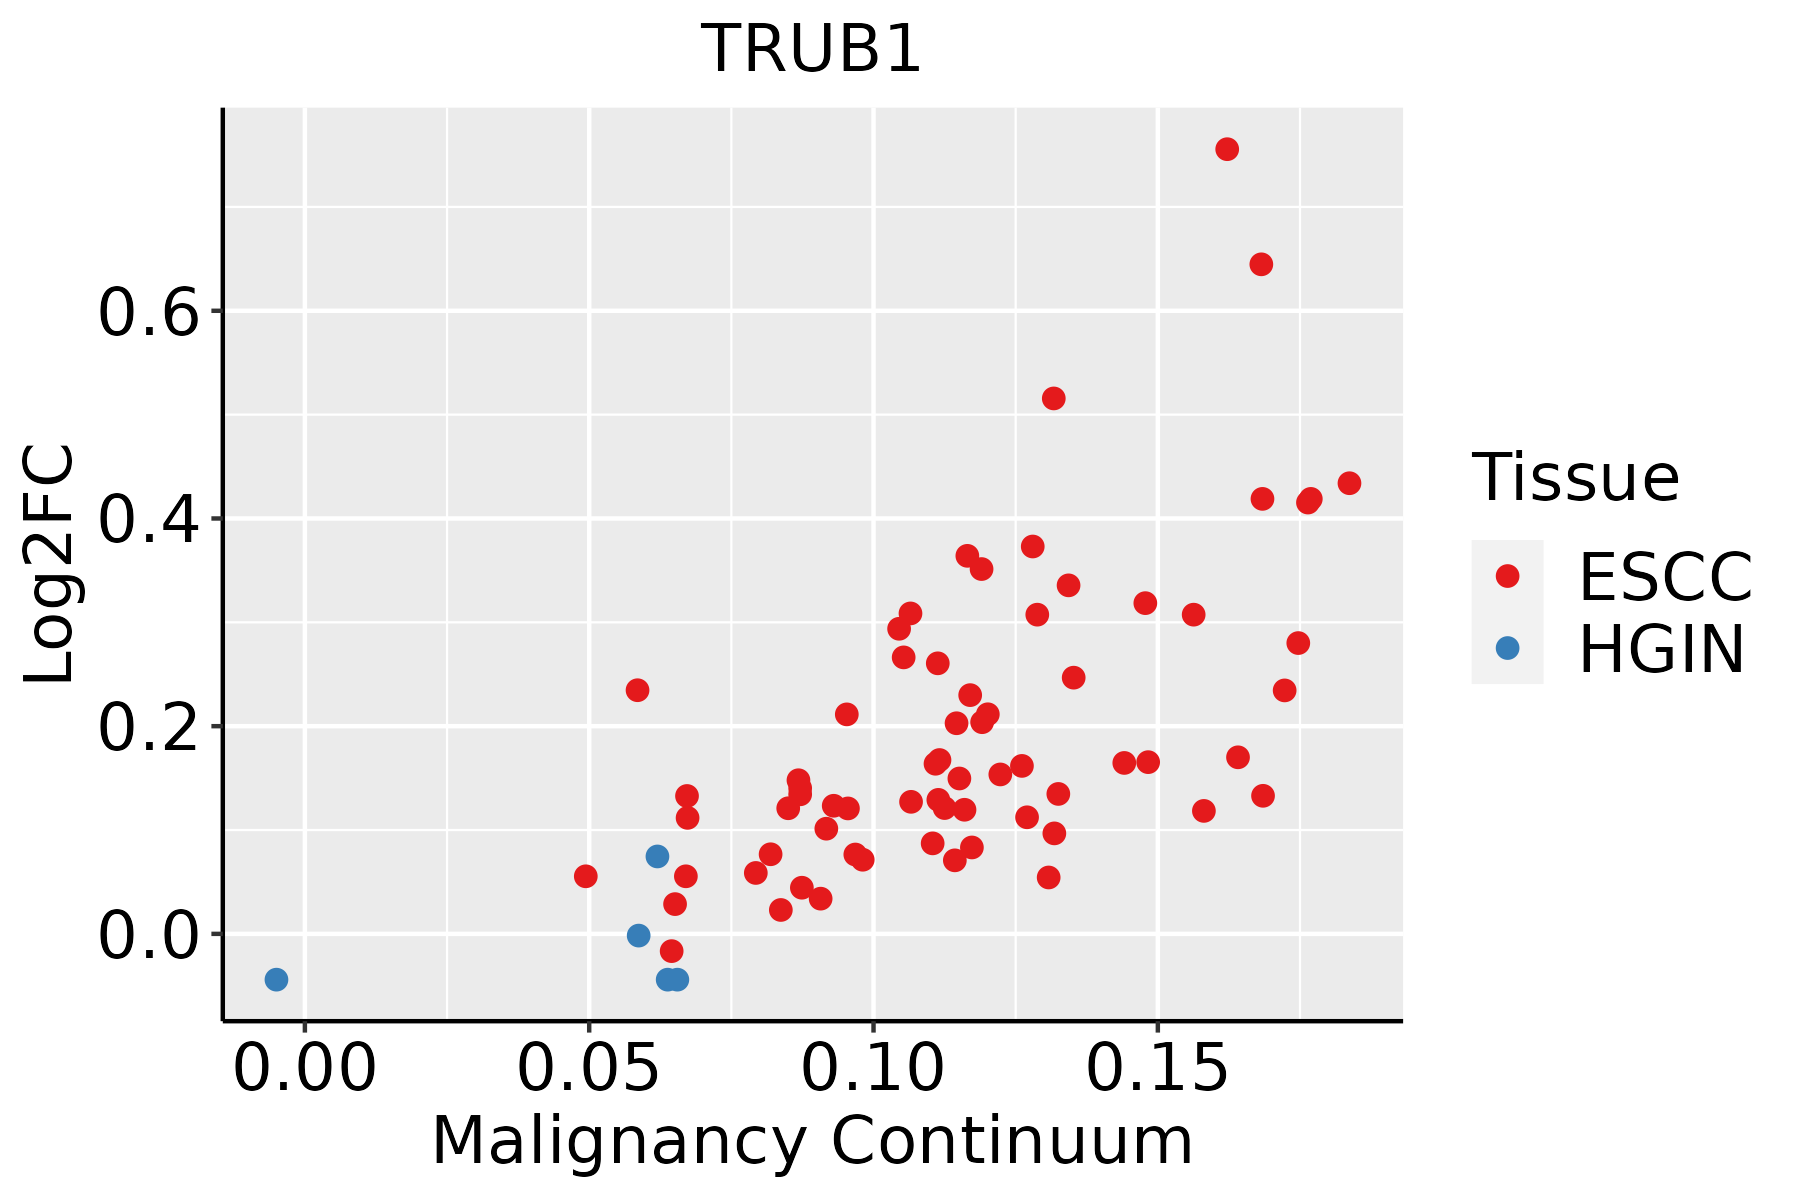 | ESCC: Esophageal squamous cell carcinoma |
| HGIN: High-grade intraepithelial neoplasias | ||
| LGIN: Low-grade intraepithelial neoplasias |
| ∗log2FC in expression of this searched gene in stem-like cells from each diseased tissue sample relative to stem-like cells in normal samples in each tissue plotted against the malignancy continuum. Samples are colored based on if they are from different disease stage. |
Top |
Malignant transformation related pathway analysis |
| Find out the enriched GO biological processes and KEGG pathways involved in transition from healthy to precancer to cancer |
| Tissue | Disease Stage | Enriched GO biological Processes |
| Colorectum | AD |  |
| Colorectum | SER |  |
| Colorectum | MSS |  |
| Colorectum | MSI-H |  |
| Colorectum | FAP |  |
| ∗Top 15 enriched GO BP terms are showed in the bar plot of each disease state in each tissue. Each row represents a significant GO biological process which is colored according to the -log10(p.adjust). |
| Page: 1 2 3 4 5 6 7 8 9 |
| GO ID | Tissue | Disease Stage | Description | Gene Ratio | Bg Ratio | pvalue | p.adjust | Count |
| GO:003447015 | Esophagus | ESCC | ncRNA processing | 300/8552 | 395/18723 | 3.09e-35 | 3.26e-32 | 300 |
| GO:003466012 | Esophagus | ESCC | ncRNA metabolic process | 346/8552 | 485/18723 | 4.35e-31 | 2.51e-28 | 346 |
| GO:00080333 | Esophagus | ESCC | tRNA processing | 92/8552 | 127/18723 | 7.83e-10 | 1.93e-08 | 92 |
| GO:00063992 | Esophagus | ESCC | tRNA metabolic process | 122/8552 | 179/18723 | 9.03e-10 | 2.19e-08 | 122 |
| GO:00094512 | Esophagus | ESCC | RNA modification | 114/8552 | 167/18723 | 2.76e-09 | 6.04e-08 | 114 |
| GO:00064002 | Esophagus | ESCC | tRNA modification | 62/8552 | 90/18723 | 7.02e-06 | 7.04e-05 | 62 |
| GO:00015221 | Esophagus | ESCC | pseudouridine synthesis | 16/8552 | 18/18723 | 1.78e-04 | 1.15e-03 | 16 |
| GO:00165561 | Esophagus | ESCC | mRNA modification | 21/8552 | 27/18723 | 6.88e-04 | 3.61e-03 | 21 |
| Page: 1 |
| Pathway ID | Tissue | Disease Stage | Description | Gene Ratio | Bg Ratio | pvalue | p.adjust | qvalue | Count |
| Page: 1 |
Top |
Cell-cell communication analysis |
| Identification of potential cell-cell interactions between two cell types and their ligand-receptor pairs for different disease states |
| Ligand | Receptor | LRpair | Pathway | Tissue | Disease Stage |
| Page: 1 |
Top |
Single-cell gene regulatory network inference analysis |
| Find out the significant the regulons (TFs) and the target genes of each regulon across cell types for different disease states |
| TF | Cell Type | Tissue | Disease Stage | Target Gene | RSS | Regulon Activity |
| ∗The dot plots of a searched regulon are shown for all cell subpopulations in each disease state of each tissue based on the regulon specific score inferred using pySCENIC and by calculating the average expression. |
| Page: 1 |
Top |
Somatic mutation of malignant transformation related genes |
| Annotation of somatic variants for genes involved in malignant transformation |
| Hugo Symbol | Variant Class | Variant Classification | dbSNP RS | HGVSc | HGVSp | HGVSp Short | SWISSPROT | BIOTYPE | SIFT | PolyPhen | Tumor Sample Barcode | Tissue | Histology | Sex | Age | Stage | Therapy Types | Drugs | Outcome |
| TRUB1 | SNV | Missense_Mutation | rs749731109 | c.669A>C | p.Lys223Asn | p.K223N | Q8WWH5 | protein_coding | deleterious(0) | benign(0.403) | TCGA-A7-A26G-01 | Breast | breast invasive carcinoma | Female | <65 | I/II | Chemotherapy | taxotere | SD |
| TRUB1 | SNV | Missense_Mutation | c.395N>A | p.Ile132Asn | p.I132N | Q8WWH5 | protein_coding | deleterious(0) | probably_damaging(0.956) | TCGA-AN-A0AR-01 | Breast | breast invasive carcinoma | Female | <65 | I/II | Unknown | Unknown | SD | |
| TRUB1 | SNV | Missense_Mutation | novel | c.80N>A | p.Thr27Lys | p.T27K | Q8WWH5 | protein_coding | deleterious_low_confidence(0) | benign(0.339) | TCGA-AO-A0JB-01 | Breast | breast invasive carcinoma | Female | <65 | III/IV | Chemotherapy | cyclophosphamide | SD |
| TRUB1 | SNV | Missense_Mutation | rs756464725 | c.419N>T | p.Thr140Ile | p.T140I | Q8WWH5 | protein_coding | tolerated(0.11) | possibly_damaging(0.664) | TCGA-D8-A27N-01 | Breast | breast invasive carcinoma | Female | <65 | III/IV | Chemotherapy | taxol+adriamycin+cyclophosphamide+herceptin | SD |
| TRUB1 | SNV | Missense_Mutation | rs749731109 | c.669A>C | p.Lys223Asn | p.K223N | Q8WWH5 | protein_coding | deleterious(0) | benign(0.403) | TCGA-E9-A1NG-01 | Breast | breast invasive carcinoma | Female | <65 | I/II | Hormone Therapy | letrozole | SD |
| TRUB1 | SNV | Missense_Mutation | rs749731109 | c.669N>C | p.Lys223Asn | p.K223N | Q8WWH5 | protein_coding | deleterious(0) | benign(0.403) | TCGA-E9-A227-01 | Breast | breast invasive carcinoma | Female | <65 | I/II | Chemotherapy | taxotere | CR |
| TRUB1 | insertion | Frame_Shift_Ins | novel | c.78_79insGCAAGCTCTTGGTCTATATGGG | p.Thr27AlafsTer141 | p.T27Afs*141 | Q8WWH5 | protein_coding | TCGA-AO-A0JB-01 | Breast | breast invasive carcinoma | Female | <65 | III/IV | Chemotherapy | cyclophosphamide | SD | ||
| TRUB1 | SNV | Missense_Mutation | novel | c.469A>G | p.Lys157Glu | p.K157E | Q8WWH5 | protein_coding | tolerated(0.1) | benign(0.102) | TCGA-EA-A410-01 | Cervix | cervical & endocervical cancer | Female | <65 | I/II | Unknown | Unknown | SD |
| TRUB1 | SNV | Missense_Mutation | c.245N>T | p.Ser82Leu | p.S82L | Q8WWH5 | protein_coding | deleterious(0) | probably_damaging(0.994) | TCGA-JX-A3Q0-01 | Cervix | cervical & endocervical cancer | Female | <65 | III/IV | Unknown | Unknown | SD | |
| TRUB1 | SNV | Missense_Mutation | novel | c.1030G>T | p.Asp344Tyr | p.D344Y | Q8WWH5 | protein_coding | deleterious_low_confidence(0) | benign(0.219) | TCGA-AZ-4315-01 | Colorectum | colon adenocarcinoma | Male | <65 | I/II | Unknown | Unknown | SD |
| Page: 1 2 3 4 |
Top |
Related drugs of malignant transformation related genes |
| Identification of chemicals and drugs interact with genes involved in malignant transfromation |
| (DGIdb 4.0) |
| Entrez ID | Symbol | Category | Interaction Types | Drug Claim Name | Drug Name | PMIDs |
| Page: 1 |

Copyright 2023-Present -The University of Texas Health Science Center at Houston |