
|
|||||
|
 | |
| |
| |
| |
| |
| |
|
Gene: TRRAP |
Gene summary for TRRAP |
| Gene information | Species | Human | Gene symbol | TRRAP | Gene ID | 8295 |
| Gene name | transformation/transcription domain associated protein | |
| Gene Alias | DEDDFA | |
| Cytomap | 7q22.1 | |
| Gene Type | protein-coding | GO ID | GO:0006139 | UniProtAcc | Q9Y4A5 |
Top |
Malignant transformation analysis |
| Identification of the aberrant gene expression in precancerous and cancerous lesions by comparing the gene expression of stem-like cells in diseased tissues with normal stem cells |
| Entrez ID | Symbol | Replicates | Species | Organ | Tissue | Adj P-value | Log2FC | Malignancy |
| 8295 | TRRAP | CCI_1 | Human | Cervix | CC | 7.12e-08 | 8.76e-01 | 0.528 |
| 8295 | TRRAP | CCI_2 | Human | Cervix | CC | 1.10e-06 | 6.56e-01 | 0.5249 |
| 8295 | TRRAP | CCI_3 | Human | Cervix | CC | 3.68e-07 | 6.56e-01 | 0.516 |
| 8295 | TRRAP | LZE5T | Human | Esophagus | ESCC | 1.35e-03 | 2.30e-01 | 0.0514 |
| 8295 | TRRAP | LZE7T | Human | Esophagus | ESCC | 1.28e-08 | 3.46e-01 | 0.0667 |
| 8295 | TRRAP | LZE24T | Human | Esophagus | ESCC | 1.17e-09 | 2.96e-01 | 0.0596 |
| 8295 | TRRAP | LZE21T | Human | Esophagus | ESCC | 1.81e-02 | 2.09e-01 | 0.0655 |
| 8295 | TRRAP | LZE6T | Human | Esophagus | ESCC | 8.69e-03 | 1.67e-01 | 0.0845 |
| 8295 | TRRAP | P1T-E | Human | Esophagus | ESCC | 2.93e-05 | 2.74e-01 | 0.0875 |
| 8295 | TRRAP | P2T-E | Human | Esophagus | ESCC | 2.39e-24 | 3.62e-01 | 0.1177 |
| 8295 | TRRAP | P4T-E | Human | Esophagus | ESCC | 5.42e-15 | 2.89e-01 | 0.1323 |
| 8295 | TRRAP | P5T-E | Human | Esophagus | ESCC | 4.17e-05 | 1.18e-01 | 0.1327 |
| 8295 | TRRAP | P8T-E | Human | Esophagus | ESCC | 5.00e-17 | 2.66e-01 | 0.0889 |
| 8295 | TRRAP | P9T-E | Human | Esophagus | ESCC | 1.57e-11 | 1.81e-01 | 0.1131 |
| 8295 | TRRAP | P10T-E | Human | Esophagus | ESCC | 2.56e-16 | 2.87e-01 | 0.116 |
| 8295 | TRRAP | P11T-E | Human | Esophagus | ESCC | 1.75e-07 | 2.87e-01 | 0.1426 |
| 8295 | TRRAP | P12T-E | Human | Esophagus | ESCC | 8.73e-28 | 4.88e-01 | 0.1122 |
| 8295 | TRRAP | P15T-E | Human | Esophagus | ESCC | 4.89e-23 | 4.87e-01 | 0.1149 |
| 8295 | TRRAP | P16T-E | Human | Esophagus | ESCC | 6.54e-32 | 5.81e-01 | 0.1153 |
| 8295 | TRRAP | P17T-E | Human | Esophagus | ESCC | 1.51e-02 | 2.32e-01 | 0.1278 |
| Page: 1 2 3 4 5 6 |
| Tissue | Expression Dynamics | Abbreviation |
| Cervix |  | CC: Cervix cancer |
| HSIL_HPV: HPV-infected high-grade squamous intraepithelial lesions | ||
| N_HPV: HPV-infected normal cervix | ||
| Esophagus |  | ESCC: Esophageal squamous cell carcinoma |
| HGIN: High-grade intraepithelial neoplasias | ||
| LGIN: Low-grade intraepithelial neoplasias | ||
| Liver |  | HCC: Hepatocellular carcinoma |
| NAFLD: Non-alcoholic fatty liver disease | ||
| Lung | 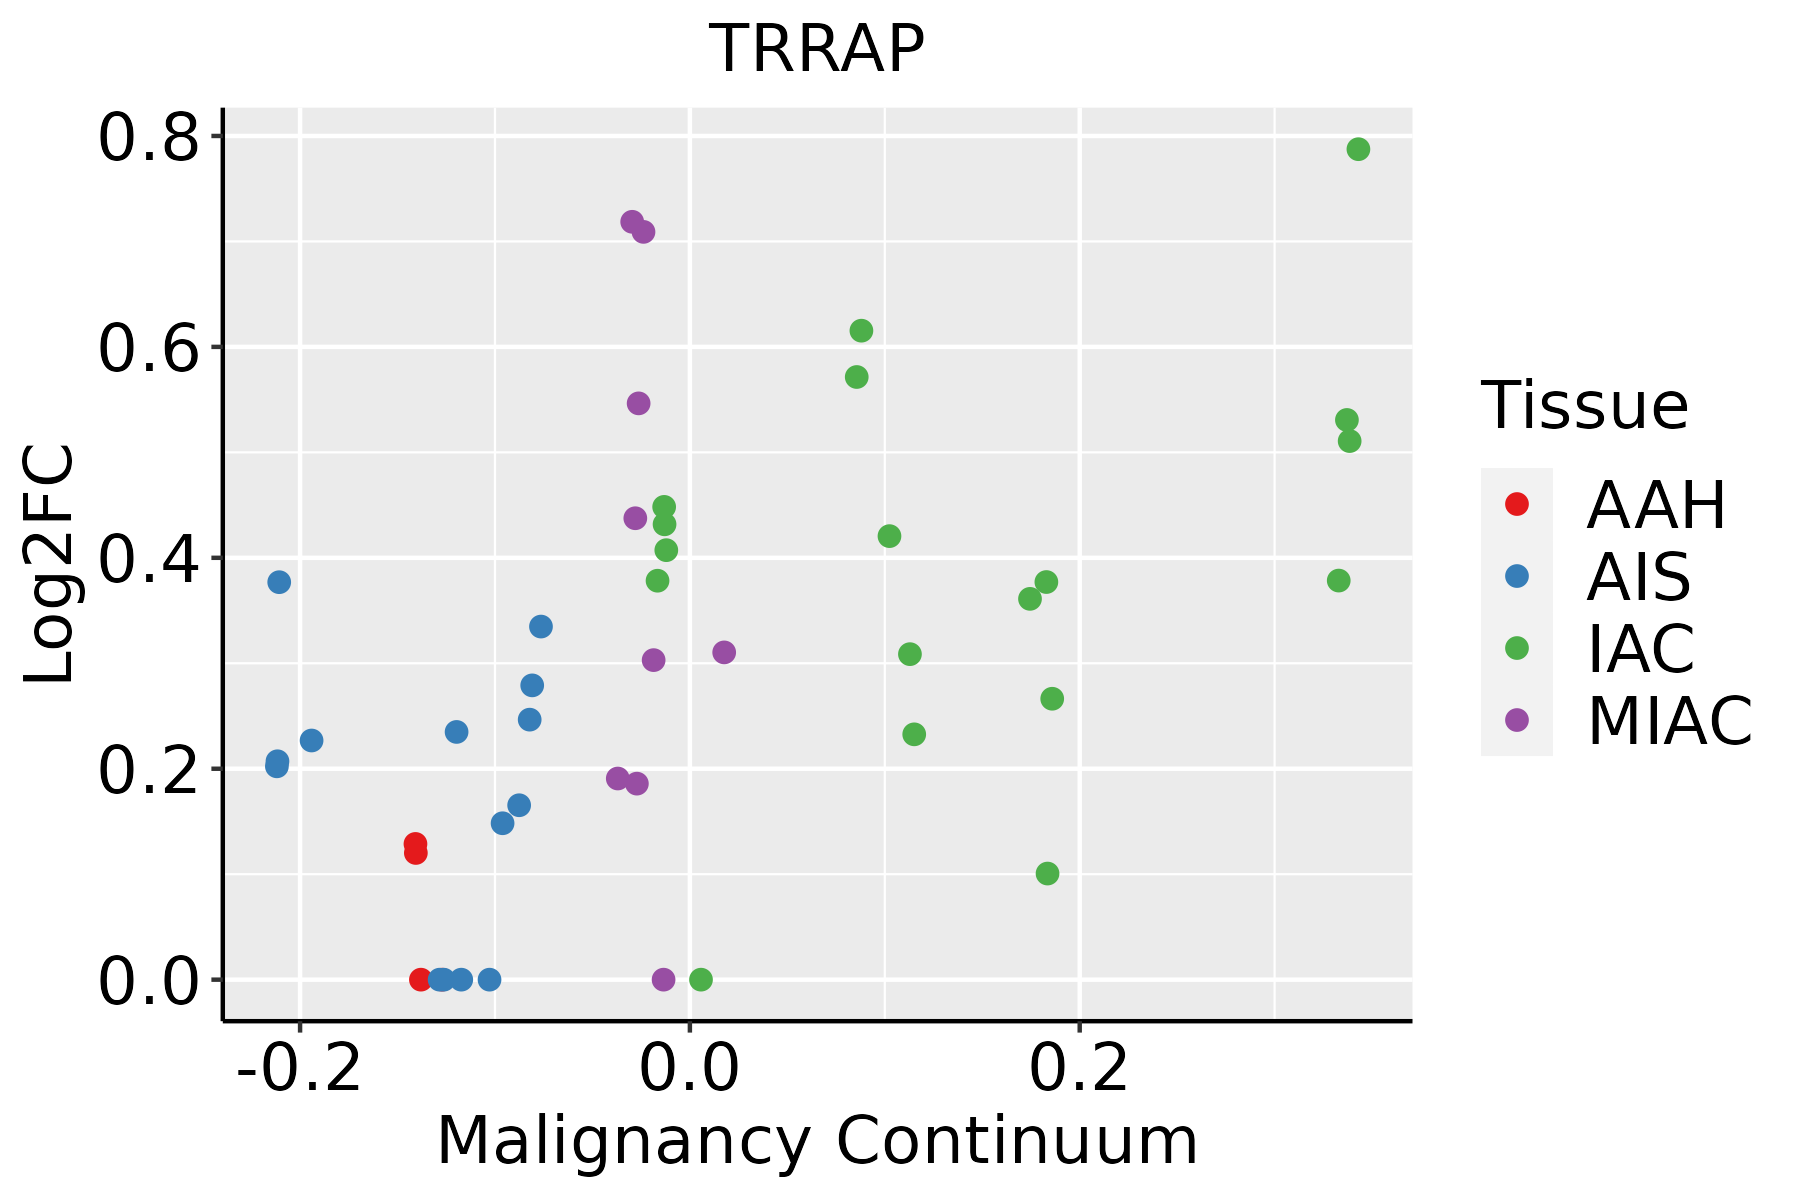 | AAH: Atypical adenomatous hyperplasia |
| AIS: Adenocarcinoma in situ | ||
| IAC: Invasive lung adenocarcinoma | ||
| MIA: Minimally invasive adenocarcinoma | ||
| Thyroid | 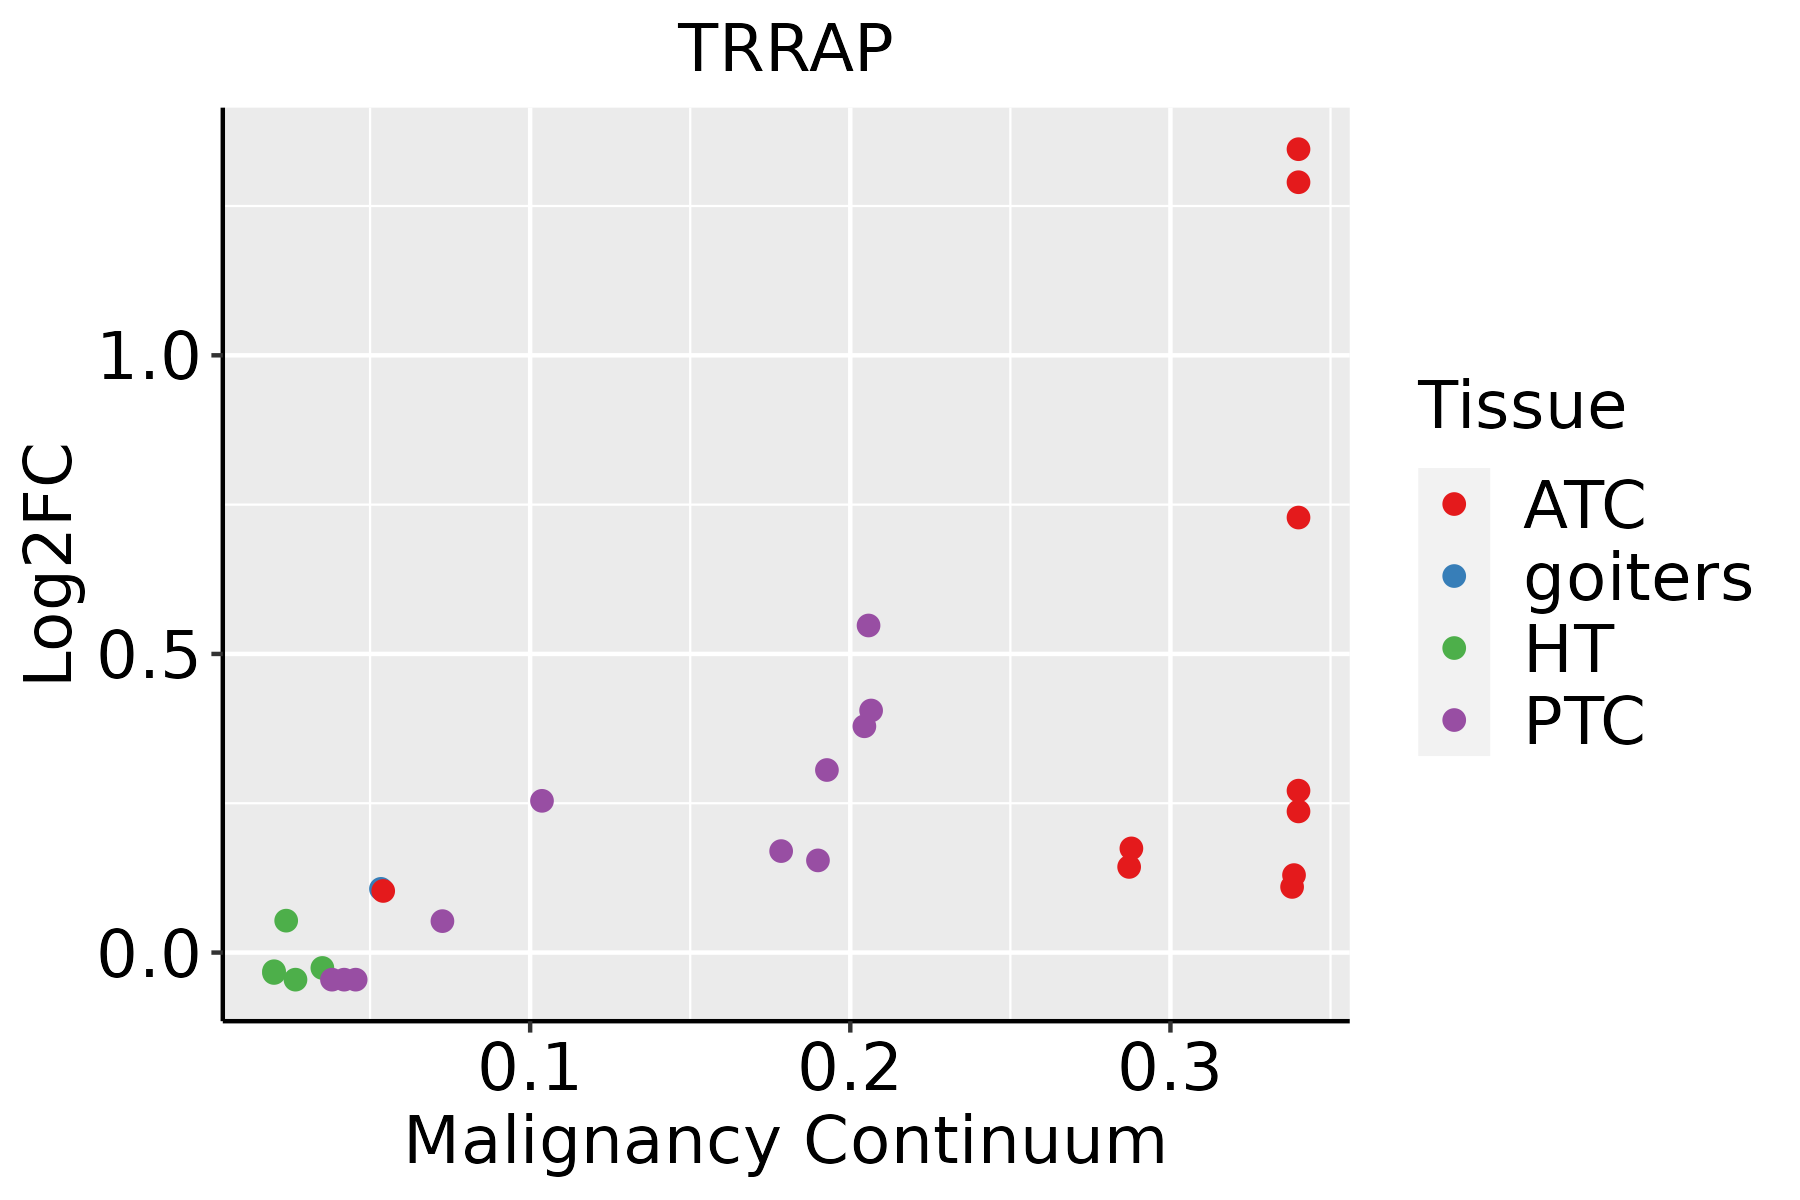 | ATC: Anaplastic thyroid cancer |
| HT: Hashimoto's thyroiditis | ||
| PTC: Papillary thyroid cancer |
| ∗log2FC in expression of this searched gene in stem-like cells from each diseased tissue sample relative to stem-like cells in normal samples in each tissue plotted against the malignancy continuum. Samples are colored based on if they are from different disease stage. |
Top |
Malignant transformation related pathway analysis |
| Find out the enriched GO biological processes and KEGG pathways involved in transition from healthy to precancer to cancer |
| Tissue | Disease Stage | Enriched GO biological Processes |
| Colorectum | AD |  |
| Colorectum | SER |  |
| Colorectum | MSS |  |
| Colorectum | MSI-H |  |
| Colorectum | FAP |  |
| ∗Top 15 enriched GO BP terms are showed in the bar plot of each disease state in each tissue. Each row represents a significant GO biological process which is colored according to the -log10(p.adjust). |
| Page: 1 2 3 4 5 6 7 8 9 |
| GO ID | Tissue | Disease Stage | Description | Gene Ratio | Bg Ratio | pvalue | p.adjust | Count |
| GO:00165705 | Cervix | CC | histone modification | 84/2311 | 463/18723 | 1.70e-04 | 2.01e-03 | 84 |
| GO:00182054 | Cervix | CC | peptidyl-lysine modification | 62/2311 | 376/18723 | 1.04e-02 | 4.97e-02 | 62 |
| GO:001657015 | Esophagus | ESCC | histone modification | 323/8552 | 463/18723 | 2.61e-26 | 7.88e-24 | 323 |
| GO:001820514 | Esophagus | ESCC | peptidyl-lysine modification | 259/8552 | 376/18723 | 3.90e-20 | 5.26e-18 | 259 |
| GO:001839413 | Esophagus | ESCC | peptidyl-lysine acetylation | 123/8552 | 169/18723 | 6.58e-13 | 2.94e-11 | 123 |
| GO:004354313 | Esophagus | ESCC | protein acylation | 165/8552 | 243/18723 | 1.69e-12 | 7.14e-11 | 165 |
| GO:000647313 | Esophagus | ESCC | protein acetylation | 140/8552 | 201/18723 | 4.37e-12 | 1.69e-10 | 140 |
| GO:001839313 | Esophagus | ESCC | internal peptidyl-lysine acetylation | 114/8552 | 158/18723 | 1.16e-11 | 4.24e-10 | 114 |
| GO:000647513 | Esophagus | ESCC | internal protein amino acid acetylation | 115/8552 | 160/18723 | 1.43e-11 | 5.08e-10 | 115 |
| GO:00165735 | Esophagus | ESCC | histone acetylation | 110/8552 | 152/18723 | 1.95e-11 | 6.81e-10 | 110 |
| GO:004396712 | Esophagus | ESCC | histone H4 acetylation | 53/8552 | 67/18723 | 2.11e-08 | 4.03e-07 | 53 |
| GO:007064612 | Esophagus | ESCC | protein modification by small protein removal | 95/8552 | 157/18723 | 1.25e-04 | 8.56e-04 | 95 |
| GO:00439682 | Esophagus | ESCC | histone H2A acetylation | 15/8552 | 17/18723 | 3.48e-04 | 2.03e-03 | 15 |
| GO:00165783 | Esophagus | ESCC | histone deubiquitination | 18/8552 | 23/18723 | 1.50e-03 | 7.06e-03 | 18 |
| GO:00165793 | Esophagus | ESCC | protein deubiquitination | 79/8552 | 139/18723 | 5.23e-03 | 1.97e-02 | 79 |
| GO:00165703 | Liver | NAFLD | histone modification | 90/1882 | 463/18723 | 5.74e-10 | 1.28e-07 | 90 |
| GO:0018205 | Liver | NAFLD | peptidyl-lysine modification | 65/1882 | 376/18723 | 9.42e-06 | 3.02e-04 | 65 |
| GO:0043543 | Liver | NAFLD | protein acylation | 43/1882 | 243/18723 | 1.70e-04 | 3.07e-03 | 43 |
| GO:0006473 | Liver | NAFLD | protein acetylation | 37/1882 | 201/18723 | 2.10e-04 | 3.61e-03 | 37 |
| GO:0018394 | Liver | NAFLD | peptidyl-lysine acetylation | 32/1882 | 169/18723 | 3.24e-04 | 5.00e-03 | 32 |
| Page: 1 2 3 4 |
| Pathway ID | Tissue | Disease Stage | Description | Gene Ratio | Bg Ratio | pvalue | p.adjust | qvalue | Count |
| hsa0516620 | Cervix | CC | Human T-cell leukemia virus 1 infection | 61/1267 | 222/8465 | 8.13e-07 | 7.98e-06 | 4.72e-06 | 61 |
| hsa05166110 | Cervix | CC | Human T-cell leukemia virus 1 infection | 61/1267 | 222/8465 | 8.13e-07 | 7.98e-06 | 4.72e-06 | 61 |
| hsa05166211 | Esophagus | ESCC | Human T-cell leukemia virus 1 infection | 164/4205 | 222/8465 | 8.13e-14 | 2.09e-12 | 1.07e-12 | 164 |
| hsa05166310 | Esophagus | ESCC | Human T-cell leukemia virus 1 infection | 164/4205 | 222/8465 | 8.13e-14 | 2.09e-12 | 1.07e-12 | 164 |
| hsa0516614 | Liver | Cirrhotic | Human T-cell leukemia virus 1 infection | 87/2530 | 222/8465 | 1.69e-03 | 8.01e-03 | 4.94e-03 | 87 |
| hsa0516615 | Liver | Cirrhotic | Human T-cell leukemia virus 1 infection | 87/2530 | 222/8465 | 1.69e-03 | 8.01e-03 | 4.94e-03 | 87 |
| hsa0516622 | Liver | HCC | Human T-cell leukemia virus 1 infection | 139/4020 | 222/8465 | 3.17e-06 | 2.79e-05 | 1.55e-05 | 139 |
| hsa0516632 | Liver | HCC | Human T-cell leukemia virus 1 infection | 139/4020 | 222/8465 | 3.17e-06 | 2.79e-05 | 1.55e-05 | 139 |
| hsa0516616 | Lung | IAC | Human T-cell leukemia virus 1 infection | 49/1053 | 222/8465 | 3.44e-05 | 6.38e-04 | 4.24e-04 | 49 |
| hsa0516617 | Lung | IAC | Human T-cell leukemia virus 1 infection | 49/1053 | 222/8465 | 3.44e-05 | 6.38e-04 | 4.24e-04 | 49 |
| hsa0516623 | Lung | AIS | Human T-cell leukemia virus 1 infection | 45/961 | 222/8465 | 6.69e-05 | 9.43e-04 | 6.03e-04 | 45 |
| hsa0516633 | Lung | AIS | Human T-cell leukemia virus 1 infection | 45/961 | 222/8465 | 6.69e-05 | 9.43e-04 | 6.03e-04 | 45 |
| hsa0516661 | Lung | MIAC | Human T-cell leukemia virus 1 infection | 23/507 | 222/8465 | 7.02e-03 | 4.44e-02 | 3.21e-02 | 23 |
| hsa0516671 | Lung | MIAC | Human T-cell leukemia virus 1 infection | 23/507 | 222/8465 | 7.02e-03 | 4.44e-02 | 3.21e-02 | 23 |
| Page: 1 |
Top |
Cell-cell communication analysis |
| Identification of potential cell-cell interactions between two cell types and their ligand-receptor pairs for different disease states |
| Ligand | Receptor | LRpair | Pathway | Tissue | Disease Stage |
| Page: 1 |
Top |
Single-cell gene regulatory network inference analysis |
| Find out the significant the regulons (TFs) and the target genes of each regulon across cell types for different disease states |
| TF | Cell Type | Tissue | Disease Stage | Target Gene | RSS | Regulon Activity |
| ∗The dot plots of a searched regulon are shown for all cell subpopulations in each disease state of each tissue based on the regulon specific score inferred using pySCENIC and by calculating the average expression. |
| Page: 1 |
Top |
Somatic mutation of malignant transformation related genes |
| Annotation of somatic variants for genes involved in malignant transformation |
| Hugo Symbol | Variant Class | Variant Classification | dbSNP RS | HGVSc | HGVSp | HGVSp Short | SWISSPROT | BIOTYPE | SIFT | PolyPhen | Tumor Sample Barcode | Tissue | Histology | Sex | Age | Stage | Therapy Types | Drugs | Outcome |
| TRRAP | SNV | Missense_Mutation | novel | c.11069G>A | p.Arg3690Lys | p.R3690K | Q9Y4A5 | protein_coding | deleterious(0.05) | probably_damaging(0.927) | TCGA-3C-AALI-01 | Breast | breast invasive carcinoma | Female | <65 | I/II | Unspecific | Poly E | Complete Response |
| TRRAP | SNV | Missense_Mutation | c.3251C>T | p.Ser1084Leu | p.S1084L | Q9Y4A5 | protein_coding | tolerated(0.36) | benign(0.003) | TCGA-A2-A1FX-01 | Breast | breast invasive carcinoma | Female | <65 | III/IV | Chemotherapy | taxotere | SD | |
| TRRAP | SNV | Missense_Mutation | rs781788583 | c.3137N>C | p.Ile1046Thr | p.I1046T | Q9Y4A5 | protein_coding | deleterious(0) | benign(0.02) | TCGA-A8-A0A2-01 | Breast | breast invasive carcinoma | Female | >=65 | I/II | Hormone Therapy | tamoxiphen | SD |
| TRRAP | SNV | Missense_Mutation | c.7472N>T | p.Trp2491Leu | p.W2491L | Q9Y4A5 | protein_coding | deleterious(0) | probably_damaging(0.998) | TCGA-AC-A23H-01 | Breast | breast invasive carcinoma | Female | >=65 | I/II | Unknown | Unknown | PD | |
| TRRAP | SNV | Missense_Mutation | c.3647N>A | p.Arg1216Gln | p.R1216Q | Q9Y4A5 | protein_coding | tolerated(0.26) | benign(0.001) | TCGA-BH-A0C7-01 | Breast | breast invasive carcinoma | Female | <65 | I/II | Chemotherapy | adriamycin | CR | |
| TRRAP | SNV | Missense_Mutation | c.4435G>A | p.Val1479Met | p.V1479M | Q9Y4A5 | protein_coding | tolerated(0.06) | possibly_damaging(0.753) | TCGA-BH-A0HF-01 | Breast | breast invasive carcinoma | Female | >=65 | I/II | Hormone Therapy | arimidex | SD | |
| TRRAP | SNV | Missense_Mutation | c.10711N>A | p.Val3571Met | p.V3571M | Q9Y4A5 | protein_coding | deleterious(0) | probably_damaging(0.999) | TCGA-BH-A0W7-01 | Breast | breast invasive carcinoma | Female | <65 | I/II | Chemotherapy | taxotere | CR | |
| TRRAP | SNV | Missense_Mutation | c.3569N>A | p.Val1190Asp | p.V1190D | Q9Y4A5 | protein_coding | deleterious(0) | probably_damaging(0.98) | TCGA-C8-A12M-01 | Breast | breast invasive carcinoma | Female | >=65 | I/II | Unknown | Unknown | SD | |
| TRRAP | SNV | Missense_Mutation | c.3096N>T | p.Lys1032Asn | p.K1032N | Q9Y4A5 | protein_coding | tolerated(0.07) | benign(0.206) | TCGA-D8-A1XQ-01 | Breast | breast invasive carcinoma | Female | >=65 | I/II | Unknown | Unknown | SD | |
| TRRAP | SNV | Missense_Mutation | c.3742N>C | p.Glu1248Gln | p.E1248Q | Q9Y4A5 | protein_coding | tolerated(0.83) | benign(0.038) | TCGA-E2-A10C-01 | Breast | breast invasive carcinoma | Female | <65 | I/II | Chemotherapy | cytoxan | SD |
| Page: 1 2 3 4 5 6 7 8 9 10 11 12 13 14 15 16 17 18 19 20 21 22 23 24 25 26 27 28 29 30 31 32 33 34 35 36 37 38 39 40 41 42 43 44 45 |
Top |
Related drugs of malignant transformation related genes |
| Identification of chemicals and drugs interact with genes involved in malignant transfromation |
| (DGIdb 4.0) |
| Entrez ID | Symbol | Category | Interaction Types | Drug Claim Name | Drug Name | PMIDs |
| Page: 1 |

Copyright 2023-Present -The University of Texas Health Science Center at Houston |