
|
|||||
|
 | |
| |
| |
| |
| |
| |
|
Gene: TRPS1 |
Gene summary for TRPS1 |
| Gene information | Species | Human | Gene symbol | TRPS1 | Gene ID | 7227 |
| Gene name | transcriptional repressor GATA binding 1 | |
| Gene Alias | GC79 | |
| Cytomap | 8q23.3 | |
| Gene Type | protein-coding | GO ID | GO:0000122 | UniProtAcc | Q9UHF7 |
Top |
Malignant transformation analysis |
| Identification of the aberrant gene expression in precancerous and cancerous lesions by comparing the gene expression of stem-like cells in diseased tissues with normal stem cells |
| Entrez ID | Symbol | Replicates | Species | Organ | Tissue | Adj P-value | Log2FC | Malignancy |
| 7227 | TRPS1 | GSM4909281 | Human | Breast | IDC | 4.03e-56 | 9.51e-01 | 0.21 |
| 7227 | TRPS1 | GSM4909286 | Human | Breast | IDC | 1.22e-09 | 2.30e-01 | 0.1081 |
| 7227 | TRPS1 | GSM4909287 | Human | Breast | IDC | 5.16e-09 | 2.93e-01 | 0.2057 |
| 7227 | TRPS1 | GSM4909291 | Human | Breast | IDC | 6.84e-03 | -3.91e-01 | 0.1753 |
| 7227 | TRPS1 | GSM4909293 | Human | Breast | IDC | 5.84e-76 | 9.52e-01 | 0.1581 |
| 7227 | TRPS1 | GSM4909295 | Human | Breast | IDC | 3.41e-04 | 3.87e-01 | 0.0898 |
| 7227 | TRPS1 | GSM4909296 | Human | Breast | IDC | 8.43e-04 | -4.53e-02 | 0.1524 |
| 7227 | TRPS1 | GSM4909297 | Human | Breast | IDC | 1.00e-46 | 7.88e-01 | 0.1517 |
| 7227 | TRPS1 | GSM4909298 | Human | Breast | IDC | 1.11e-78 | 9.75e-01 | 0.1551 |
| 7227 | TRPS1 | GSM4909301 | Human | Breast | IDC | 4.69e-05 | 3.00e-01 | 0.1577 |
| 7227 | TRPS1 | GSM4909302 | Human | Breast | IDC | 6.19e-18 | 4.99e-01 | 0.1545 |
| 7227 | TRPS1 | GSM4909303 | Human | Breast | IDC | 1.86e-08 | 5.46e-01 | 0.0438 |
| 7227 | TRPS1 | GSM4909304 | Human | Breast | IDC | 1.04e-86 | 1.01e+00 | 0.1636 |
| 7227 | TRPS1 | GSM4909306 | Human | Breast | IDC | 1.73e-24 | 5.90e-01 | 0.1564 |
| 7227 | TRPS1 | GSM4909307 | Human | Breast | IDC | 1.31e-20 | 5.77e-01 | 0.1569 |
| 7227 | TRPS1 | GSM4909308 | Human | Breast | IDC | 3.20e-53 | 8.38e-01 | 0.158 |
| 7227 | TRPS1 | GSM4909311 | Human | Breast | IDC | 6.14e-26 | -8.68e-03 | 0.1534 |
| 7227 | TRPS1 | GSM4909312 | Human | Breast | IDC | 4.17e-18 | 3.37e-01 | 0.1552 |
| 7227 | TRPS1 | GSM4909313 | Human | Breast | IDC | 1.98e-03 | 2.06e-01 | 0.0391 |
| 7227 | TRPS1 | GSM4909317 | Human | Breast | IDC | 1.63e-06 | 3.60e-01 | 0.1355 |
| Page: 1 2 3 4 5 6 7 8 9 |
| Tissue | Expression Dynamics | Abbreviation |
| Breast | 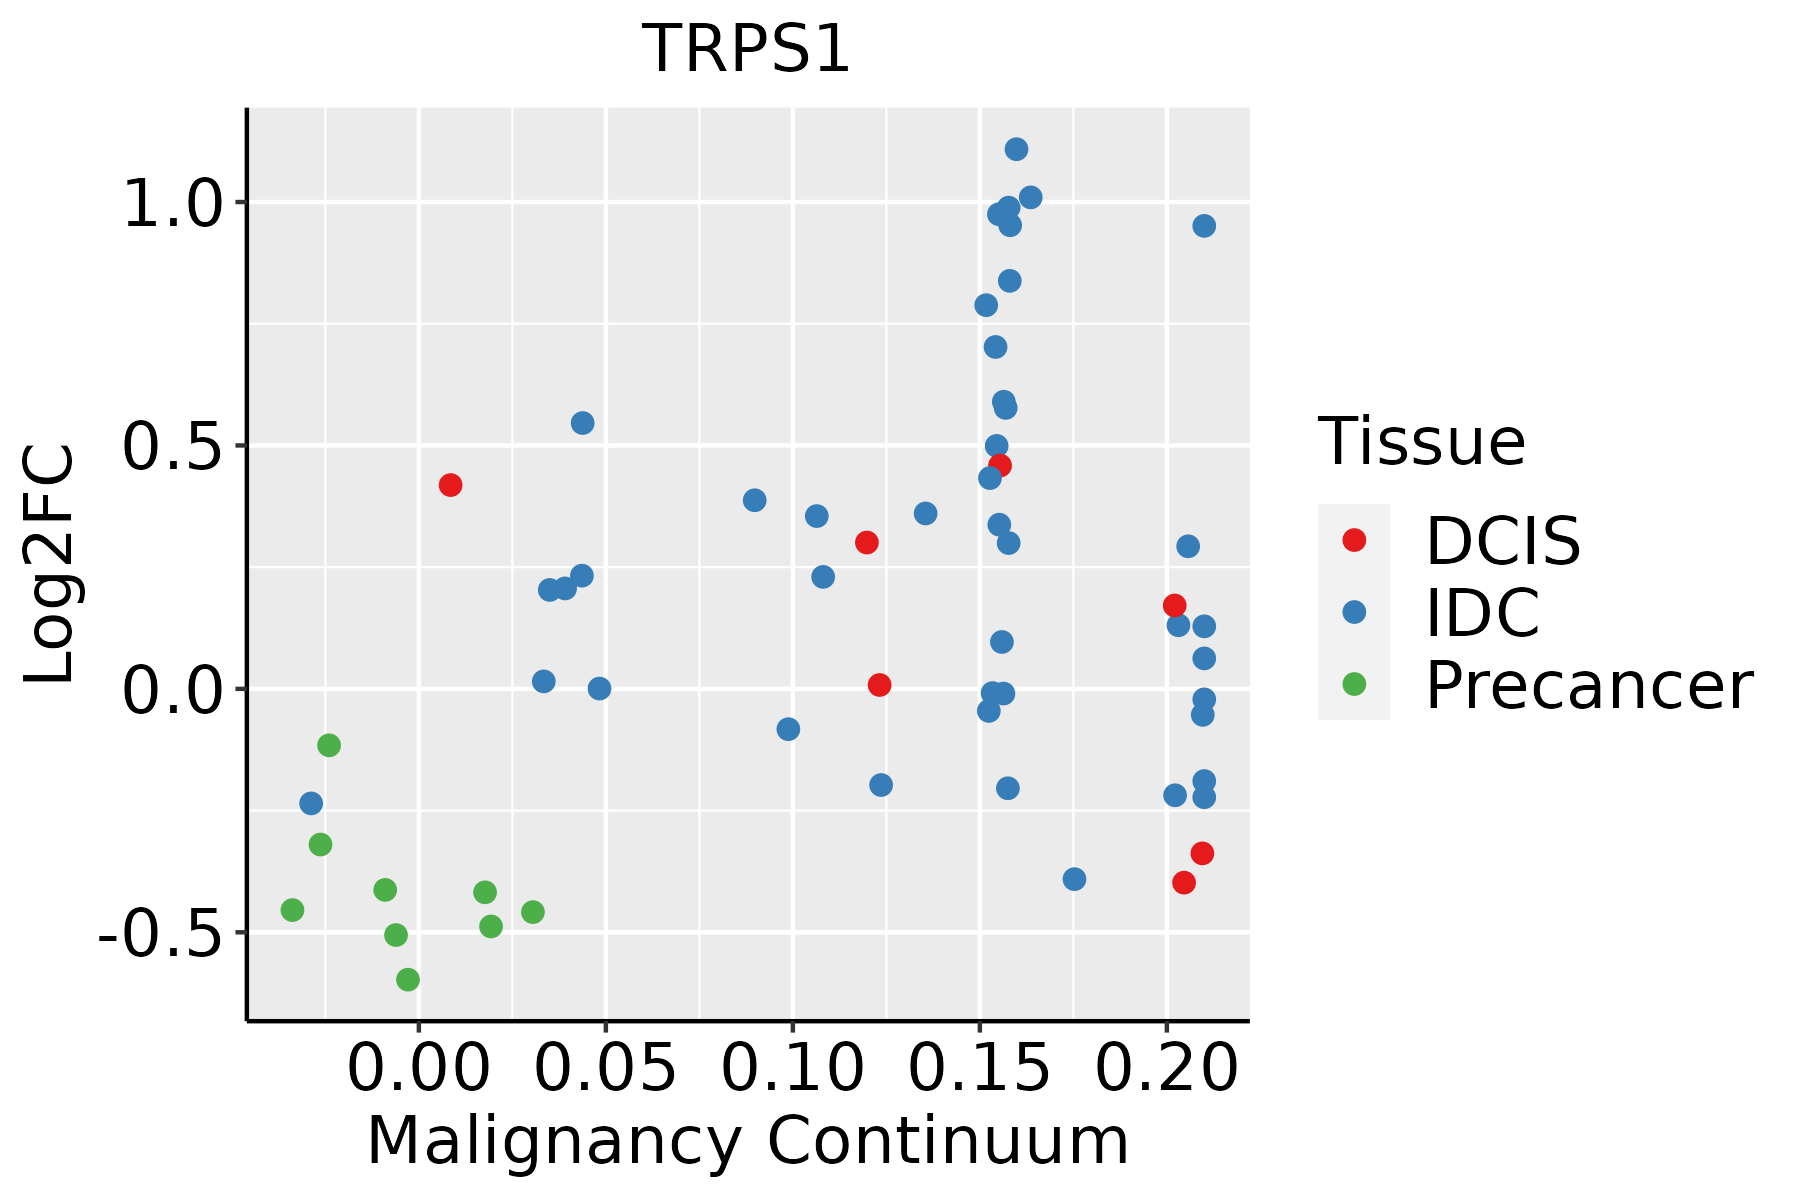 | IDC: Invasive ductal carcinoma |
| DCIS: Ductal carcinoma in situ | ||
| Precancer(BRCA1-mut): Precancerous lesion from BRCA1 mutation carriers | ||
| Cervix |  | CC: Cervix cancer |
| HSIL_HPV: HPV-infected high-grade squamous intraepithelial lesions | ||
| N_HPV: HPV-infected normal cervix | ||
| Endometrium |  | AEH: Atypical endometrial hyperplasia |
| EEC: Endometrioid Cancer | ||
| Esophagus |  | ESCC: Esophageal squamous cell carcinoma |
| HGIN: High-grade intraepithelial neoplasias | ||
| LGIN: Low-grade intraepithelial neoplasias | ||
| Liver | 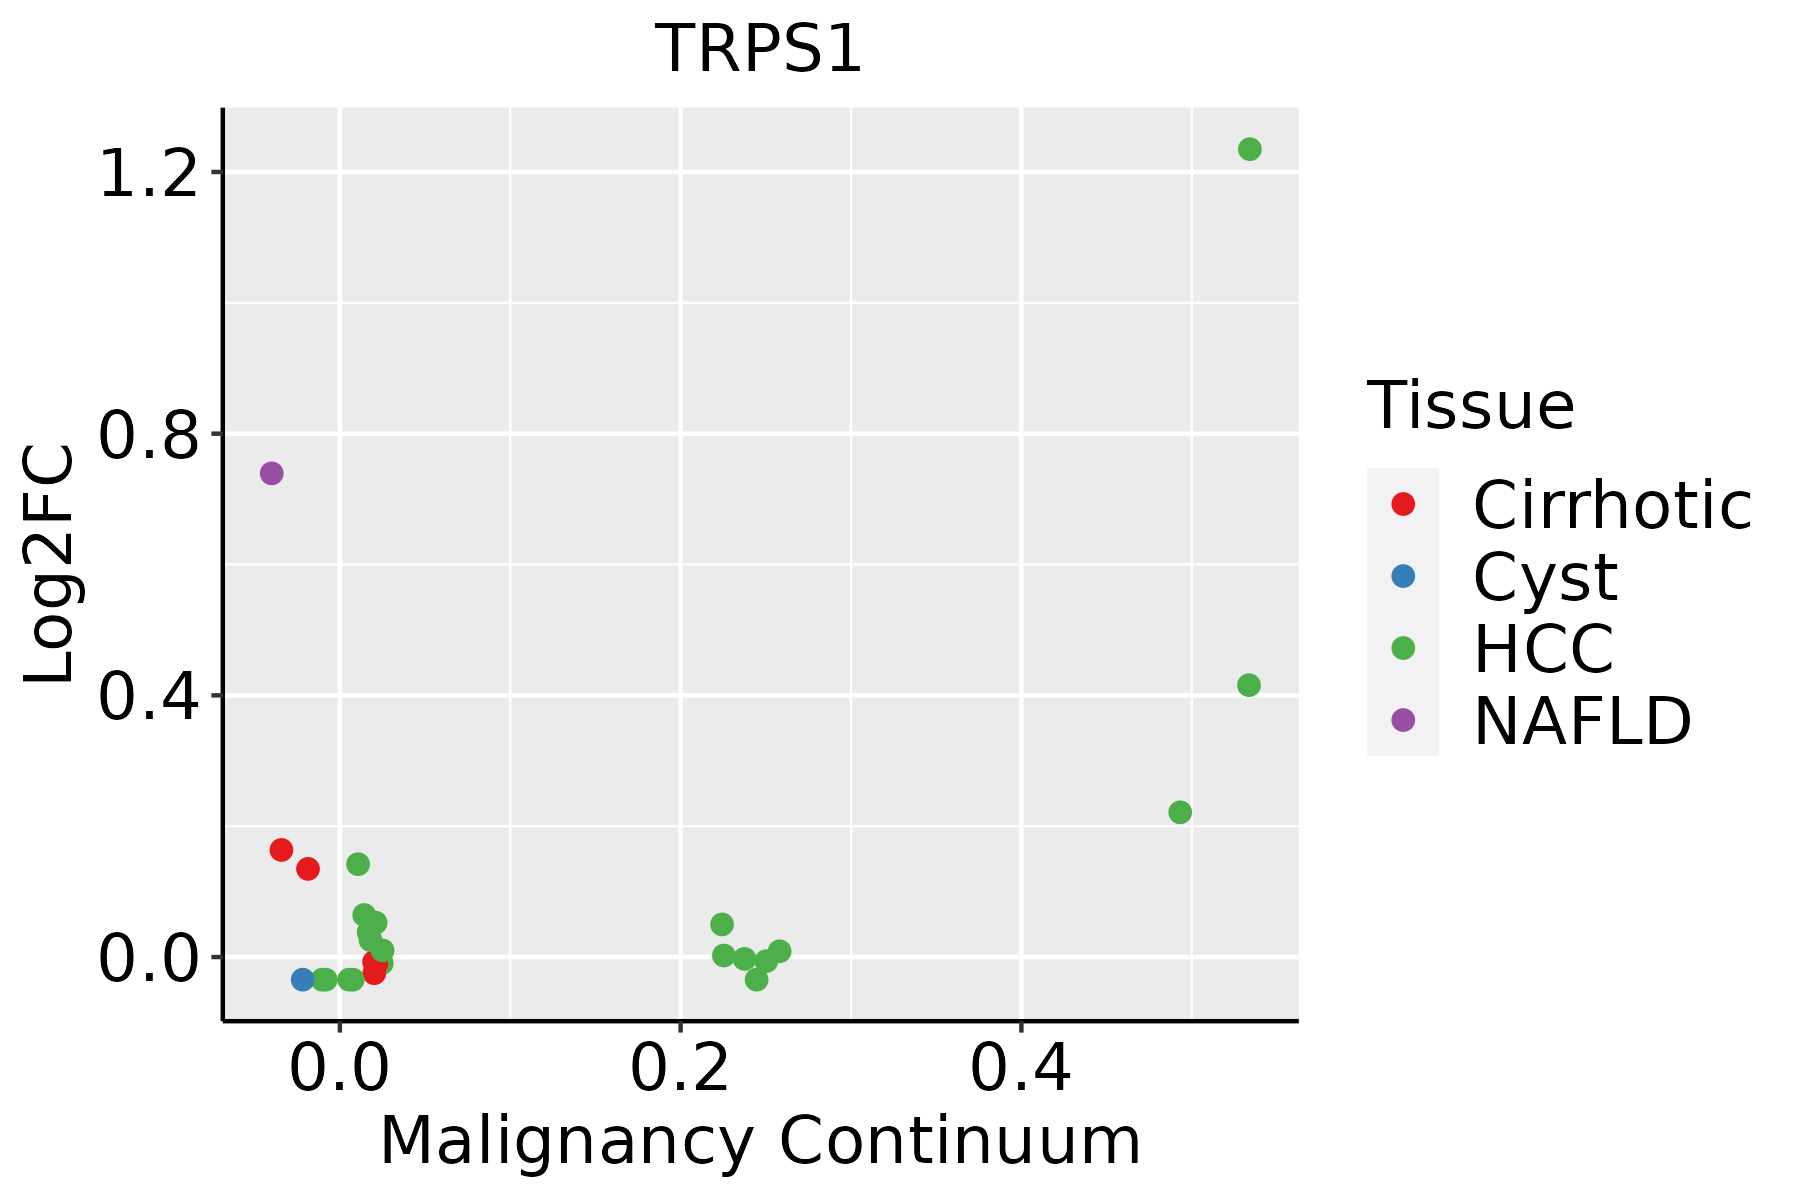 | HCC: Hepatocellular carcinoma |
| NAFLD: Non-alcoholic fatty liver disease | ||
| Lung |  | AAH: Atypical adenomatous hyperplasia |
| AIS: Adenocarcinoma in situ | ||
| IAC: Invasive lung adenocarcinoma | ||
| MIA: Minimally invasive adenocarcinoma | ||
| Prostate | 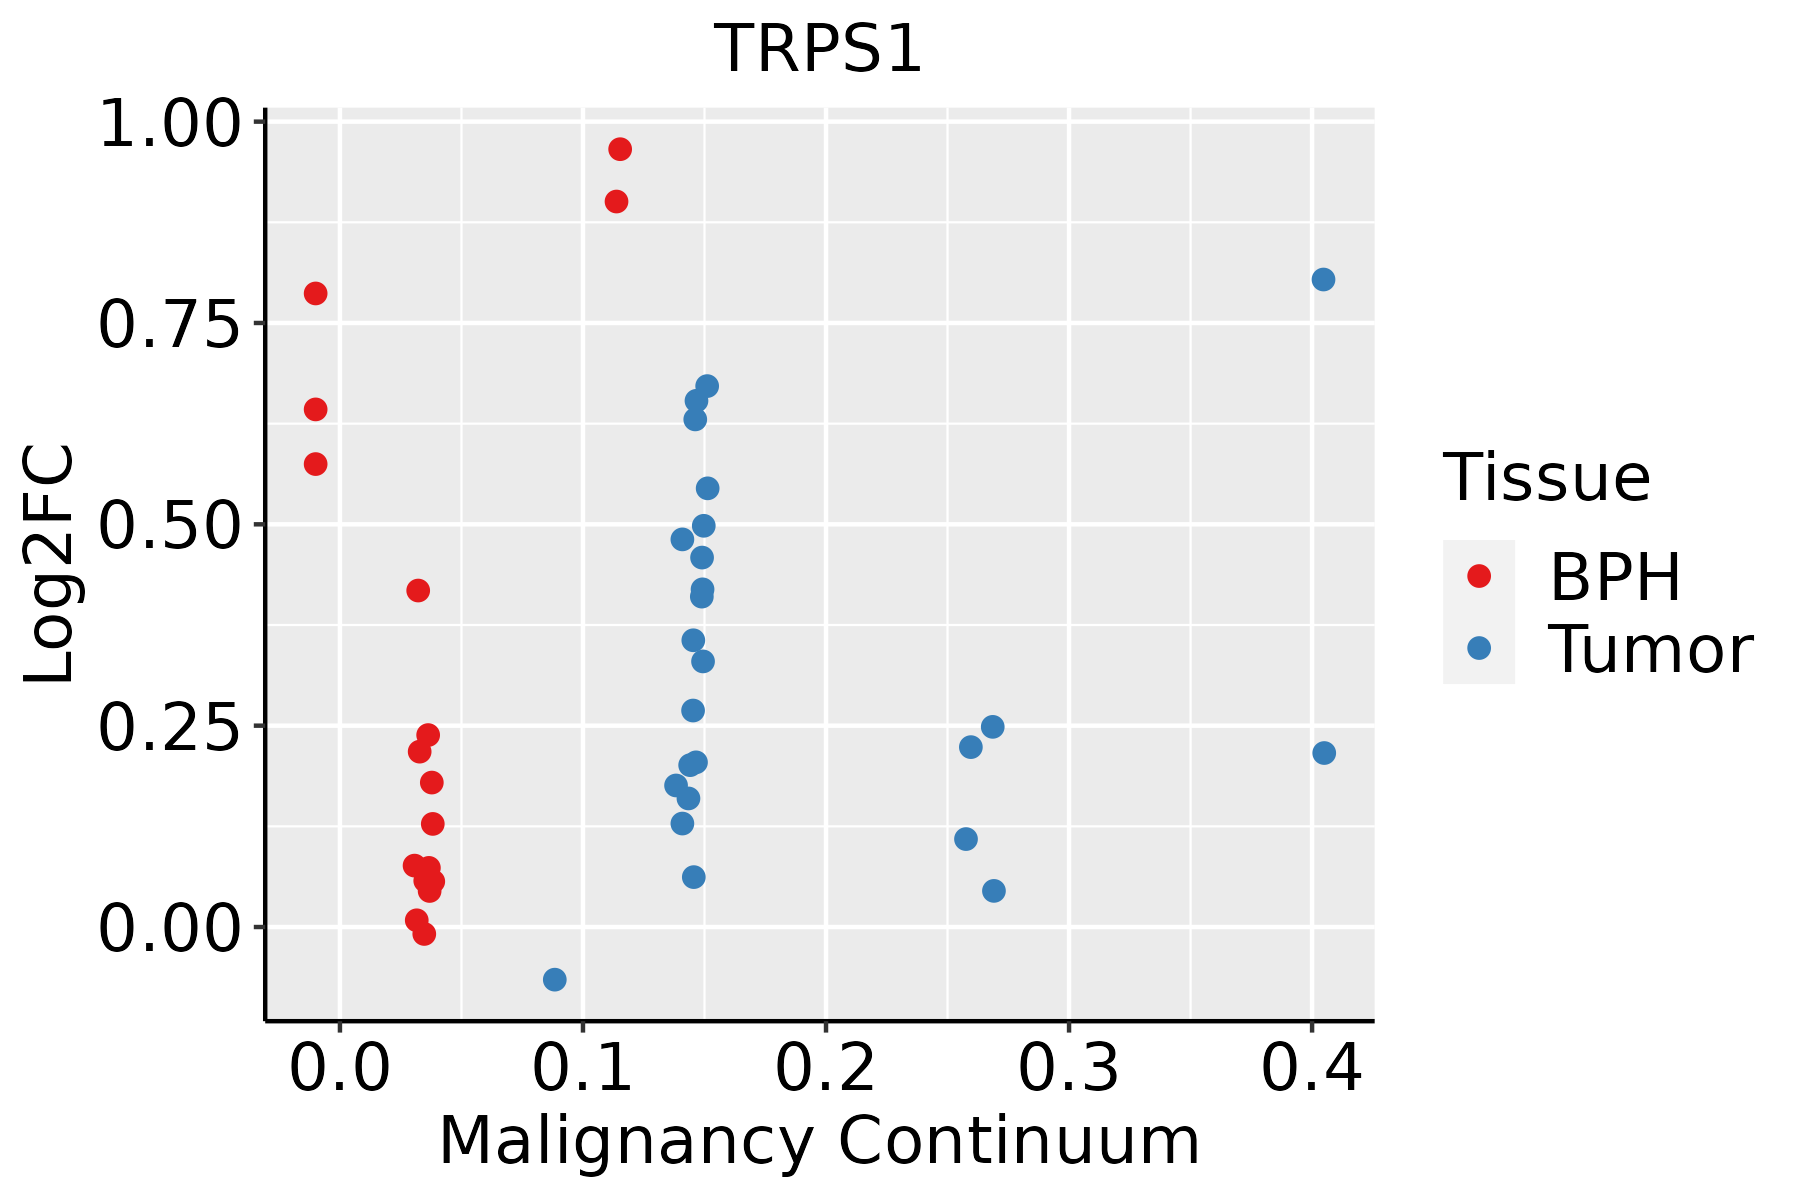 | BPH: Benign Prostatic Hyperplasia |
| Skin | 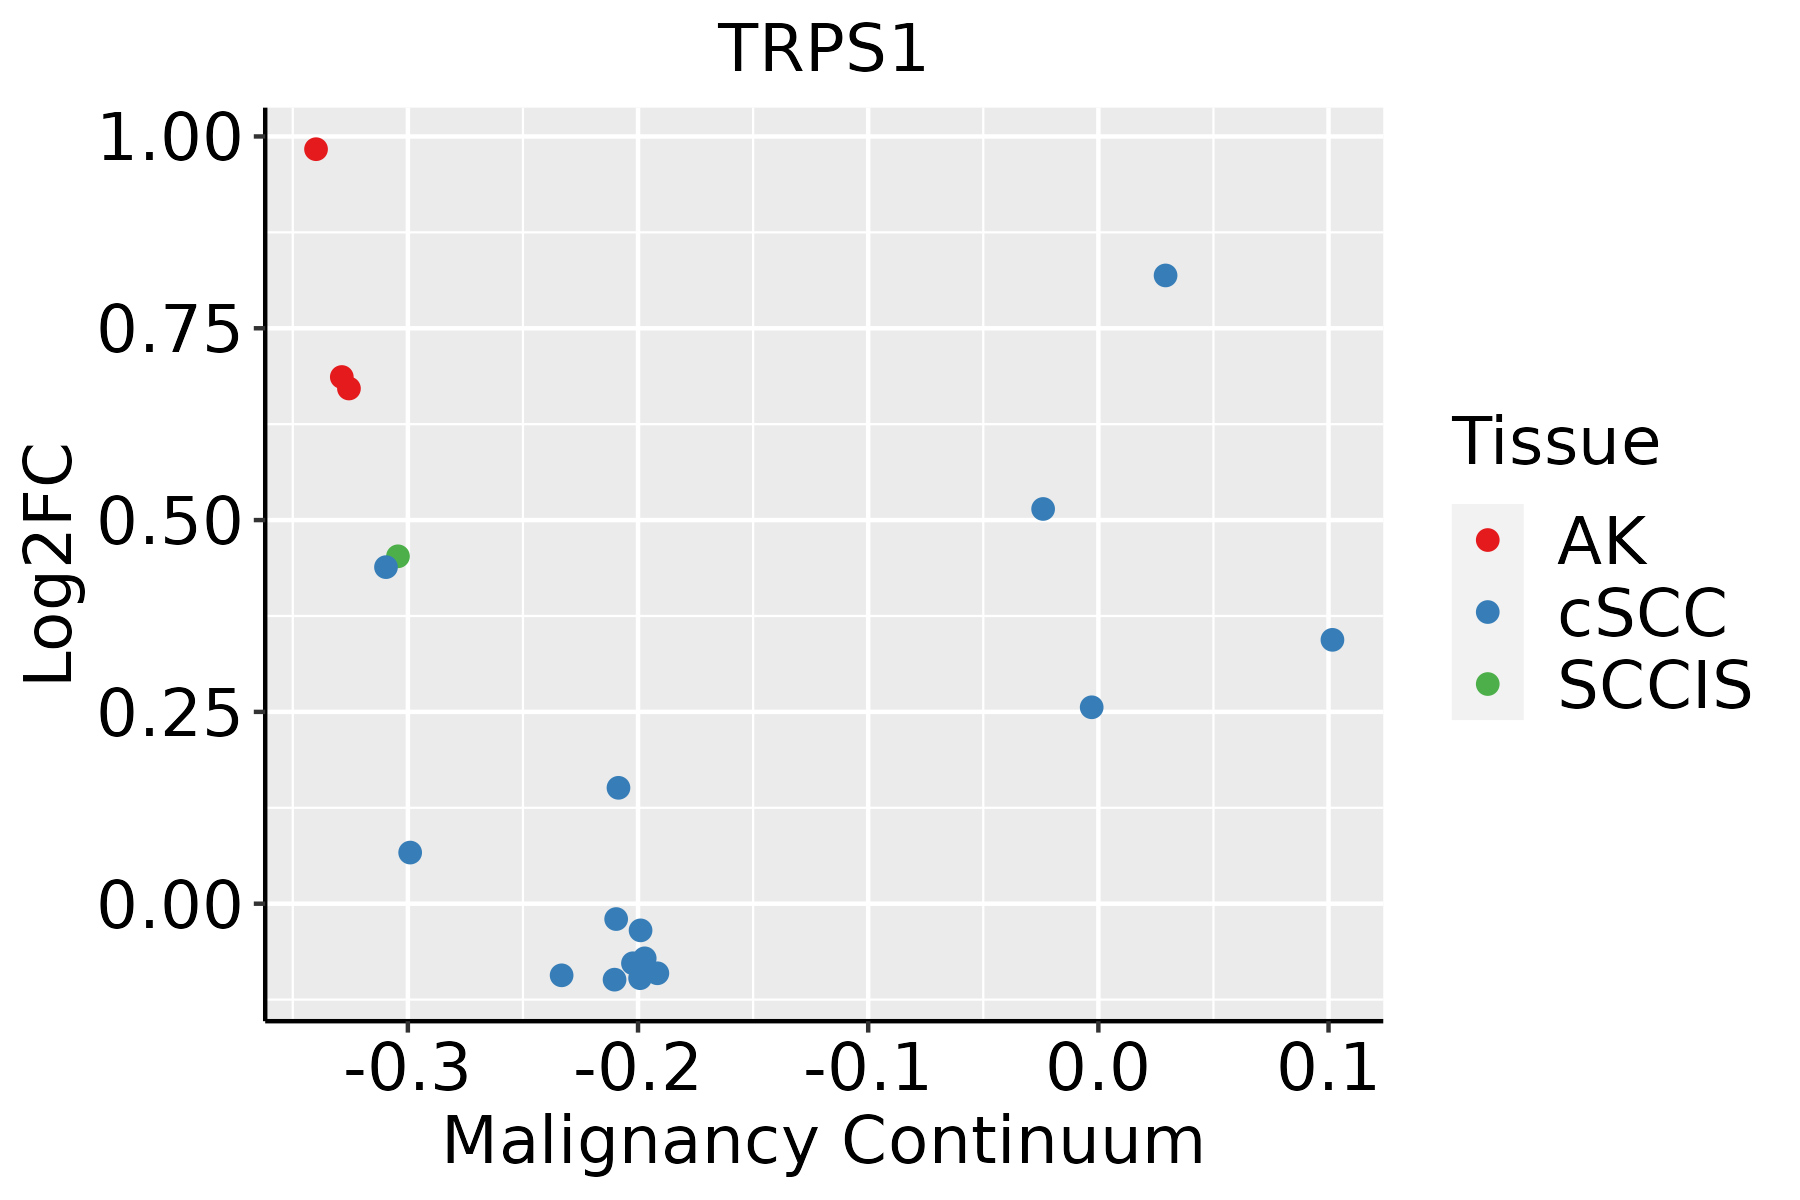 | AK: Actinic keratosis |
| cSCC: Cutaneous squamous cell carcinoma | ||
| SCCIS:squamous cell carcinoma in situ | ||
| Thyroid |  | ATC: Anaplastic thyroid cancer |
| HT: Hashimoto's thyroiditis | ||
| PTC: Papillary thyroid cancer |
| ∗log2FC in expression of this searched gene in stem-like cells from each diseased tissue sample relative to stem-like cells in normal samples in each tissue plotted against the malignancy continuum. Samples are colored based on if they are from different disease stage. |
Top |
Malignant transformation related pathway analysis |
| Find out the enriched GO biological processes and KEGG pathways involved in transition from healthy to precancer to cancer |
| Tissue | Disease Stage | Enriched GO biological Processes |
| Colorectum | AD |  |
| Colorectum | SER |  |
| Colorectum | MSS |  |
| Colorectum | MSI-H |  |
| Colorectum | FAP |  |
| ∗Top 15 enriched GO BP terms are showed in the bar plot of each disease state in each tissue. Each row represents a significant GO biological process which is colored according to the -log10(p.adjust). |
| Page: 1 2 3 4 5 6 7 8 9 |
| GO ID | Tissue | Disease Stage | Description | Gene Ratio | Bg Ratio | pvalue | p.adjust | Count |
| GO:0061448 | Endometrium | AEH | connective tissue development | 44/2100 | 252/18723 | 1.92e-03 | 1.51e-02 | 44 |
| GO:00614481 | Endometrium | EEC | connective tissue development | 44/2168 | 252/18723 | 3.51e-03 | 2.36e-02 | 44 |
| GO:00512161 | Esophagus | ESCC | cartilage development | 103/8552 | 190/18723 | 1.08e-02 | 3.67e-02 | 103 |
| GO:00020623 | Esophagus | ESCC | chondrocyte differentiation | 60/8552 | 106/18723 | 1.53e-02 | 4.94e-02 | 60 |
| GO:00614483 | Skin | AK | connective tissue development | 40/1910 | 252/18723 | 3.17e-03 | 1.95e-02 | 40 |
| GO:00512162 | Skin | AK | cartilage development | 31/1910 | 190/18723 | 5.79e-03 | 3.14e-02 | 31 |
| GO:005121611 | Skin | SCCIS | cartilage development | 18/919 | 190/18723 | 5.86e-03 | 4.52e-02 | 18 |
| GO:006144811 | Skin | SCCIS | connective tissue development | 22/919 | 252/18723 | 6.57e-03 | 4.89e-02 | 22 |
| GO:00020624 | Thyroid | ATC | chondrocyte differentiation | 54/6293 | 106/18723 | 1.67e-04 | 1.14e-03 | 54 |
| GO:00614484 | Thyroid | ATC | connective tissue development | 112/6293 | 252/18723 | 2.08e-04 | 1.38e-03 | 112 |
| GO:00512163 | Thyroid | ATC | cartilage development | 81/6293 | 190/18723 | 5.70e-03 | 2.30e-02 | 81 |
| Page: 1 |
| Pathway ID | Tissue | Disease Stage | Description | Gene Ratio | Bg Ratio | pvalue | p.adjust | qvalue | Count |
| Page: 1 |
Top |
Cell-cell communication analysis |
| Identification of potential cell-cell interactions between two cell types and their ligand-receptor pairs for different disease states |
| Ligand | Receptor | LRpair | Pathway | Tissue | Disease Stage |
| Page: 1 |
Top |
Single-cell gene regulatory network inference analysis |
| Find out the significant the regulons (TFs) and the target genes of each regulon across cell types for different disease states |
| TF | Cell Type | Tissue | Disease Stage | Target Gene | RSS | Regulon Activity |
| TRPS1 | FIB | Breast | ADJ | MT-CO3,GATA3,MT-CO2, etc. | 4.63e-02 |  |
| TRPS1 | FIB | Breast | Healthy | MT-CO3,GATA3,MT-CO2, etc. | 7.99e-02 |  |
| TRPS1 | FIB | Breast | Precancer | MT-CO3,GATA3,MT-CO2, etc. | 5.77e-02 |  |
| TRPS1 | CD8TEREX | Endometrium | AEH | NAB1,MERTK,PTPRJ, etc. | 1.19e-01 |  |
| TRPS1 | CD8TEREX | Endometrium | EEC | NAB1,MERTK,PTPRJ, etc. | 2.25e-01 |  |
| TRPS1 | CAF | Liver | HCC | MARCH1,TET3,LINC00278, etc. | 7.84e-02 |  |
| TRPS1 | CAF | Liver | Healthy | MARCH1,TET3,LINC00278, etc. | 5.40e-01 |  |
| TRPS1 | HSC | Liver | Healthy | MARCH1,TET3,LINC00278, etc. | 4.48e-03 | |
| TRPS1 | CAF | Liver | NAFLD | MARCH1,TET3,LINC00278, etc. | 6.83e-01 |  |
| TRPS1 | M2MAC | Lung | IAC | DPYD,PLXDC2,ARHGAP26, etc. | 1.19e-01 |  |
| ∗The dot plots of a searched regulon are shown for all cell subpopulations in each disease state of each tissue based on the regulon specific score inferred using pySCENIC and by calculating the average expression. |
| Page: 1 2 |
Top |
Somatic mutation of malignant transformation related genes |
| Annotation of somatic variants for genes involved in malignant transformation |
| Hugo Symbol | Variant Class | Variant Classification | dbSNP RS | HGVSc | HGVSp | HGVSp Short | SWISSPROT | BIOTYPE | SIFT | PolyPhen | Tumor Sample Barcode | Tissue | Histology | Sex | Age | Stage | Therapy Types | Drugs | Outcome |
| TRPS1 | SNV | Missense_Mutation | c.3052N>A | p.Glu1018Lys | p.E1018K | Q9UHF7 | protein_coding | deleterious(0.04) | benign(0.172) | TCGA-A2-A0EY-01 | Breast | breast invasive carcinoma | Female | <65 | I/II | Chemotherapy | adriamycin | SD | |
| TRPS1 | SNV | Missense_Mutation | c.3226G>C | p.Glu1076Gln | p.E1076Q | Q9UHF7 | protein_coding | deleterious_low_confidence(0) | probably_damaging(0.997) | TCGA-A8-A06Q-01 | Breast | breast invasive carcinoma | Female | <65 | III/IV | Unknown | Unknown | SD | |
| TRPS1 | SNV | Missense_Mutation | c.1918N>A | p.Asp640Asn | p.D640N | Q9UHF7 | protein_coding | deleterious_low_confidence(0) | probably_damaging(0.998) | TCGA-A8-A08F-01 | Breast | breast invasive carcinoma | Female | <65 | III/IV | Chemotherapy | 5-fluorouracil | CR | |
| TRPS1 | SNV | Missense_Mutation | c.2684N>A | p.Ser895Tyr | p.S895Y | Q9UHF7 | protein_coding | deleterious_low_confidence(0) | probably_damaging(0.98) | TCGA-A8-A090-01 | Breast | breast invasive carcinoma | Female | >=65 | I/II | Unknown | Unknown | SD | |
| TRPS1 | SNV | Missense_Mutation | rs200964070 | c.310N>T | p.Pro104Ser | p.P104S | Q9UHF7 | protein_coding | tolerated_low_confidence(0.16) | benign(0.022) | TCGA-A8-A09Q-01 | Breast | breast invasive carcinoma | Female | >=65 | III/IV | Hormone Therapy | anastrozole | SD |
| TRPS1 | SNV | Missense_Mutation | c.3181N>T | p.Asp1061Tyr | p.D1061Y | Q9UHF7 | protein_coding | deleterious_low_confidence(0) | possibly_damaging(0.858) | TCGA-AN-A046-01 | Breast | breast invasive carcinoma | Female | >=65 | I/II | Unknown | Unknown | SD | |
| TRPS1 | SNV | Missense_Mutation | rs769392409 | c.1631N>A | p.Arg544Gln | p.R544Q | Q9UHF7 | protein_coding | deleterious_low_confidence(0) | probably_damaging(0.995) | TCGA-AR-A24K-01 | Breast | breast invasive carcinoma | Female | <65 | I/II | Unspecific | Paclitaxel | SD |
| TRPS1 | SNV | Missense_Mutation | c.2779G>C | p.Gly927Arg | p.G927R | Q9UHF7 | protein_coding | deleterious(0) | probably_damaging(1) | TCGA-BH-A0BW-01 | Breast | breast invasive carcinoma | Female | >=65 | I/II | Chemotherapy | adriamycin | CR | |
| TRPS1 | SNV | Missense_Mutation | novel | c.2638C>A | p.Pro880Thr | p.P880T | Q9UHF7 | protein_coding | tolerated_low_confidence(1) | benign(0) | TCGA-D8-A1XW-01 | Breast | breast invasive carcinoma | Female | <65 | I/II | Chemotherapy | adriamycin+cyclophosphamide | SD |
| TRPS1 | SNV | Missense_Mutation | c.3841N>G | p.Arg1281Gly | p.R1281G | Q9UHF7 | protein_coding | deleterious_low_confidence(0) | probably_damaging(0.996) | TCGA-E2-A15D-01 | Breast | breast invasive carcinoma | Female | <65 | I/II | Hormone Therapy | tamoxiphen | SD |
| Page: 1 2 3 4 5 6 7 8 9 10 11 12 13 14 15 16 17 18 19 20 21 22 23 24 25 26 27 28 29 30 31 32 |
Top |
Related drugs of malignant transformation related genes |
| Identification of chemicals and drugs interact with genes involved in malignant transfromation |
| (DGIdb 4.0) |
| Entrez ID | Symbol | Category | Interaction Types | Drug Claim Name | Drug Name | PMIDs |
| Page: 1 |

Copyright 2023-Present -The University of Texas Health Science Center at Houston |