
|
|||||
|
 | |
| |
| |
| |
| |
| |
|
Gene: TRPM7 |
Gene summary for TRPM7 |
| Gene information | Species | Human | Gene symbol | TRPM7 | Gene ID | 54822 |
| Gene name | transient receptor potential cation channel subfamily M member 7 | |
| Gene Alias | ALSPDC | |
| Cytomap | 15q21.2 | |
| Gene Type | protein-coding | GO ID | GO:0006464 | UniProtAcc | H0YLN8 |
Top |
Malignant transformation analysis |
| Identification of the aberrant gene expression in precancerous and cancerous lesions by comparing the gene expression of stem-like cells in diseased tissues with normal stem cells |
| Entrez ID | Symbol | Replicates | Species | Organ | Tissue | Adj P-value | Log2FC | Malignancy |
| 54822 | TRPM7 | CCI_2 | Human | Cervix | CC | 7.57e-12 | 1.11e+00 | 0.5249 |
| 54822 | TRPM7 | CCI_3 | Human | Cervix | CC | 1.98e-07 | 6.13e-01 | 0.516 |
| 54822 | TRPM7 | HTA11_3410_2000001011 | Human | Colorectum | AD | 1.79e-14 | -5.02e-01 | 0.0155 |
| 54822 | TRPM7 | HTA11_10711_2000001011 | Human | Colorectum | AD | 8.96e-04 | -4.17e-01 | 0.0338 |
| 54822 | TRPM7 | HTA11_6818_2000001021 | Human | Colorectum | AD | 1.98e-02 | -4.86e-01 | 0.0588 |
| 54822 | TRPM7 | HTA11_99999970781_79442 | Human | Colorectum | MSS | 4.75e-09 | -3.72e-01 | 0.294 |
| 54822 | TRPM7 | HTA11_99999971662_82457 | Human | Colorectum | MSS | 8.10e-12 | -4.42e-01 | 0.3859 |
| 54822 | TRPM7 | HTA11_99999974143_84620 | Human | Colorectum | MSS | 2.84e-21 | -4.96e-01 | 0.3005 |
| 54822 | TRPM7 | A015-C-203 | Human | Colorectum | FAP | 9.00e-32 | -2.59e-01 | -0.1294 |
| 54822 | TRPM7 | A015-C-204 | Human | Colorectum | FAP | 2.31e-06 | -3.02e-01 | -0.0228 |
| 54822 | TRPM7 | A014-C-040 | Human | Colorectum | FAP | 1.58e-04 | -3.44e-01 | -0.1184 |
| 54822 | TRPM7 | A002-C-201 | Human | Colorectum | FAP | 1.28e-10 | -2.40e-01 | 0.0324 |
| 54822 | TRPM7 | A002-C-203 | Human | Colorectum | FAP | 6.94e-06 | -1.42e-01 | 0.2786 |
| 54822 | TRPM7 | A001-C-119 | Human | Colorectum | FAP | 1.11e-05 | -3.30e-01 | -0.1557 |
| 54822 | TRPM7 | A001-C-108 | Human | Colorectum | FAP | 1.04e-17 | -9.60e-02 | -0.0272 |
| 54822 | TRPM7 | A002-C-205 | Human | Colorectum | FAP | 3.40e-21 | -1.23e-01 | -0.1236 |
| 54822 | TRPM7 | A001-C-104 | Human | Colorectum | FAP | 1.99e-03 | 3.65e-02 | 0.0184 |
| 54822 | TRPM7 | A015-C-005 | Human | Colorectum | FAP | 6.88e-04 | -2.79e-01 | -0.0336 |
| 54822 | TRPM7 | A015-C-006 | Human | Colorectum | FAP | 3.63e-13 | -3.22e-01 | -0.0994 |
| 54822 | TRPM7 | A015-C-106 | Human | Colorectum | FAP | 1.00e-09 | -1.59e-01 | -0.0511 |
| Page: 1 2 3 4 5 6 7 8 9 |
| Tissue | Expression Dynamics | Abbreviation |
| Cervix |  | CC: Cervix cancer |
| HSIL_HPV: HPV-infected high-grade squamous intraepithelial lesions | ||
| N_HPV: HPV-infected normal cervix | ||
| Colorectum (GSE201348) |  | FAP: Familial adenomatous polyposis |
| CRC: Colorectal cancer | ||
| Colorectum (HTA11) |  | AD: Adenomas |
| SER: Sessile serrated lesions | ||
| MSI-H: Microsatellite-high colorectal cancer | ||
| MSS: Microsatellite stable colorectal cancer | ||
| Endometrium | 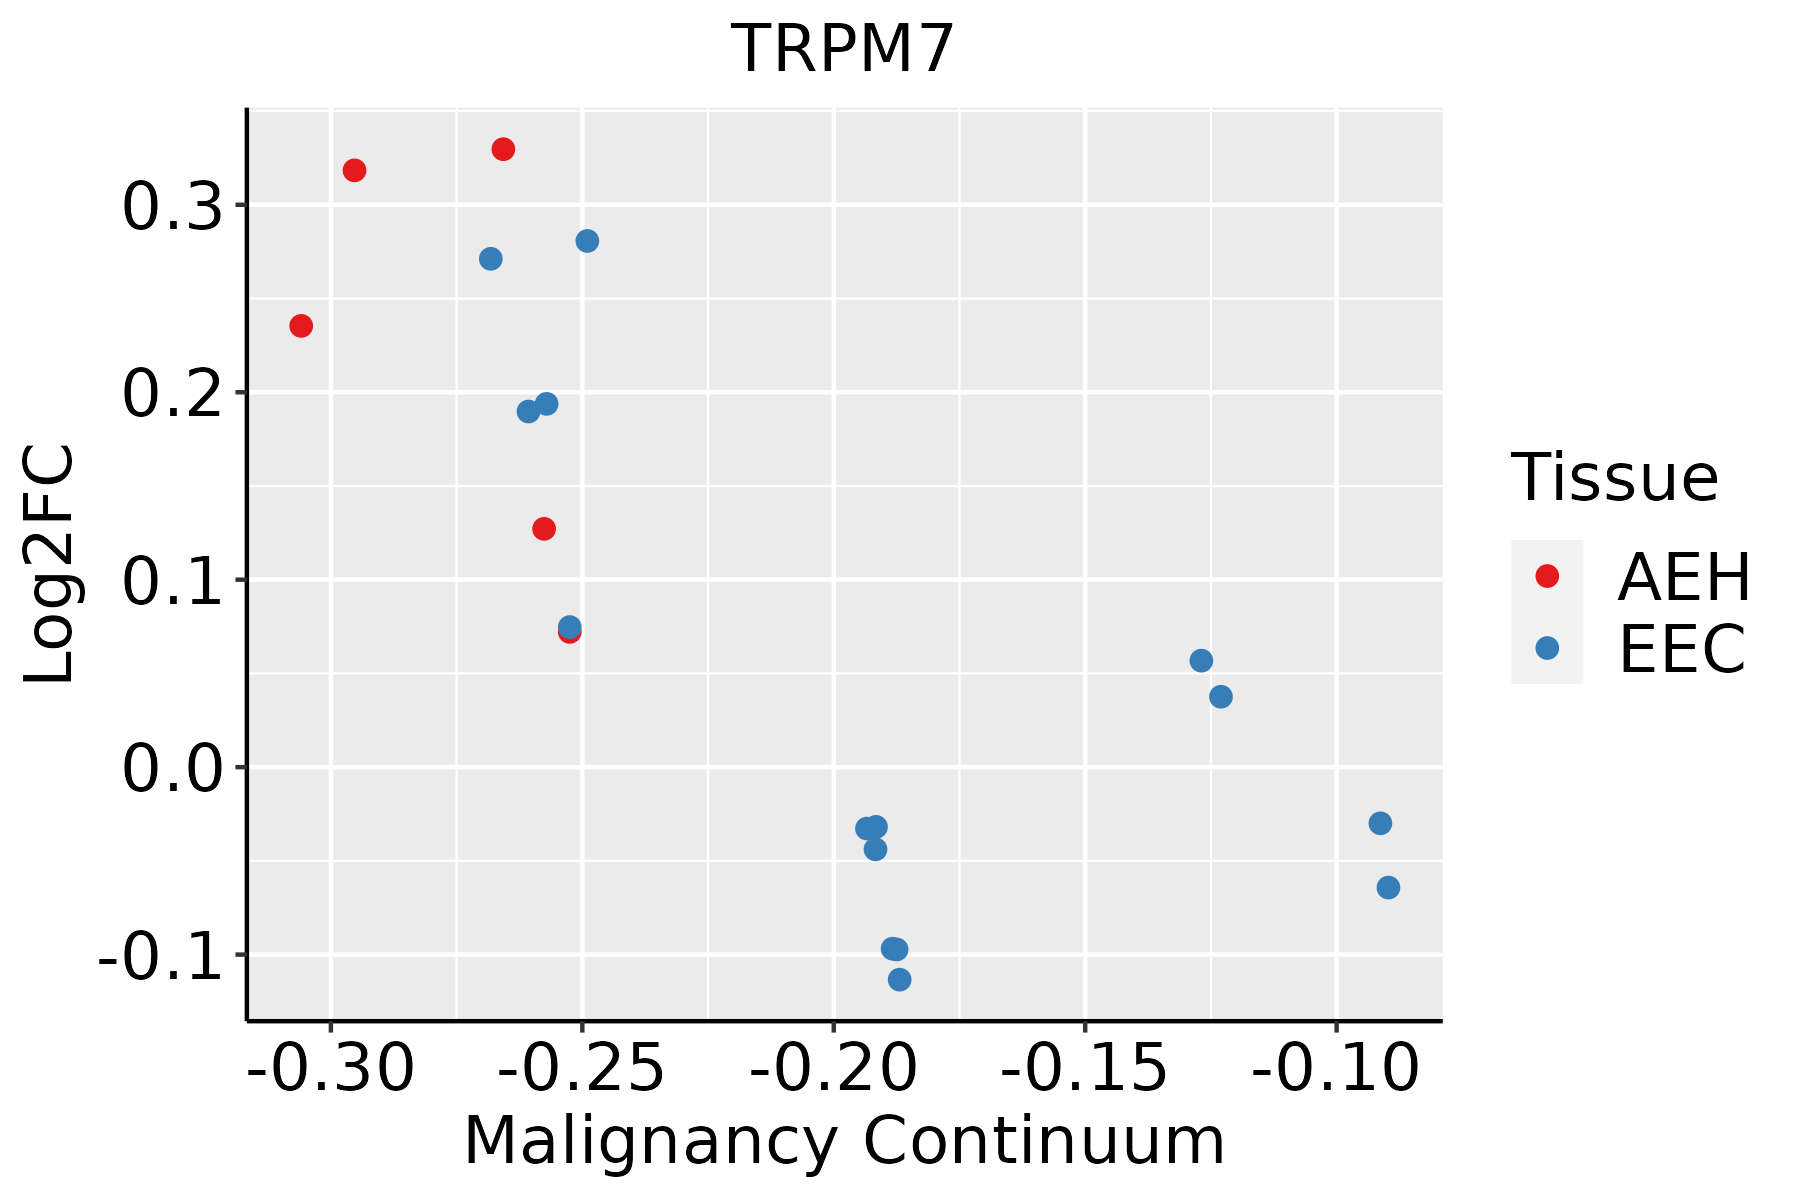 | AEH: Atypical endometrial hyperplasia |
| EEC: Endometrioid Cancer | ||
| Esophagus |  | ESCC: Esophageal squamous cell carcinoma |
| HGIN: High-grade intraepithelial neoplasias | ||
| LGIN: Low-grade intraepithelial neoplasias | ||
| Liver | 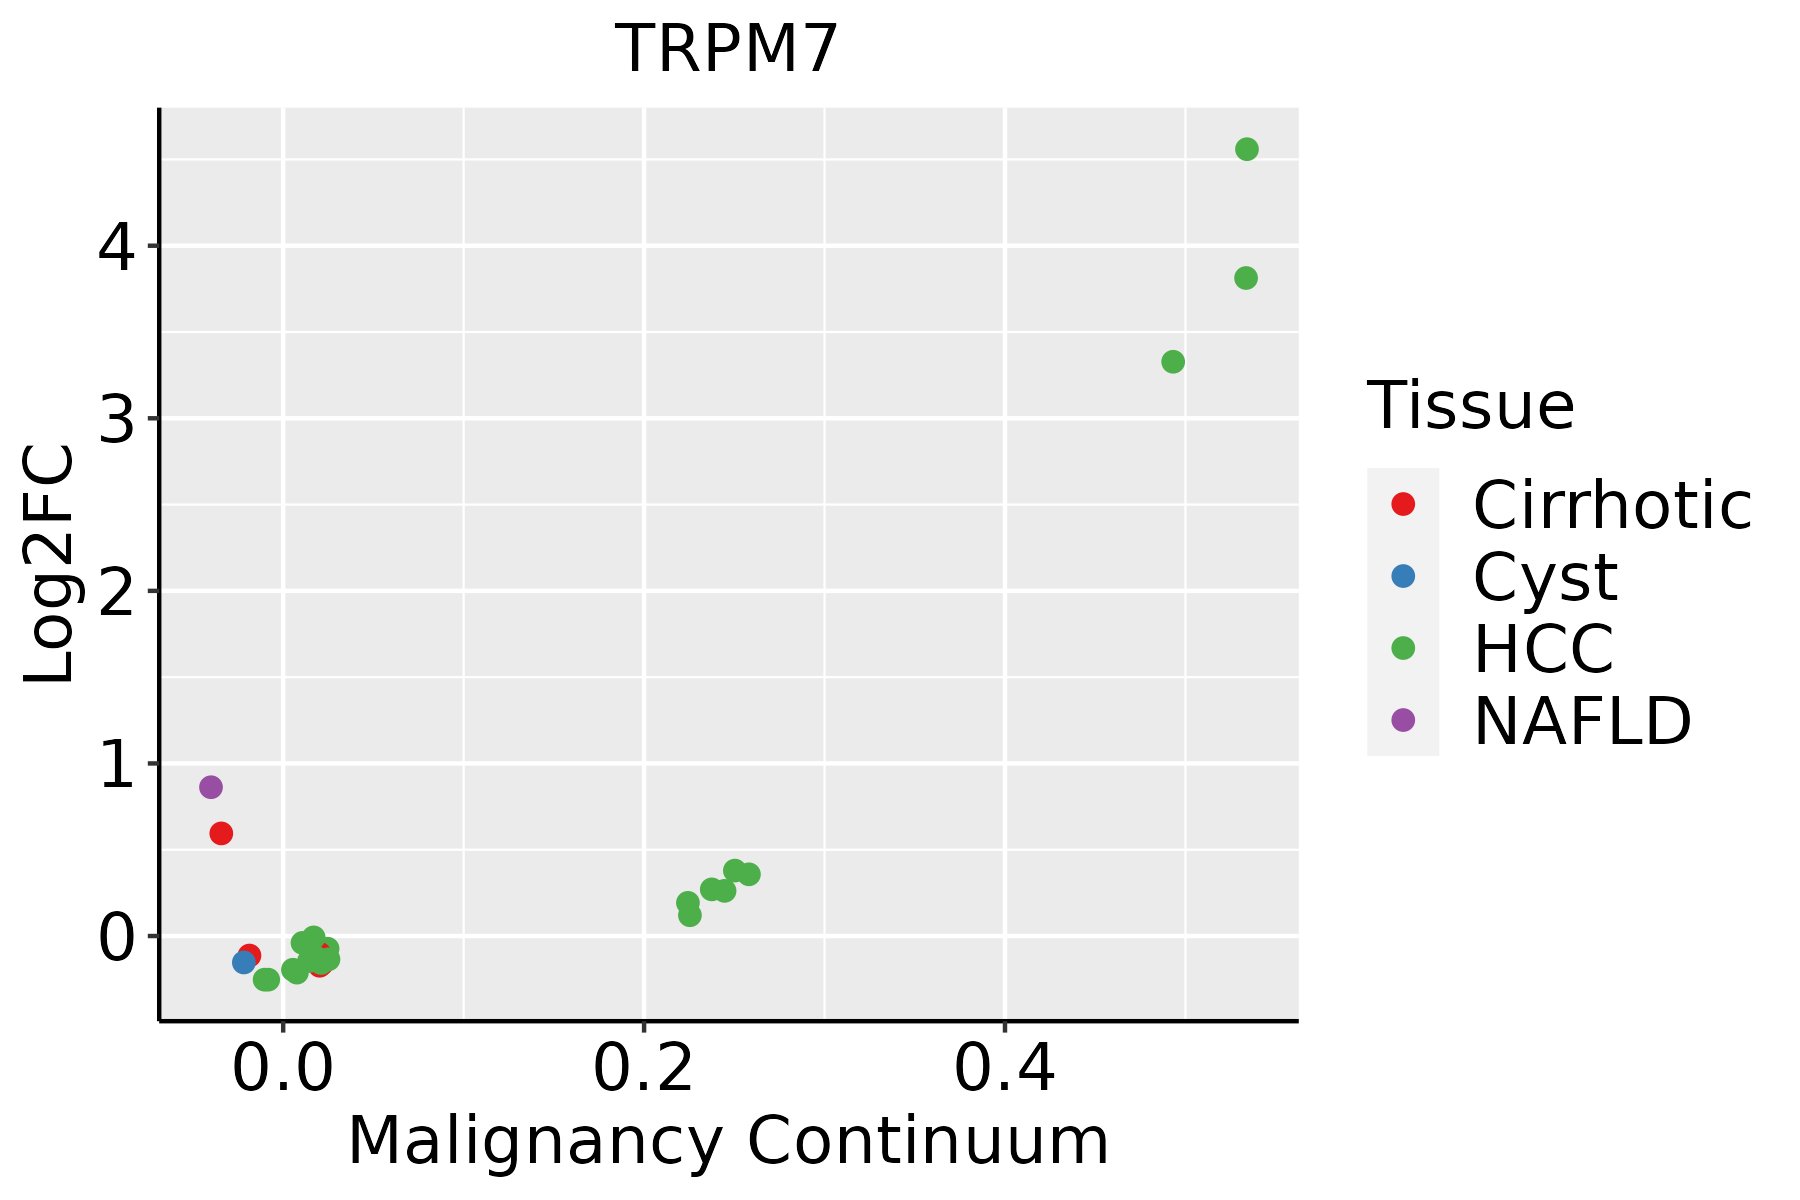 | HCC: Hepatocellular carcinoma |
| NAFLD: Non-alcoholic fatty liver disease | ||
| Lung |  | AAH: Atypical adenomatous hyperplasia |
| AIS: Adenocarcinoma in situ | ||
| IAC: Invasive lung adenocarcinoma | ||
| MIA: Minimally invasive adenocarcinoma | ||
| Prostate |  | BPH: Benign Prostatic Hyperplasia |
| Skin |  | AK: Actinic keratosis |
| cSCC: Cutaneous squamous cell carcinoma | ||
| SCCIS:squamous cell carcinoma in situ | ||
| Thyroid |  | ATC: Anaplastic thyroid cancer |
| HT: Hashimoto's thyroiditis | ||
| PTC: Papillary thyroid cancer |
| ∗log2FC in expression of this searched gene in stem-like cells from each diseased tissue sample relative to stem-like cells in normal samples in each tissue plotted against the malignancy continuum. Samples are colored based on if they are from different disease stage. |
Top |
Malignant transformation related pathway analysis |
| Find out the enriched GO biological processes and KEGG pathways involved in transition from healthy to precancer to cancer |
| Tissue | Disease Stage | Enriched GO biological Processes |
| Colorectum | AD |  |
| Colorectum | SER |  |
| Colorectum | MSS |  |
| Colorectum | MSI-H |  |
| Colorectum | FAP |  |
| ∗Top 15 enriched GO BP terms are showed in the bar plot of each disease state in each tissue. Each row represents a significant GO biological process which is colored according to the -log10(p.adjust). |
| Page: 1 2 3 4 5 6 7 8 9 |
| GO ID | Tissue | Disease Stage | Description | Gene Ratio | Bg Ratio | pvalue | p.adjust | Count |
| GO:00315898 | Cervix | CC | cell-substrate adhesion | 96/2311 | 363/18723 | 1.48e-13 | 8.85e-11 | 96 |
| GO:00071608 | Cervix | CC | cell-matrix adhesion | 60/2311 | 233/18723 | 1.58e-08 | 1.23e-06 | 60 |
| GO:00310329 | Cervix | CC | actomyosin structure organization | 43/2311 | 196/18723 | 1.11e-04 | 1.40e-03 | 43 |
| GO:0031589 | Colorectum | AD | cell-substrate adhesion | 116/3918 | 363/18723 | 4.68e-07 | 1.76e-05 | 116 |
| GO:0046777 | Colorectum | AD | protein autophosphorylation | 74/3918 | 227/18723 | 2.48e-05 | 4.76e-04 | 74 |
| GO:0007160 | Colorectum | AD | cell-matrix adhesion | 75/3918 | 233/18723 | 3.56e-05 | 6.45e-04 | 75 |
| GO:0031032 | Colorectum | AD | actomyosin structure organization | 65/3918 | 196/18723 | 4.17e-05 | 7.37e-04 | 65 |
| GO:00315892 | Colorectum | MSS | cell-substrate adhesion | 104/3467 | 363/18723 | 1.35e-06 | 4.51e-05 | 104 |
| GO:00071602 | Colorectum | MSS | cell-matrix adhesion | 65/3467 | 233/18723 | 2.77e-04 | 3.67e-03 | 65 |
| GO:00467772 | Colorectum | MSS | protein autophosphorylation | 63/3467 | 227/18723 | 3.96e-04 | 4.91e-03 | 63 |
| GO:00310322 | Colorectum | MSS | actomyosin structure organization | 53/3467 | 196/18723 | 2.04e-03 | 1.75e-02 | 53 |
| GO:00315893 | Colorectum | FAP | cell-substrate adhesion | 93/2622 | 363/18723 | 2.48e-09 | 4.61e-07 | 93 |
| GO:00071603 | Colorectum | FAP | cell-matrix adhesion | 63/2622 | 233/18723 | 1.13e-07 | 7.43e-06 | 63 |
| GO:00310323 | Colorectum | FAP | actomyosin structure organization | 51/2622 | 196/18723 | 5.89e-06 | 1.88e-04 | 51 |
| GO:00467773 | Colorectum | FAP | protein autophosphorylation | 52/2622 | 227/18723 | 1.88e-04 | 2.76e-03 | 52 |
| GO:00315894 | Colorectum | CRC | cell-substrate adhesion | 78/2078 | 363/18723 | 6.22e-09 | 1.49e-06 | 78 |
| GO:00310324 | Colorectum | CRC | actomyosin structure organization | 45/2078 | 196/18723 | 1.49e-06 | 8.14e-05 | 45 |
| GO:00071604 | Colorectum | CRC | cell-matrix adhesion | 50/2078 | 233/18723 | 3.28e-06 | 1.47e-04 | 50 |
| GO:00467774 | Colorectum | CRC | protein autophosphorylation | 42/2078 | 227/18723 | 6.08e-04 | 8.10e-03 | 42 |
| GO:00315899 | Endometrium | AEH | cell-substrate adhesion | 87/2100 | 363/18723 | 3.51e-12 | 5.70e-10 | 87 |
| Page: 1 2 3 4 5 |
| Pathway ID | Tissue | Disease Stage | Description | Gene Ratio | Bg Ratio | pvalue | p.adjust | qvalue | Count |
| hsa0421810 | Cervix | CC | Cellular senescence | 49/1267 | 156/8465 | 1.30e-07 | 1.63e-06 | 9.61e-07 | 49 |
| hsa046213 | Cervix | CC | NOD-like receptor signaling pathway | 41/1267 | 186/8465 | 5.90e-03 | 1.95e-02 | 1.15e-02 | 41 |
| hsa0421815 | Cervix | CC | Cellular senescence | 49/1267 | 156/8465 | 1.30e-07 | 1.63e-06 | 9.61e-07 | 49 |
| hsa0462112 | Cervix | CC | NOD-like receptor signaling pathway | 41/1267 | 186/8465 | 5.90e-03 | 1.95e-02 | 1.15e-02 | 41 |
| hsa04218 | Colorectum | AD | Cellular senescence | 53/2092 | 156/8465 | 5.55e-03 | 2.48e-02 | 1.58e-02 | 53 |
| hsa042181 | Colorectum | AD | Cellular senescence | 53/2092 | 156/8465 | 5.55e-03 | 2.48e-02 | 1.58e-02 | 53 |
| hsa042182 | Colorectum | MSS | Cellular senescence | 52/1875 | 156/8465 | 7.87e-04 | 5.07e-03 | 3.11e-03 | 52 |
| hsa042183 | Colorectum | MSS | Cellular senescence | 52/1875 | 156/8465 | 7.87e-04 | 5.07e-03 | 3.11e-03 | 52 |
| hsa042184 | Colorectum | FAP | Cellular senescence | 42/1404 | 156/8465 | 6.79e-04 | 4.63e-03 | 2.82e-03 | 42 |
| hsa042185 | Colorectum | FAP | Cellular senescence | 42/1404 | 156/8465 | 6.79e-04 | 4.63e-03 | 2.82e-03 | 42 |
| hsa0421816 | Endometrium | AEH | Cellular senescence | 37/1197 | 156/8465 | 8.49e-04 | 5.52e-03 | 4.04e-03 | 37 |
| hsa0421817 | Endometrium | AEH | Cellular senescence | 37/1197 | 156/8465 | 8.49e-04 | 5.52e-03 | 4.04e-03 | 37 |
| hsa0421825 | Endometrium | EEC | Cellular senescence | 40/1237 | 156/8465 | 1.89e-04 | 1.68e-03 | 1.25e-03 | 40 |
| hsa0421835 | Endometrium | EEC | Cellular senescence | 40/1237 | 156/8465 | 1.89e-04 | 1.68e-03 | 1.25e-03 | 40 |
| hsa0421829 | Esophagus | ESCC | Cellular senescence | 119/4205 | 156/8465 | 5.89e-12 | 9.40e-11 | 4.81e-11 | 119 |
| hsa0462122 | Esophagus | ESCC | NOD-like receptor signaling pathway | 116/4205 | 186/8465 | 2.90e-04 | 1.03e-03 | 5.30e-04 | 116 |
| hsa0421838 | Esophagus | ESCC | Cellular senescence | 119/4205 | 156/8465 | 5.89e-12 | 9.40e-11 | 4.81e-11 | 119 |
| hsa0462132 | Esophagus | ESCC | NOD-like receptor signaling pathway | 116/4205 | 186/8465 | 2.90e-04 | 1.03e-03 | 5.30e-04 | 116 |
| hsa042187 | Liver | Cirrhotic | Cellular senescence | 66/2530 | 156/8465 | 5.94e-04 | 3.60e-03 | 2.22e-03 | 66 |
| hsa0421812 | Liver | Cirrhotic | Cellular senescence | 66/2530 | 156/8465 | 5.94e-04 | 3.60e-03 | 2.22e-03 | 66 |
| Page: 1 2 |
Top |
Cell-cell communication analysis |
| Identification of potential cell-cell interactions between two cell types and their ligand-receptor pairs for different disease states |
| Ligand | Receptor | LRpair | Pathway | Tissue | Disease Stage |
| Page: 1 |
Top |
Single-cell gene regulatory network inference analysis |
| Find out the significant the regulons (TFs) and the target genes of each regulon across cell types for different disease states |
| TF | Cell Type | Tissue | Disease Stage | Target Gene | RSS | Regulon Activity |
| ∗The dot plots of a searched regulon are shown for all cell subpopulations in each disease state of each tissue based on the regulon specific score inferred using pySCENIC and by calculating the average expression. |
| Page: 1 |
Top |
Somatic mutation of malignant transformation related genes |
| Annotation of somatic variants for genes involved in malignant transformation |
| Hugo Symbol | Variant Class | Variant Classification | dbSNP RS | HGVSc | HGVSp | HGVSp Short | SWISSPROT | BIOTYPE | SIFT | PolyPhen | Tumor Sample Barcode | Tissue | Histology | Sex | Age | Stage | Therapy Types | Drugs | Outcome |
| TRPM7 | SNV | Missense_Mutation | novel | c.4157N>C | p.Ser1386Thr | p.S1386T | Q96QT4 | protein_coding | tolerated_low_confidence(0.27) | benign(0.006) | TCGA-5L-AAT1-01 | Breast | breast invasive carcinoma | Female | <65 | III/IV | Hormone Therapy | letrozol | SD |
| TRPM7 | SNV | Missense_Mutation | rs748556929 | c.1763G>A | p.Arg588Gln | p.R588Q | Q96QT4 | protein_coding | deleterious(0.03) | benign(0.038) | TCGA-AN-A046-01 | Breast | breast invasive carcinoma | Female | >=65 | I/II | Unknown | Unknown | SD |
| TRPM7 | SNV | Missense_Mutation | rs746157060 | c.4173N>G | p.Ile1391Met | p.I1391M | Q96QT4 | protein_coding | tolerated_low_confidence(0.43) | benign(0) | TCGA-BH-A0DK-01 | Breast | breast invasive carcinoma | Female | <65 | I/II | Hormone Therapy | tamoxiphen | SD |
| TRPM7 | SNV | Missense_Mutation | c.53N>C | p.Tyr18Ser | p.Y18S | Q96QT4 | protein_coding | tolerated(0.23) | possibly_damaging(0.468) | TCGA-E2-A156-01 | Breast | breast invasive carcinoma | Female | <65 | I/II | Hormone Therapy | arimidex | SD | |
| TRPM7 | SNV | Missense_Mutation | c.1748C>G | p.Thr583Arg | p.T583R | Q96QT4 | protein_coding | deleterious(0.03) | probably_damaging(0.996) | TCGA-E2-A15M-01 | Breast | breast invasive carcinoma | Female | >=65 | I/II | Hormone Therapy | arimidex | SD | |
| TRPM7 | insertion | Nonsense_Mutation | novel | c.4426_4427insAGAATTCTCAGTATTTAAGTTAACATAGAT | p.Ser1476delinsLysAsnSerGlnTyrLeuSerTerHisArgCys | p.S1476delinsKNSQYLS*HRC | Q96QT4 | protein_coding | TCGA-B6-A0IK-01 | Breast | breast invasive carcinoma | Female | <65 | III/IV | Unknown | Unknown | PD | ||
| TRPM7 | SNV | Missense_Mutation | novel | c.4586N>T | p.Arg1529Ile | p.R1529I | Q96QT4 | protein_coding | tolerated(0.19) | benign(0.015) | TCGA-2W-A8YY-01 | Cervix | cervical & endocervical cancer | Female | <65 | I/II | Chemotherapy | cisplatin | CR |
| TRPM7 | SNV | Missense_Mutation | c.3392N>T | p.Pro1131Leu | p.P1131L | Q96QT4 | protein_coding | deleterious(0.02) | possibly_damaging(0.588) | TCGA-C5-A1MH-01 | Cervix | cervical & endocervical cancer | Female | >=65 | III/IV | Chemotherapy | cisplatin | PD | |
| TRPM7 | SNV | Missense_Mutation | novel | c.3079G>T | p.Ala1027Ser | p.A1027S | Q96QT4 | protein_coding | tolerated(0.13) | benign(0.013) | TCGA-EA-A410-01 | Cervix | cervical & endocervical cancer | Female | <65 | I/II | Unknown | Unknown | SD |
| TRPM7 | SNV | Missense_Mutation | novel | c.542C>T | p.Ala181Val | p.A181V | Q96QT4 | protein_coding | tolerated(0.15) | benign(0.369) | TCGA-EA-A410-01 | Cervix | cervical & endocervical cancer | Female | <65 | I/II | Unknown | Unknown | SD |
| Page: 1 2 3 4 5 6 7 8 9 10 11 12 13 14 15 16 17 18 |
Top |
Related drugs of malignant transformation related genes |
| Identification of chemicals and drugs interact with genes involved in malignant transfromation |
| (DGIdb 4.0) |
| Entrez ID | Symbol | Category | Interaction Types | Drug Claim Name | Drug Name | PMIDs |
| 54822 | TRPM7 | DRUGGABLE GENOME, KINASE, SERINE THREONINE KINASE, ION CHANNEL, ENZYME, TRANSPORTER | blocker | 178101079 | NAFAMOSTAT | |
| 54822 | TRPM7 | DRUGGABLE GENOME, KINASE, SERINE THREONINE KINASE, ION CHANNEL, ENZYME, TRANSPORTER | activator | 135650688 | NALTRIBEN | |
| 54822 | TRPM7 | DRUGGABLE GENOME, KINASE, SERINE THREONINE KINASE, ION CHANNEL, ENZYME, TRANSPORTER | activator | 135652738 |
| Page: 1 |

Copyright 2023-Present -The University of Texas Health Science Center at Houston |