Schematic overview of the cellular and molecular mechanisms involved in the cancer progression, including the proposed cellular and molecular mechanisms in cancer cells trajectory. AT1: alveolar type 1 cells; AT2: alveolar type 2 cells; AAH: atypical adenomatous hyperplasia; AIS: adenocarcinoma in situ; MIA: minimally invasive adenocarcinoma; IA: invasive adenocarcinoma; EMT: epithelial-mesenchymal transition

Home

Download

Statistics

Help

Contact

Center for Computational Systems Medicine
leaf

Gene summary

leaf

Malignant transformation analysis

leaf

Malignant transformation related pathway analysis

leaf

Cell-cell communication analysis

leaf

Single-cell gene regulatory network inference analysis

leaf

Somatic mutation of malignant transformation related genes

leaf

Related drugs of malignant transformation related genes

Gene: TRPM4

Gene summary for TRPM4

check button Gene summary.

Gene informationSpeciesHuman
Gene symbol

TRPM4

Gene ID

54795

Gene nametransient receptor potential cation channel subfamily M member 4
Gene AliasEKVP6
Cytomap19q13.33
Gene Typeprotein-coding
GO ID

GO:0001503

UniProtAcc

Q8TD43


Top

Malignant transformation analysis

check button Identification of the aberrant gene expression in precancerous and cancerous lesions by comparing the gene expression of stem-like cells in diseased tissues with normal stem cells
check button Malignant transformation involving gene list.
Entrez IDSymbolReplicatesSpeciesOrganTissueAdj P-valueLog2FCMalignancy
54795TRPM4HTA11_3410_2000001011HumanColorectumAD9.37e-11-5.13e-010.0155
54795TRPM4HTA11_347_2000001011HumanColorectumAD1.19e-032.86e-01-0.1954
54795TRPM4HTA11_99999970781_79442HumanColorectumMSS6.21e-14-4.98e-010.294
54795TRPM4HTA11_99999971662_82457HumanColorectumMSS3.81e-07-3.90e-010.3859
54795TRPM4HTA11_99999974143_84620HumanColorectumMSS4.82e-27-6.58e-010.3005
54795TRPM4A002-C-010HumanColorectumFAP2.44e-04-3.01e-010.242
54795TRPM4A015-C-203HumanColorectumFAP1.43e-30-2.30e-01-0.1294
54795TRPM4A015-C-204HumanColorectumFAP3.55e-04-1.30e-01-0.0228
54795TRPM4A014-C-040HumanColorectumFAP4.32e-04-4.69e-01-0.1184
54795TRPM4A002-C-201HumanColorectumFAP3.16e-10-2.38e-010.0324
54795TRPM4A002-C-203HumanColorectumFAP1.81e-03-7.57e-020.2786
54795TRPM4A001-C-119HumanColorectumFAP4.17e-10-5.45e-01-0.1557
54795TRPM4A001-C-108HumanColorectumFAP7.16e-24-2.82e-01-0.0272
54795TRPM4A002-C-205HumanColorectumFAP4.79e-20-3.44e-01-0.1236
54795TRPM4A001-C-104HumanColorectumFAP6.31e-07-2.20e-010.0184
54795TRPM4A015-C-006HumanColorectumFAP3.23e-12-4.26e-01-0.0994
54795TRPM4A015-C-106HumanColorectumFAP1.80e-14-2.36e-01-0.0511
54795TRPM4A002-C-114HumanColorectumFAP1.10e-16-2.39e-01-0.1561
54795TRPM4A015-C-104HumanColorectumFAP1.10e-31-1.73e-01-0.1899
54795TRPM4A001-C-014HumanColorectumFAP4.76e-16-3.41e-010.0135
Page: 1 2 3 4 5 

check button Transcriptomic changes along malignancy continuum.
TissueExpression DynamicsAbbreviation
Colorectum (GSE201348)The image shows the transcriptomic changes along malignancy continuum.log2FC in expression of this searched gene in stem-like cells from each diseased tissue sample relative to stem-like cells in normal samples in each tissue plotted against the malignancy continuum. Samples are colored based on if they are from different disease stage.FAP: Familial adenomatous polyposis
CRC: Colorectal cancer
Colorectum (HTA11)The image shows the transcriptomic changes along malignancy continuum.log2FC in expression of this searched gene in stem-like cells from each diseased tissue sample relative to stem-like cells in normal samples in each tissue plotted against the malignancy continuum. Samples are colored based on if they are from different disease stage.AD: Adenomas
SER: Sessile serrated lesions
MSI-H: Microsatellite-high colorectal cancer
MSS: Microsatellite stable colorectal cancer
EndometriumThe image shows the transcriptomic changes along malignancy continuum.log2FC in expression of this searched gene in stem-like cells from each diseased tissue sample relative to stem-like cells in normal samples in each tissue plotted against the malignancy continuum. Samples are colored based on if they are from different disease stage.
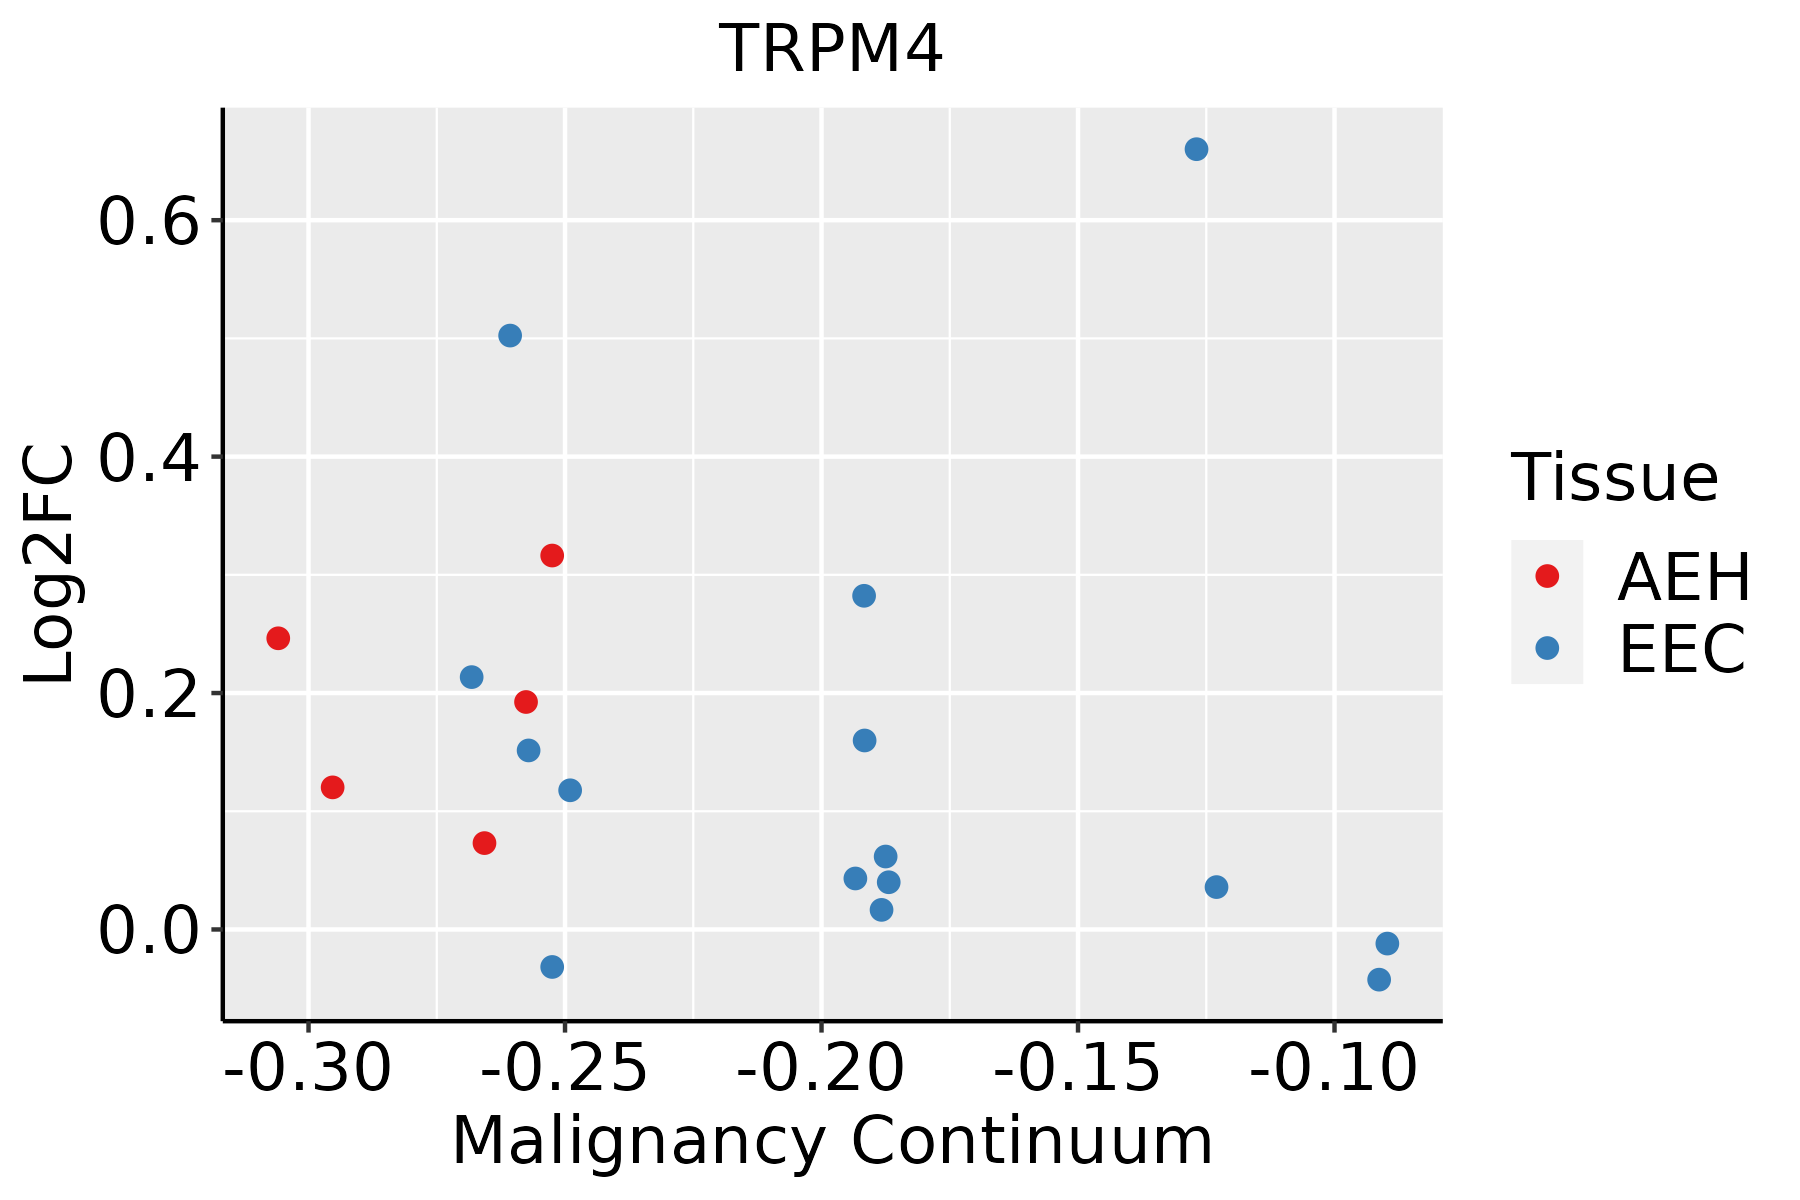
AEH: Atypical endometrial hyperplasia
EEC: Endometrioid Cancer
EsophagusThe image shows the transcriptomic changes along malignancy continuum.log2FC in expression of this searched gene in stem-like cells from each diseased tissue sample relative to stem-like cells in normal samples in each tissue plotted against the malignancy continuum. Samples are colored based on if they are from different disease stage.
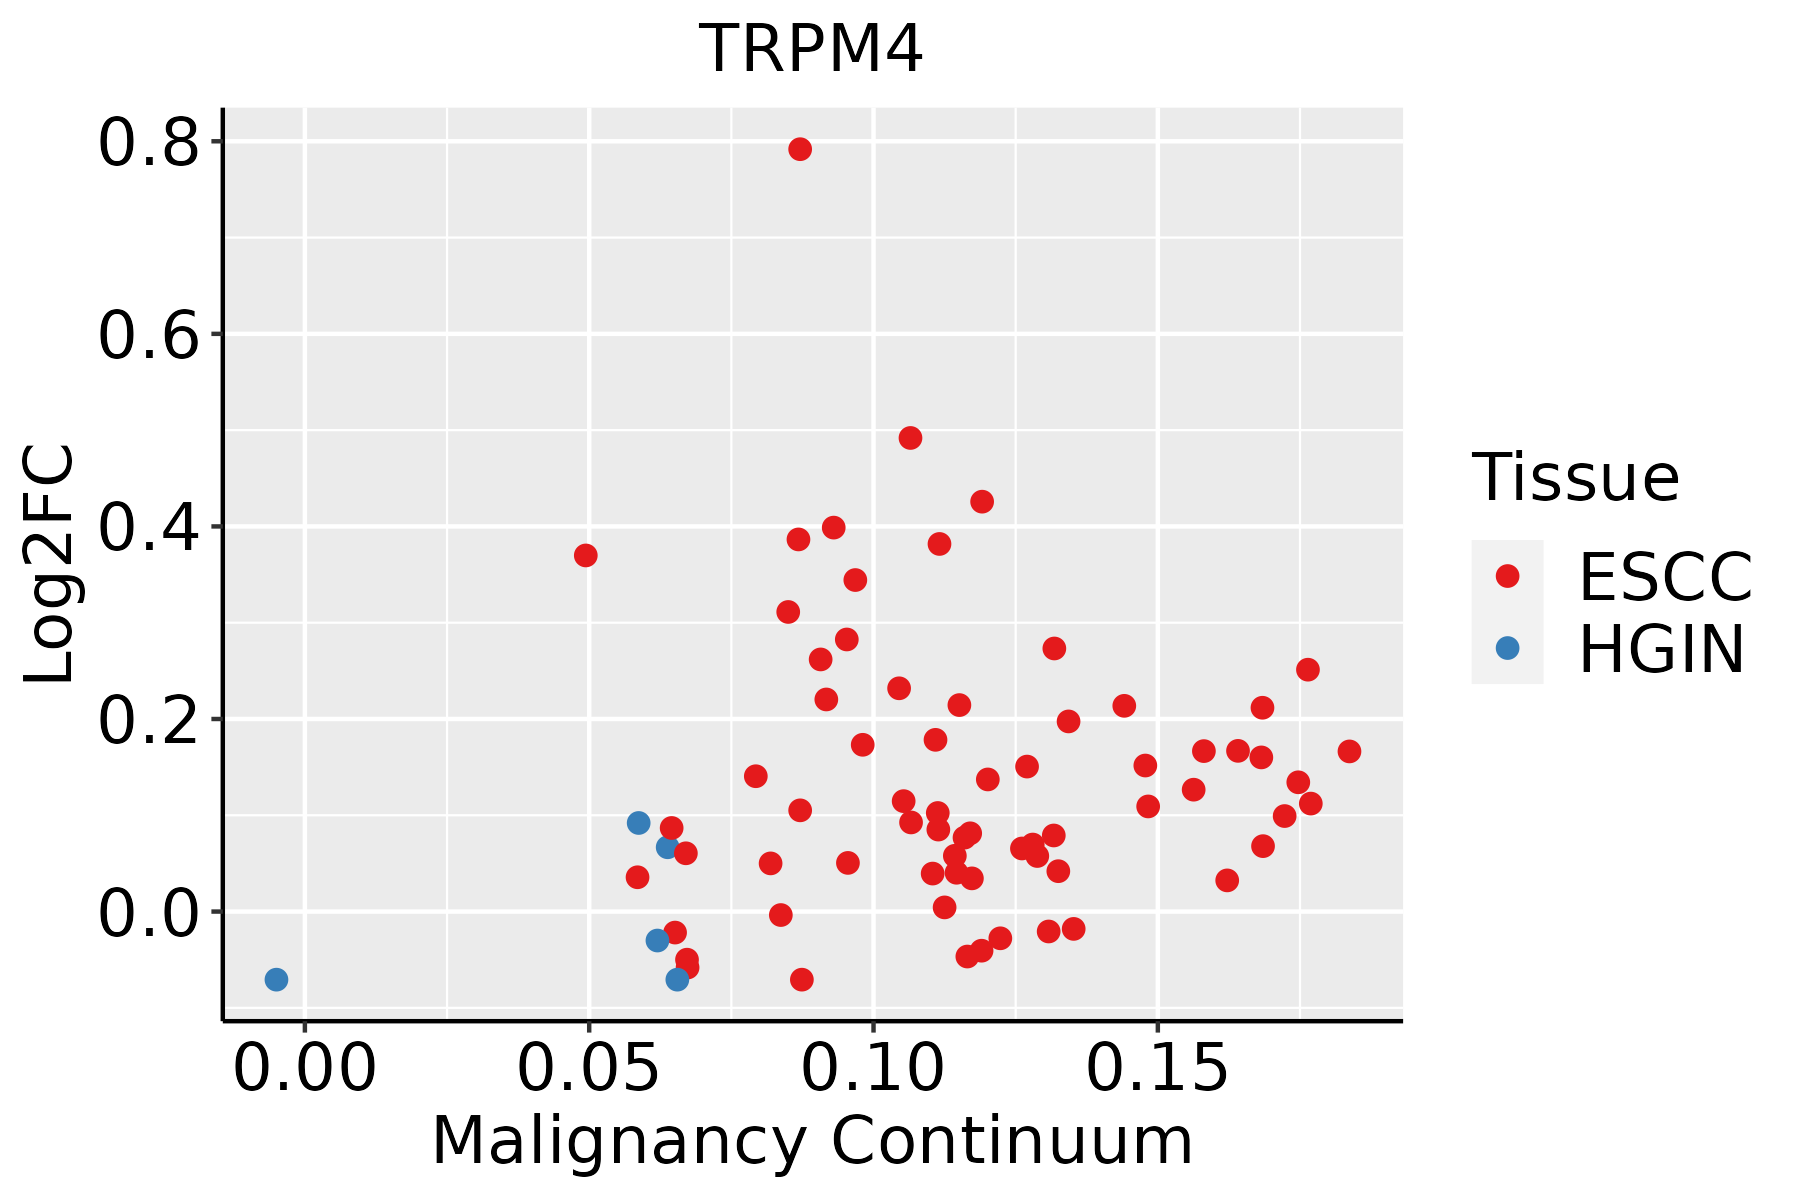
ESCC: Esophageal squamous cell carcinoma
HGIN: High-grade intraepithelial neoplasias
LGIN: Low-grade intraepithelial neoplasias
LiverThe image shows the transcriptomic changes along malignancy continuum.log2FC in expression of this searched gene in stem-like cells from each diseased tissue sample relative to stem-like cells in normal samples in each tissue plotted against the malignancy continuum. Samples are colored based on if they are from different disease stage.
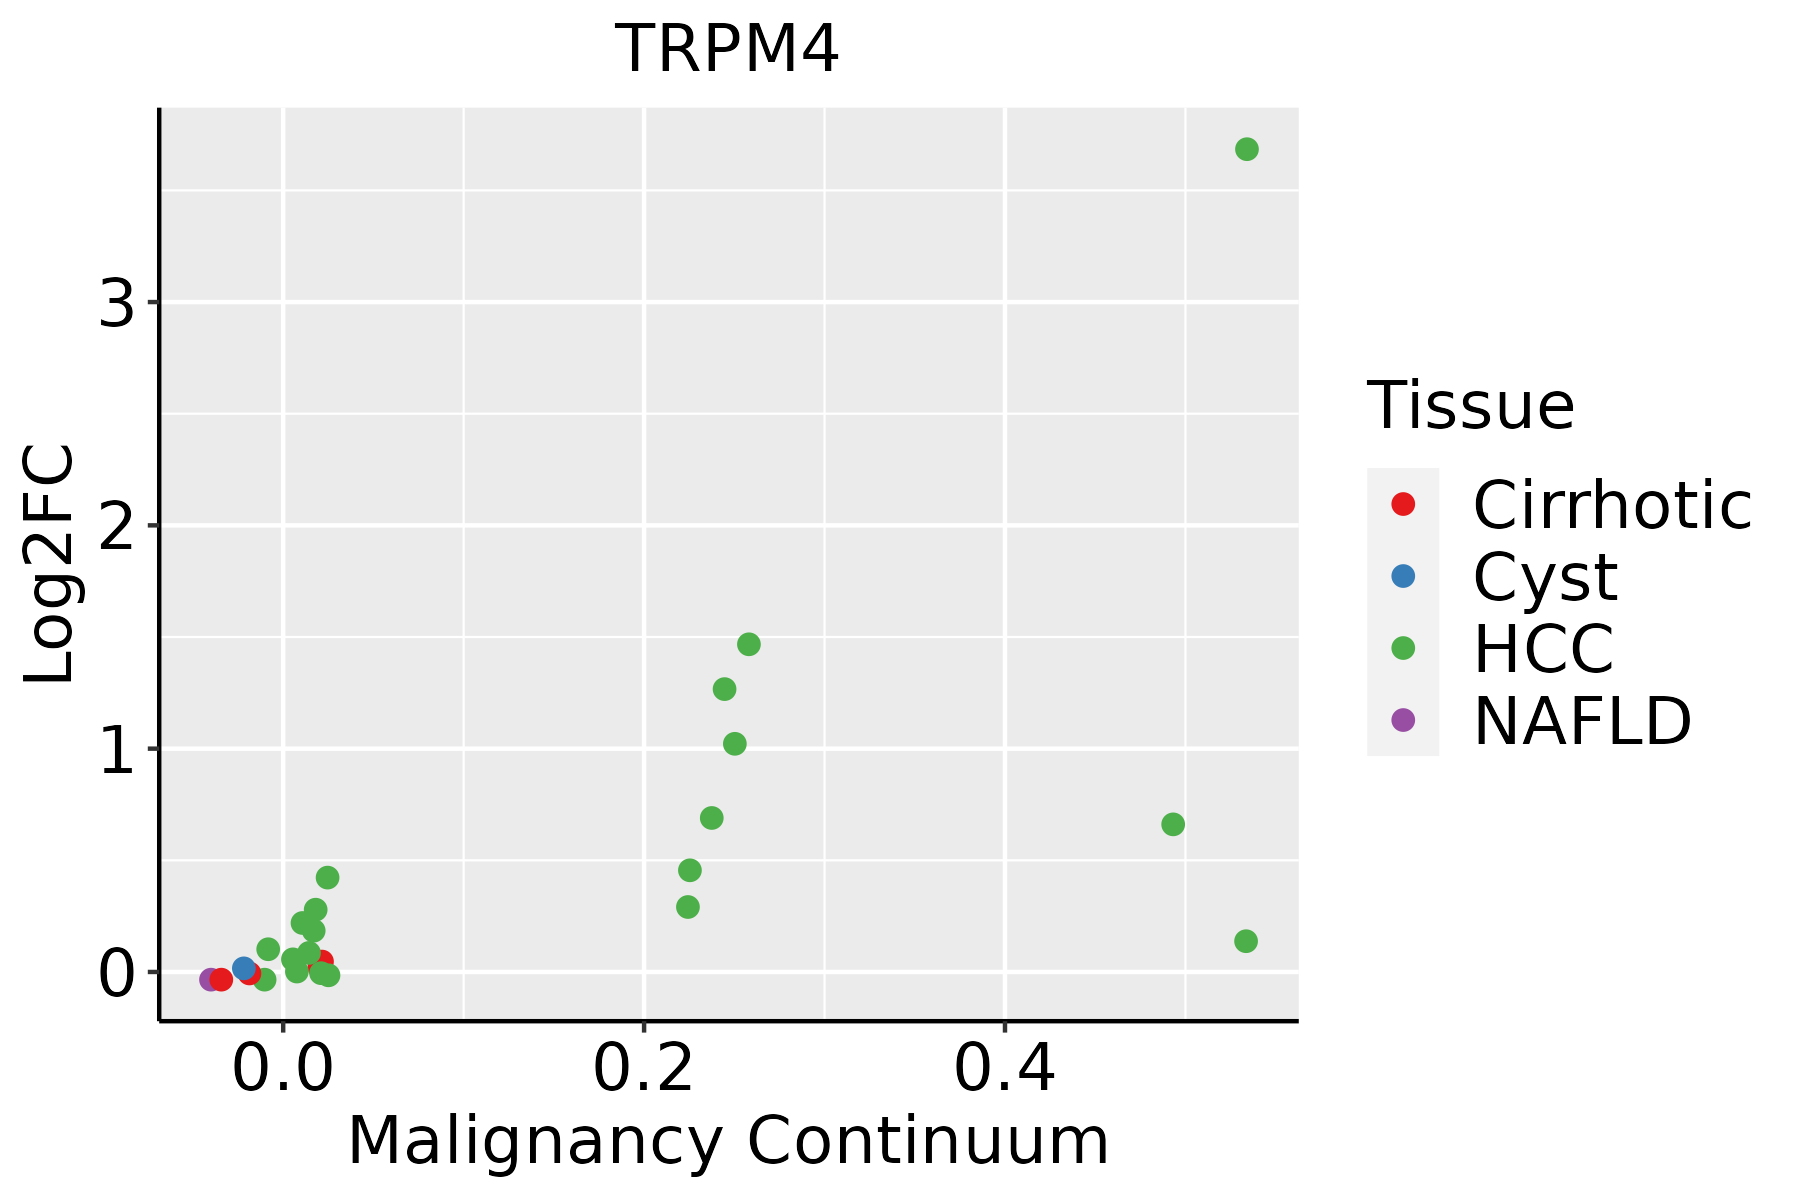
HCC: Hepatocellular carcinoma
NAFLD: Non-alcoholic fatty liver disease
ProstateThe image shows the transcriptomic changes along malignancy continuum.log2FC in expression of this searched gene in stem-like cells from each diseased tissue sample relative to stem-like cells in normal samples in each tissue plotted against the malignancy continuum. Samples are colored based on if they are from different disease stage.
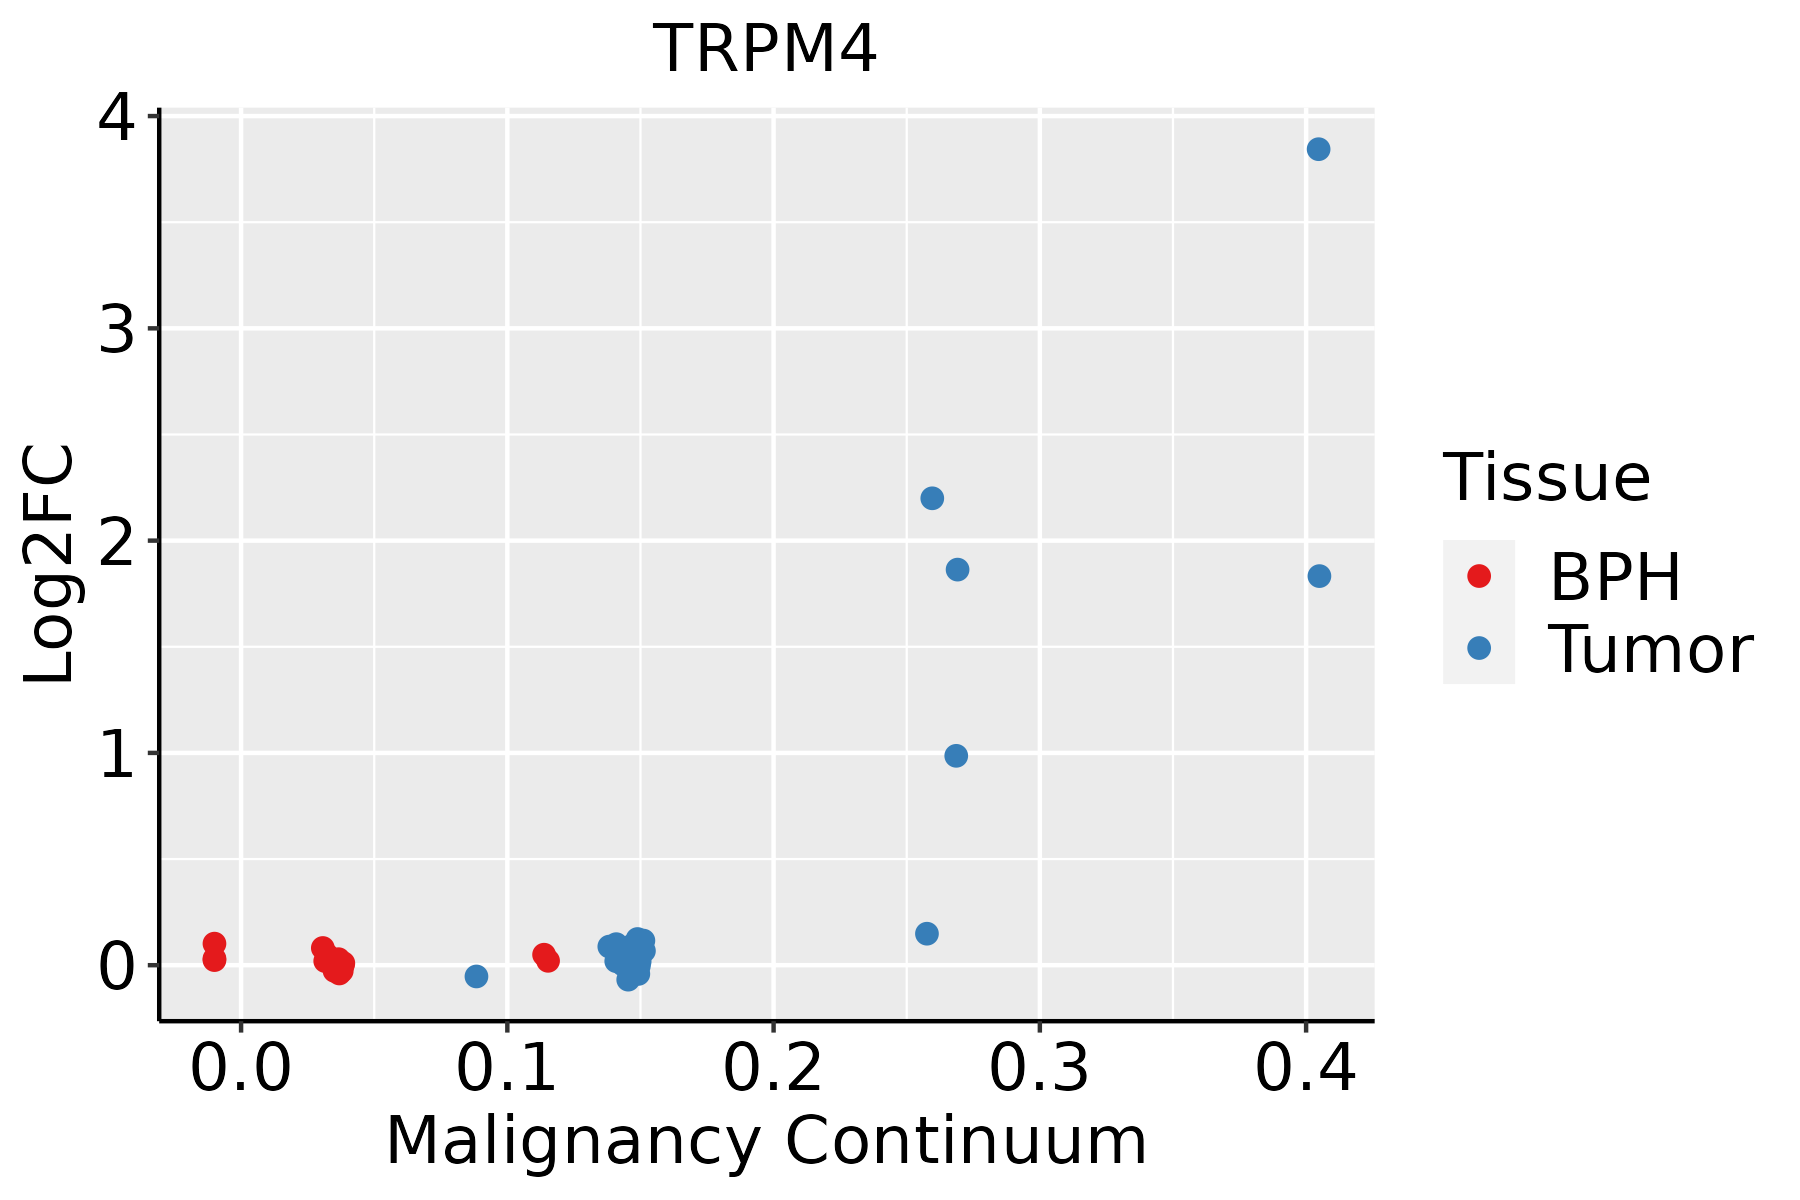
BPH: Benign Prostatic Hyperplasia
∗log2FC in expression of this searched gene in stem-like cells from each diseased tissue sample relative to stem-like cells in normal samples in each tissue plotted against the malignancy continuum. Samples are colored based on if they are from different disease stage.

Top

Malignant transformation related pathway analysis

check buttonFind out the enriched GO biological processes and KEGG pathways involved in transition from healthy to precancer to cancer
check button Figure of enriched GO biological processes.
TissueDisease StageEnriched GO biological Processes
ColorectumADGO analysis - Figure of enriched GO biological processes: Top 15 enriched GO BP terms are showed in the bar plot of each disease state in each tissue. Each row represents a significant GO biological process which is colored according to the -log10(p.adjust).
ColorectumSERGO analysis - Figure of enriched GO biological processes: Top 15 enriched GO BP terms are showed in the bar plot of each disease state in each tissue. Each row represents a significant GO biological process which is colored according to the -log10(p.adjust).
ColorectumMSSGO analysis - Figure of enriched GO biological processes: Top 15 enriched GO BP terms are showed in the bar plot of each disease state in each tissue. Each row represents a significant GO biological process which is colored according to the -log10(p.adjust).
ColorectumMSI-HGO analysis - Figure of enriched GO biological processes: Top 15 enriched GO BP terms are showed in the bar plot of each disease state in each tissue. Each row represents a significant GO biological process which is colored according to the -log10(p.adjust).
ColorectumFAPGO analysis - Figure of enriched GO biological processes: Top 15 enriched GO BP terms are showed in the bar plot of each disease state in each tissue. Each row represents a significant GO biological process which is colored according to the -log10(p.adjust).
∗Top 15 enriched GO BP terms are showed in the bar plot of each disease state in each tissue. Each row represents a significant GO biological process which is colored according to the -log10(p.adjust).
Page: 1 2 3 4 5 6 7 8 9 

check button Enriched GO biological processes.
GO IDTissueDisease StageDescriptionGene RatioBg Ratiopvaluep.adjustCount
GO:0032970ColorectumADregulation of actin filament-based process142/3918397/187234.05e-125.90e-10142
GO:1904951ColorectumADpositive regulation of establishment of protein localization112/3918319/187232.55e-091.80e-07112
GO:0051222ColorectumADpositive regulation of protein transport106/3918303/187238.45e-095.08e-07106
GO:0009743ColorectumADresponse to carbohydrate86/3918253/187238.43e-072.90e-0586
GO:0034284ColorectumADresponse to monosaccharide76/3918225/187234.64e-061.23e-0476
GO:0030111ColorectumADregulation of Wnt signaling pathway102/3918328/187238.51e-062.03e-04102
GO:0033500ColorectumADcarbohydrate homeostasis84/3918259/187239.10e-062.15e-0484
GO:0009746ColorectumADresponse to hexose73/3918219/187231.20e-052.65e-0473
GO:0009749ColorectumADresponse to glucose71/3918212/187231.31e-052.85e-0471
GO:0042593ColorectumADglucose homeostasis83/3918258/187231.44e-053.11e-0483
GO:0001678ColorectumADcellular glucose homeostasis60/3918172/187231.49e-053.18e-0460
GO:0016055ColorectumADWnt signaling pathway130/3918444/187231.60e-053.37e-04130
GO:0198738ColorectumADcell-cell signaling by wnt130/3918446/187232.02e-054.10e-04130
GO:0071322ColorectumADcellular response to carbohydrate stimulus56/3918163/187234.61e-057.97e-0456
GO:0050708ColorectumADregulation of protein secretion83/3918268/187236.59e-051.07e-0383
GO:0071333ColorectumADcellular response to glucose stimulus52/3918151/187237.88e-051.25e-0352
GO:0098901ColorectumADregulation of cardiac muscle cell action potential15/391827/187238.20e-051.29e-0315
GO:0098911ColorectumADregulation of ventricular cardiac muscle cell action potential9/391812/187239.01e-051.38e-039
GO:0009306ColorectumADprotein secretion105/3918359/187231.05e-041.57e-03105
GO:0071331ColorectumADcellular response to hexose stimulus52/3918153/187231.16e-041.71e-0352
Page: 1 2 3 4 5 6 7 8 9 10 11 12 13 14 15 16 17 18 19 20 21 22 23 24 

check button Enriched KEGG pathways.
Pathway IDTissueDisease StageDescriptionGene RatioBg Ratiopvaluep.adjustqvalueCount
hsa04911ColorectumFAPInsulin secretion23/140486/84651.12e-023.92e-022.38e-0223
hsa049111ColorectumFAPInsulin secretion23/140486/84651.12e-023.92e-022.38e-0223
hsa049112ColorectumCRCInsulin secretion20/109186/84655.61e-032.88e-021.95e-0220
hsa049113ColorectumCRCInsulin secretion20/109186/84655.61e-032.88e-021.95e-0220
Page: 1 

Top

Cell-cell communication analysis

check buttonIdentification of potential cell-cell interactions between two cell types and their ligand-receptor pairs for different disease states
LigandReceptorLRpairPathwayTissueDisease Stage
Page: 1 

Top

Single-cell gene regulatory network inference analysis

check buttonFind out the significant the regulons (TFs) and the target genes of each regulon across cell types for different disease states
TFCell TypeTissueDisease StageTarget GeneRSSRegulon Activity
∗The dot plots of a searched regulon are shown for all cell subpopulations in each disease state of each tissue based on the regulon specific score inferred using pySCENIC and by calculating the average expression.
Page: 1 

Top

Somatic mutation of malignant transformation related genes

check buttonAnnotation of somatic variants for genes involved in malignant transformation
Hugo SymbolVariant ClassVariant ClassificationdbSNP RSHGVScHGVSpHGVSp ShortSWISSPROTBIOTYPESIFTPolyPhenTumor Sample BarcodeTissueHistologySexAgeStageTherapy TypesDrugsOutcome
TRPM4SNVMissense_Mutationnovelc.949G>Ap.Asp317Asnp.D317NQ8TD43protein_codingtolerated(0.49)benign(0.011)TCGA-A8-A092-01Breastbreast invasive carcinomaFemale<65III/IVChemotherapypaclitaxelCR
TRPM4SNVMissense_Mutationc.2866N>Ap.Asp956Asnp.D956NQ8TD43protein_codingdeleterious(0.02)probably_damaging(0.998)TCGA-AC-A23H-01Breastbreast invasive carcinomaFemale>=65I/IIUnknownUnknownPD
TRPM4SNVMissense_Mutationc.929N>Ap.Cys310Tyrp.C310YQ8TD43protein_codingdeleterious(0.02)benign(0.243)TCGA-BH-A0HF-01Breastbreast invasive carcinomaFemale>=65I/IIHormone TherapyarimidexSD
TRPM4SNVMissense_Mutationnovelc.3370N>Gp.Trp1124Glyp.W1124GQ8TD43protein_codingdeleterious(0)probably_damaging(0.997)TCGA-LL-A73Z-01Breastbreast invasive carcinomaFemale<65III/IVChemotherapyadriamycinPD
TRPM4SNVMissense_Mutationnovelc.3568N>Ap.Ala1190Thrp.A1190TQ8TD43protein_codingtolerated(0.09)benign(0.027)TCGA-PL-A8LV-01Breastbreast invasive carcinomaFemale<65III/IVUnknownUnknownSD
TRPM4insertionNonsense_Mutationnovelc.2960_2961insTTGAAGAGGAACCTGTACTTTACTTTTTAp.Met988Terp.M988*Q8TD43protein_codingTCGA-BH-A0DZ-01Breastbreast invasive carcinomaFemale<65I/IIChemotherapydocetaxelSD
TRPM4insertionNonsense_Mutationnovelc.2060_2061insGGTTAAAATGTCACAGTACCCTCTTACTGAAATTTAGTGGTCTCTp.Thr687_Thr688insValLysMetSerGlnTyrProLeuThrGluIleTerTrpSerLeup.T687_T688insVKMSQYPLTEI*WSLQ8TD43protein_codingTCGA-BH-A0HF-01Breastbreast invasive carcinomaFemale>=65I/IIHormone TherapyarimidexSD
TRPM4deletionFrame_Shift_Delnovelc.1331delNp.Leu444ProfsTer12p.L444Pfs*12Q8TD43protein_codingTCGA-EW-A2FV-01Breastbreast invasive carcinomaFemale<65III/IVChemotherapydocetaxelSD
TRPM4SNVMissense_Mutationrs886054577c.721N>Ap.Gly241Serp.G241SQ8TD43protein_codingdeleterious(0.01)possibly_damaging(0.881)TCGA-2W-A8YY-01Cervixcervical & endocervical cancerFemale<65I/IIChemotherapycisplatinCR
TRPM4SNVMissense_Mutationnovelc.871N>Ap.Ala291Thrp.A291TQ8TD43protein_codingdeleterious(0)possibly_damaging(0.45)TCGA-2W-A8YY-01Cervixcervical & endocervical cancerFemale<65I/IIChemotherapycisplatinCR
Page: 1 2 3 4 5 6 7 8 9 10 11 12 13 

Top

Related drugs of malignant transformation related genes

check buttonIdentification of chemicals and drugs interact with genes involved in malignant transfromation
(DGIdb 4.0)
Entrez IDSymbolCategoryInteraction TypesDrug Claim NameDrug NamePMIDs
54795TRPM4ION CHANNEL, TRANSPORTER, DRUGGABLE GENOMEinhibitor135651427ADENOSINE DIPHOSPHATE
54795TRPM4ION CHANNEL, TRANSPORTER, DRUGGABLE GENOMEblocker135651426ADENOSINE
54795TRPM4ION CHANNEL, TRANSPORTER, DRUGGABLE GENOMEactivator135651544
54795TRPM4ION CHANNEL, TRANSPORTER, DRUGGABLE GENOMEblocker135651562SPERMINE
54795TRPM4ION CHANNEL, TRANSPORTER, DRUGGABLE GENOMEinhibitor375973226
54795TRPM4ION CHANNEL, TRANSPORTER, DRUGGABLE GENOMEinhibitor53801012
54795TRPM4ION CHANNEL, TRANSPORTER, DRUGGABLE GENOMEactivator135650028
54795TRPM4ION CHANNEL, TRANSPORTER, DRUGGABLE GENOMEinhibitor135651437
54795TRPM4ION CHANNEL, TRANSPORTER, DRUGGABLE GENOMEblocker178100936
54795TRPM4ION CHANNEL, TRANSPORTER, DRUGGABLE GENOMEactivator135652731
Page: 1 2