
|
|||||
|
 | |
| |
| |
| |
| |
| |
|
Gene: TRPM3 |
Gene summary for TRPM3 |
| Gene information | Species | Human | Gene symbol | TRPM3 | Gene ID | 80036 |
| Gene name | transient receptor potential cation channel subfamily M member 3 | |
| Gene Alias | GON-2 | |
| Cytomap | 9q21.12-q21.13 | |
| Gene Type | protein-coding | GO ID | GO:0003008 | UniProtAcc | Q6NW43 |
Top |
Malignant transformation analysis |
| Identification of the aberrant gene expression in precancerous and cancerous lesions by comparing the gene expression of stem-like cells in diseased tissues with normal stem cells |
| Entrez ID | Symbol | Replicates | Species | Organ | Tissue | Adj P-value | Log2FC | Malignancy |
| 80036 | TRPM3 | HTA11_3361_2000001011 | Human | Colorectum | AD | 7.25e-05 | 1.85e-01 | -0.1207 |
| 80036 | TRPM3 | HTA11_1391_2000001011 | Human | Colorectum | AD | 2.70e-02 | 1.77e-01 | -0.059 |
| 80036 | TRPM3 | HTA11_866_3004761011 | Human | Colorectum | AD | 3.57e-05 | 3.83e-01 | 0.096 |
| 80036 | TRPM3 | HTA11_99999970781_79442 | Human | Colorectum | MSS | 9.20e-29 | 1.31e+00 | 0.294 |
| 80036 | TRPM3 | HTA11_99999974143_84620 | Human | Colorectum | MSS | 5.65e-22 | 6.72e-01 | 0.3005 |
| 80036 | TRPM3 | A001-C-119 | Human | Colorectum | FAP | 8.58e-05 | 4.39e-01 | -0.1557 |
| 80036 | TRPM3 | A002-C-021 | Human | Colorectum | FAP | 1.02e-05 | 2.99e-01 | 0.1171 |
| 80036 | TRPM3 | A001-C-007 | Human | Colorectum | CRC | 3.44e-06 | 5.30e-01 | 0.1899 |
| 80036 | TRPM3 | CRC-1-8810 | Human | Colorectum | CRC | 5.60e-36 | 9.07e-01 | 0.6257 |
| 80036 | TRPM3 | Pt14.d | Human | Liver | HCC | 9.14e-03 | -7.02e-02 | 0.0143 |
| 80036 | TRPM3 | S014 | Human | Liver | HCC | 8.90e-10 | 5.32e-01 | 0.2254 |
| 80036 | TRPM3 | S015 | Human | Liver | HCC | 1.88e-12 | 6.08e-01 | 0.2375 |
| 80036 | TRPM3 | S016 | Human | Liver | HCC | 1.47e-21 | 7.15e-01 | 0.2243 |
| 80036 | TRPM3 | HTA12-15-2 | Human | Pancreas | PDAC | 1.28e-15 | 1.23e+00 | 0.2315 |
| 80036 | TRPM3 | HTA12-16-2 | Human | Pancreas | PDAC | 1.71e-02 | 1.05e+00 | 0.0535 |
| 80036 | TRPM3 | HTA12-23-1 | Human | Pancreas | PDAC | 1.57e-26 | 1.91e+00 | 0.3405 |
| 80036 | TRPM3 | HTA12-25-1 | Human | Pancreas | PDAC | 1.56e-20 | 1.54e+00 | 0.313 |
| 80036 | TRPM3 | HTA12-26-1 | Human | Pancreas | PDAC | 3.31e-53 | 2.07e+00 | 0.3728 |
| 80036 | TRPM3 | HTA12-29-1 | Human | Pancreas | PDAC | 1.07e-124 | 2.15e+00 | 0.3722 |
| 80036 | TRPM3 | HTA12-30-1 | Human | Pancreas | PDAC | 5.66e-08 | 1.70e+00 | 0.3671 |
| Page: 1 2 |
| Tissue | Expression Dynamics | Abbreviation |
| Colorectum (GSE201348) |  | FAP: Familial adenomatous polyposis |
| CRC: Colorectal cancer | ||
| Colorectum (HTA11) |  | AD: Adenomas |
| SER: Sessile serrated lesions | ||
| MSI-H: Microsatellite-high colorectal cancer | ||
| MSS: Microsatellite stable colorectal cancer | ||
| Liver | 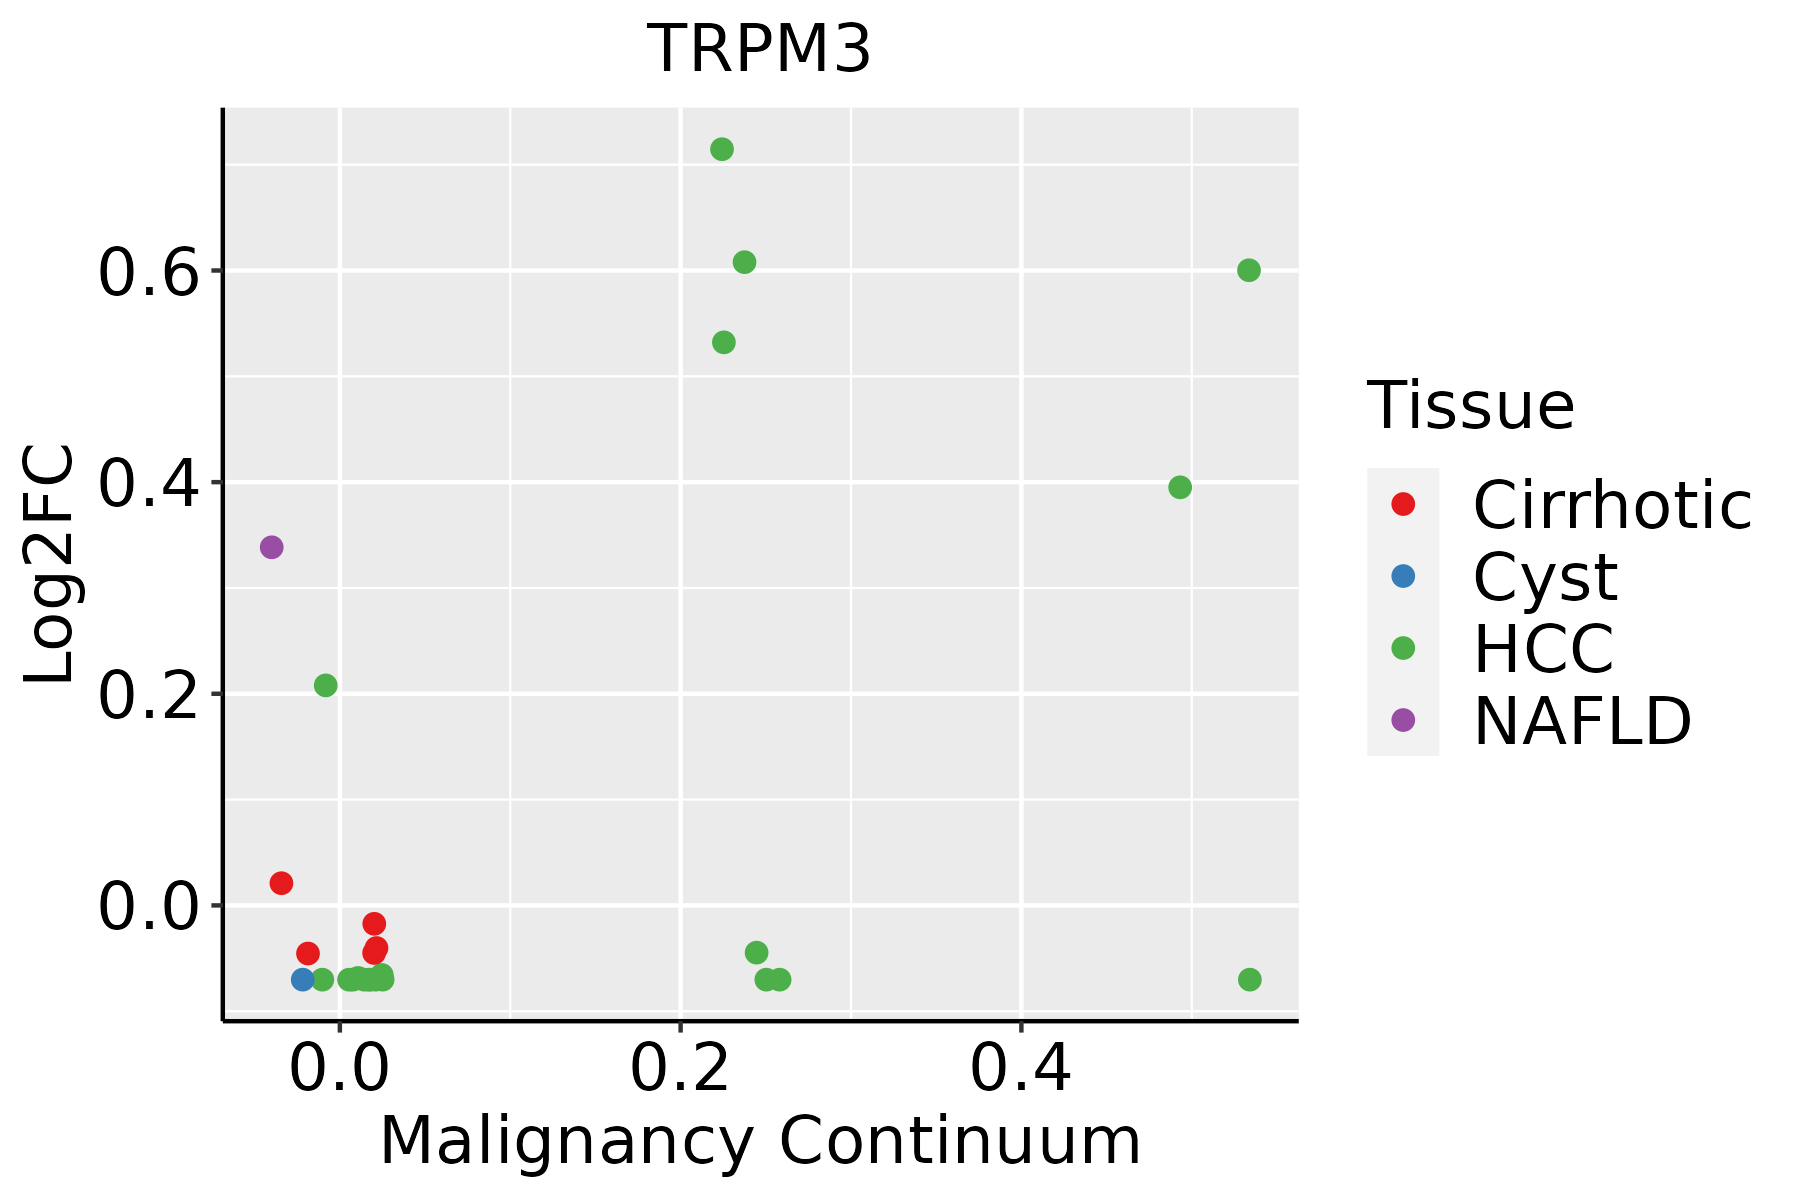 | HCC: Hepatocellular carcinoma |
| NAFLD: Non-alcoholic fatty liver disease |
| ∗log2FC in expression of this searched gene in stem-like cells from each diseased tissue sample relative to stem-like cells in normal samples in each tissue plotted against the malignancy continuum. Samples are colored based on if they are from different disease stage. |
Top |
Malignant transformation related pathway analysis |
| Find out the enriched GO biological processes and KEGG pathways involved in transition from healthy to precancer to cancer |
| Tissue | Disease Stage | Enriched GO biological Processes |
| Colorectum | AD |  |
| Colorectum | SER |  |
| Colorectum | MSS |  |
| Colorectum | MSI-H |  |
| Colorectum | FAP |  |
| ∗Top 15 enriched GO BP terms are showed in the bar plot of each disease state in each tissue. Each row represents a significant GO biological process which is colored according to the -log10(p.adjust). |
| Page: 1 2 3 4 5 6 7 8 9 |
| GO ID | Tissue | Disease Stage | Description | Gene Ratio | Bg Ratio | pvalue | p.adjust | Count |
| GO:000926611 | Liver | HCC | response to temperature stimulus | 101/7958 | 178/18723 | 8.55e-05 | 7.48e-04 | 101 |
| GO:0051262 | Liver | HCC | protein tetramerization | 50/7958 | 87/18723 | 3.42e-03 | 1.55e-02 | 50 |
| Page: 1 |
| Pathway ID | Tissue | Disease Stage | Description | Gene Ratio | Bg Ratio | pvalue | p.adjust | qvalue | Count |
| Page: 1 |
Top |
Cell-cell communication analysis |
| Identification of potential cell-cell interactions between two cell types and their ligand-receptor pairs for different disease states |
| Ligand | Receptor | LRpair | Pathway | Tissue | Disease Stage |
| Page: 1 |
Top |
Single-cell gene regulatory network inference analysis |
| Find out the significant the regulons (TFs) and the target genes of each regulon across cell types for different disease states |
| TF | Cell Type | Tissue | Disease Stage | Target Gene | RSS | Regulon Activity |
| ∗The dot plots of a searched regulon are shown for all cell subpopulations in each disease state of each tissue based on the regulon specific score inferred using pySCENIC and by calculating the average expression. |
| Page: 1 |
Top |
Somatic mutation of malignant transformation related genes |
| Annotation of somatic variants for genes involved in malignant transformation |
| Hugo Symbol | Variant Class | Variant Classification | dbSNP RS | HGVSc | HGVSp | HGVSp Short | SWISSPROT | BIOTYPE | SIFT | PolyPhen | Tumor Sample Barcode | Tissue | Histology | Sex | Age | Stage | Therapy Types | Drugs | Outcome |
| TRPM3 | SNV | Missense_Mutation | novel | c.3574C>A | p.His1192Asn | p.H1192N | Q9HCF6 | protein_coding | deleterious(0.01) | probably_damaging(0.974) | TCGA-A2-A0EP-01 | Breast | breast invasive carcinoma | Female | <65 | I/II | Chemotherapy | cyclophosphamide | CR |
| TRPM3 | SNV | Missense_Mutation | c.1025A>G | p.Asn342Ser | p.N342S | Q9HCF6 | protein_coding | tolerated(0.11) | benign(0.087) | TCGA-A7-A13D-01 | Breast | breast invasive carcinoma | Female | <65 | I/II | Chemotherapy | cytoxan | SD | |
| TRPM3 | SNV | Missense_Mutation | c.850G>T | p.Val284Phe | p.V284F | Q9HCF6 | protein_coding | deleterious(0) | probably_damaging(0.923) | TCGA-A8-A09T-01 | Breast | breast invasive carcinoma | Female | >=65 | I/II | Hormone Therapy | anastrozole | SD | |
| TRPM3 | SNV | Missense_Mutation | c.4956N>C | p.Lys1652Asn | p.K1652N | Q9HCF6 | protein_coding | tolerated_low_confidence(0.15) | benign(0.127) | TCGA-AC-A23H-01 | Breast | breast invasive carcinoma | Female | >=65 | I/II | Unknown | Unknown | PD | |
| TRPM3 | SNV | Missense_Mutation | c.427N>C | p.Glu143Gln | p.E143Q | Q9HCF6 | protein_coding | deleterious(0.01) | possibly_damaging(0.596) | TCGA-AC-A23H-01 | Breast | breast invasive carcinoma | Female | >=65 | I/II | Unknown | Unknown | PD | |
| TRPM3 | SNV | Missense_Mutation | c.154N>T | p.Leu52Phe | p.L52F | Q9HCF6 | protein_coding | tolerated_low_confidence(0.05) | probably_damaging(0.986) | TCGA-AC-A23H-01 | Breast | breast invasive carcinoma | Female | >=65 | I/II | Unknown | Unknown | PD | |
| TRPM3 | SNV | Missense_Mutation | novel | c.55G>A | p.Glu19Lys | p.E19K | protein_coding | tolerated_low_confidence(0.09) | benign(0) | TCGA-AC-A5XS-01 | Breast | breast invasive carcinoma | Female | >=65 | I/II | Hormone Therapy | femara | SD | |
| TRPM3 | SNV | Missense_Mutation | novel | c.2600N>G | p.Asn867Ser | p.N867S | Q9HCF6 | protein_coding | tolerated(0.14) | benign(0.143) | TCGA-AC-A6IW-01 | Breast | breast invasive carcinoma | Female | >=65 | I/II | Unknown | Unknown | SD |
| TRPM3 | SNV | Missense_Mutation | rs764791547 | c.3869C>T | p.Thr1290Met | p.T1290M | Q9HCF6 | protein_coding | deleterious(0.04) | possibly_damaging(0.831) | TCGA-AO-A128-01 | Breast | breast invasive carcinoma | Female | <65 | I/II | Chemotherapy | doxorubicin | SD |
| TRPM3 | SNV | Missense_Mutation | novel | c.4753G>A | p.Glu1585Lys | p.E1585K | Q9HCF6 | protein_coding | deleterious_low_confidence(0) | probably_damaging(0.987) | TCGA-BH-A5J0-01 | Breast | breast invasive carcinoma | Female | <65 | I/II | Unknown | Unknown | SD |
| Page: 1 2 3 4 5 6 7 8 9 10 11 12 13 14 15 16 17 18 19 20 21 22 23 24 25 26 27 28 29 |
Top |
Related drugs of malignant transformation related genes |
| Identification of chemicals and drugs interact with genes involved in malignant transfromation |
| (DGIdb 4.0) |
| Entrez ID | Symbol | Category | Interaction Types | Drug Claim Name | Drug Name | PMIDs |
| 80036 | TRPM3 | ION CHANNEL, DRUGGABLE GENOME | activator | 53801018 | SPHINGOSINE | |
| 80036 | TRPM3 | ION CHANNEL, DRUGGABLE GENOME | activator | 178101107 | ||
| 80036 | TRPM3 | ION CHANNEL, DRUGGABLE GENOME | blocker | 135650927 | ROSIGLITAZONE | |
| 80036 | TRPM3 | ION CHANNEL, DRUGGABLE GENOME | inhibitor | 135649695 | ||
| 80036 | TRPM3 | ION CHANNEL, DRUGGABLE GENOME | activator | 381744978 | ||
| 80036 | TRPM3 | ION CHANNEL, DRUGGABLE GENOME | blocker | 135650566 | MAPROTILINE | |
| 80036 | TRPM3 | ION CHANNEL, DRUGGABLE GENOME | activator | 135650729 | ||
| 80036 | TRPM3 | ION CHANNEL, DRUGGABLE GENOME | blocker | 135650829 | PIOGLITAZONE | |
| 80036 | TRPM3 | ION CHANNEL, DRUGGABLE GENOME | blocker | 135652743 | ||
| 80036 | TRPM3 | ION CHANNEL, DRUGGABLE GENOME | blocker | 135650177 | DICLOFENAC |
| Page: 1 2 3 |

Copyright 2023-Present -The University of Texas Health Science Center at Houston |