
|
|||||
|
 | |
| |
| |
| |
| |
| |
|
Gene: TRNT1 |
Gene summary for TRNT1 |
| Gene information | Species | Human | Gene symbol | TRNT1 | Gene ID | 51095 |
| Gene name | tRNA nucleotidyl transferase 1 | |
| Gene Alias | CCA1 | |
| Cytomap | 3p26.2 | |
| Gene Type | protein-coding | GO ID | GO:0000959 | UniProtAcc | Q96Q11 |
Top |
Malignant transformation analysis |
| Identification of the aberrant gene expression in precancerous and cancerous lesions by comparing the gene expression of stem-like cells in diseased tissues with normal stem cells |
| Entrez ID | Symbol | Replicates | Species | Organ | Tissue | Adj P-value | Log2FC | Malignancy |
| 51095 | TRNT1 | LZE2T | Human | Esophagus | ESCC | 3.33e-03 | 4.47e-01 | 0.082 |
| 51095 | TRNT1 | LZE4T | Human | Esophagus | ESCC | 4.59e-02 | 8.45e-02 | 0.0811 |
| 51095 | TRNT1 | LZE8T | Human | Esophagus | ESCC | 1.10e-03 | 9.96e-02 | 0.067 |
| 51095 | TRNT1 | LZE22T | Human | Esophagus | ESCC | 7.61e-03 | 2.95e-01 | 0.068 |
| 51095 | TRNT1 | LZE24T | Human | Esophagus | ESCC | 3.28e-12 | 3.48e-01 | 0.0596 |
| 51095 | TRNT1 | LZE21T | Human | Esophagus | ESCC | 1.58e-03 | 2.32e-01 | 0.0655 |
| 51095 | TRNT1 | LZE6T | Human | Esophagus | ESCC | 3.59e-05 | 1.68e-01 | 0.0845 |
| 51095 | TRNT1 | P1T-E | Human | Esophagus | ESCC | 5.90e-05 | 3.96e-01 | 0.0875 |
| 51095 | TRNT1 | P2T-E | Human | Esophagus | ESCC | 9.58e-08 | 1.59e-01 | 0.1177 |
| 51095 | TRNT1 | P4T-E | Human | Esophagus | ESCC | 1.28e-19 | 3.08e-01 | 0.1323 |
| 51095 | TRNT1 | P5T-E | Human | Esophagus | ESCC | 5.81e-18 | 3.81e-01 | 0.1327 |
| 51095 | TRNT1 | P8T-E | Human | Esophagus | ESCC | 1.89e-07 | 1.81e-01 | 0.0889 |
| 51095 | TRNT1 | P9T-E | Human | Esophagus | ESCC | 7.76e-17 | 2.53e-01 | 0.1131 |
| 51095 | TRNT1 | P10T-E | Human | Esophagus | ESCC | 1.01e-16 | 2.38e-01 | 0.116 |
| 51095 | TRNT1 | P11T-E | Human | Esophagus | ESCC | 2.49e-13 | 3.35e-01 | 0.1426 |
| 51095 | TRNT1 | P12T-E | Human | Esophagus | ESCC | 6.84e-10 | 2.18e-01 | 0.1122 |
| 51095 | TRNT1 | P15T-E | Human | Esophagus | ESCC | 4.54e-09 | 1.85e-01 | 0.1149 |
| 51095 | TRNT1 | P16T-E | Human | Esophagus | ESCC | 4.64e-11 | 1.91e-01 | 0.1153 |
| 51095 | TRNT1 | P17T-E | Human | Esophagus | ESCC | 1.88e-06 | 2.17e-01 | 0.1278 |
| 51095 | TRNT1 | P19T-E | Human | Esophagus | ESCC | 5.90e-03 | 3.38e-01 | 0.1662 |
| Page: 1 2 3 4 5 |
| Tissue | Expression Dynamics | Abbreviation |
| Esophagus | 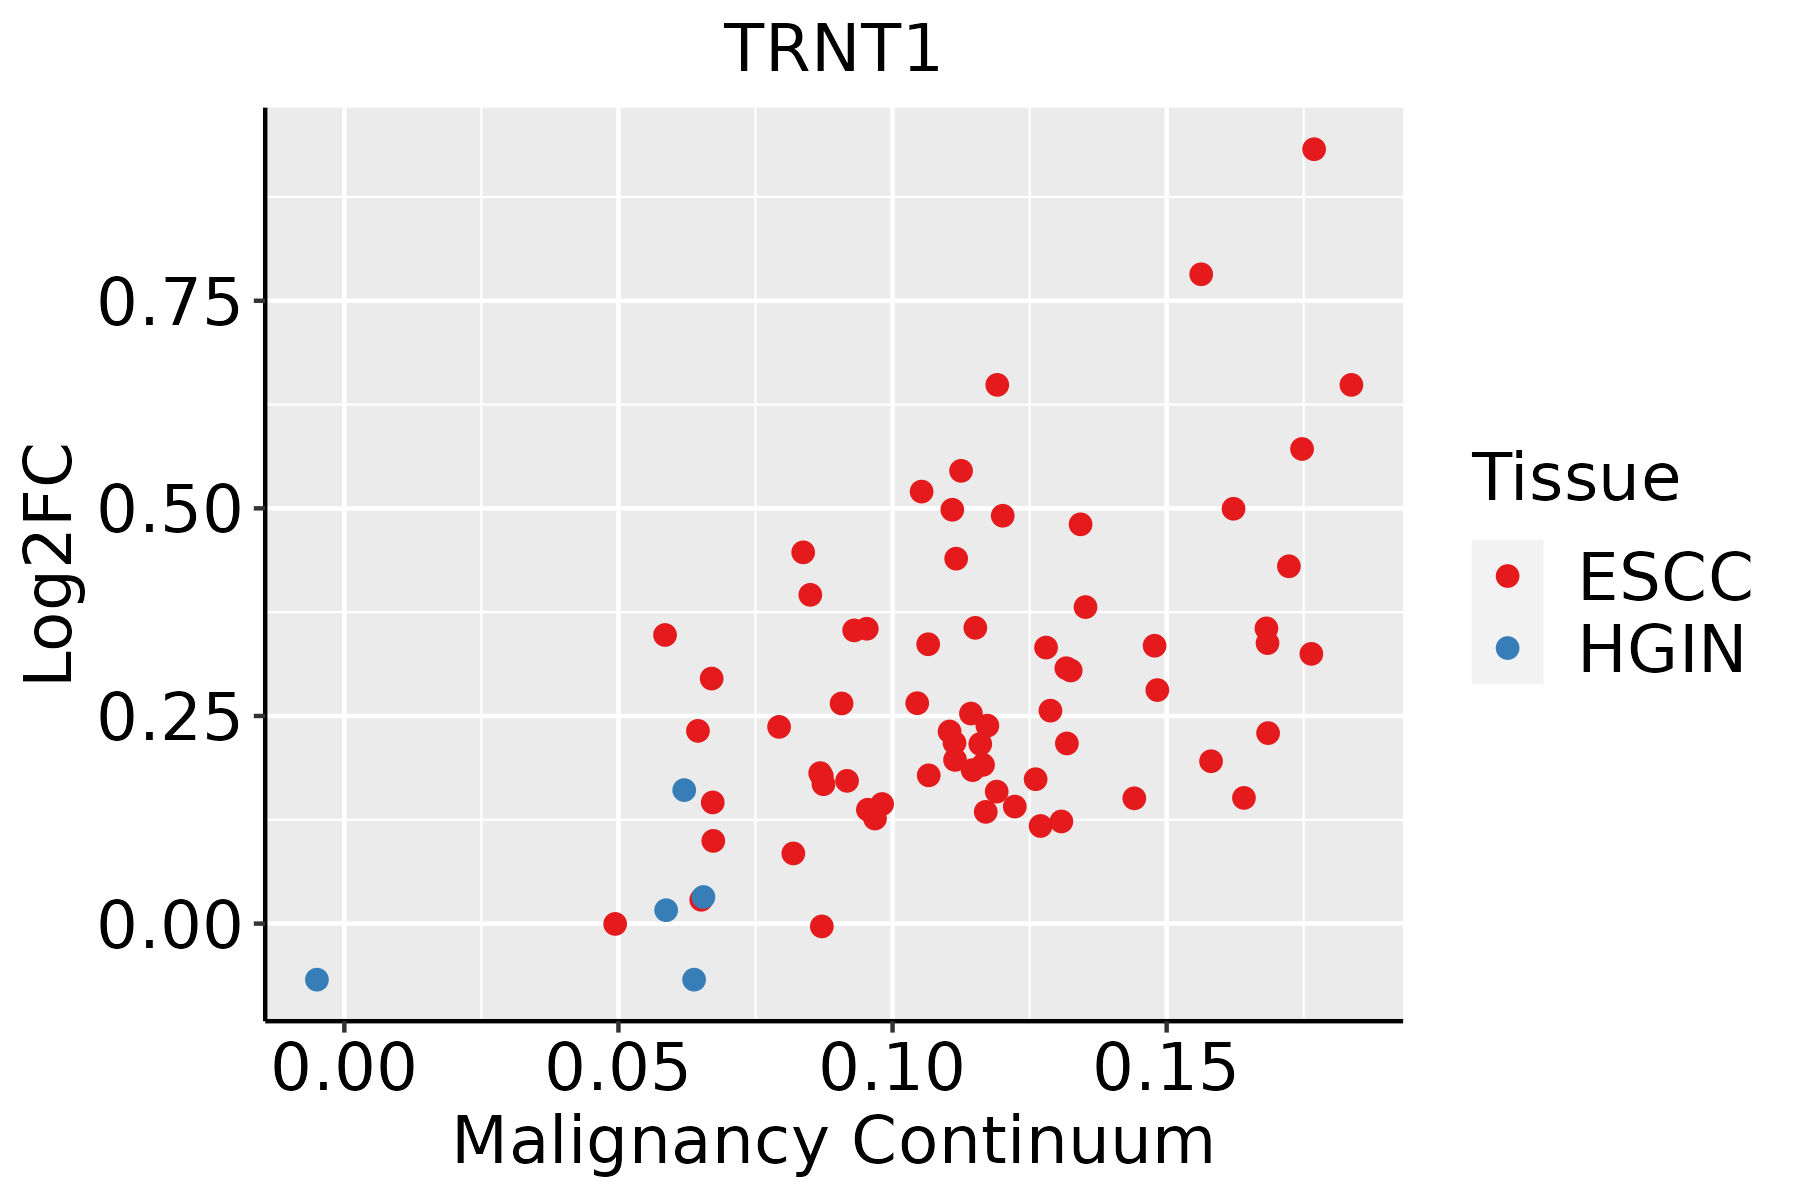 | ESCC: Esophageal squamous cell carcinoma |
| HGIN: High-grade intraepithelial neoplasias | ||
| LGIN: Low-grade intraepithelial neoplasias | ||
| Liver | 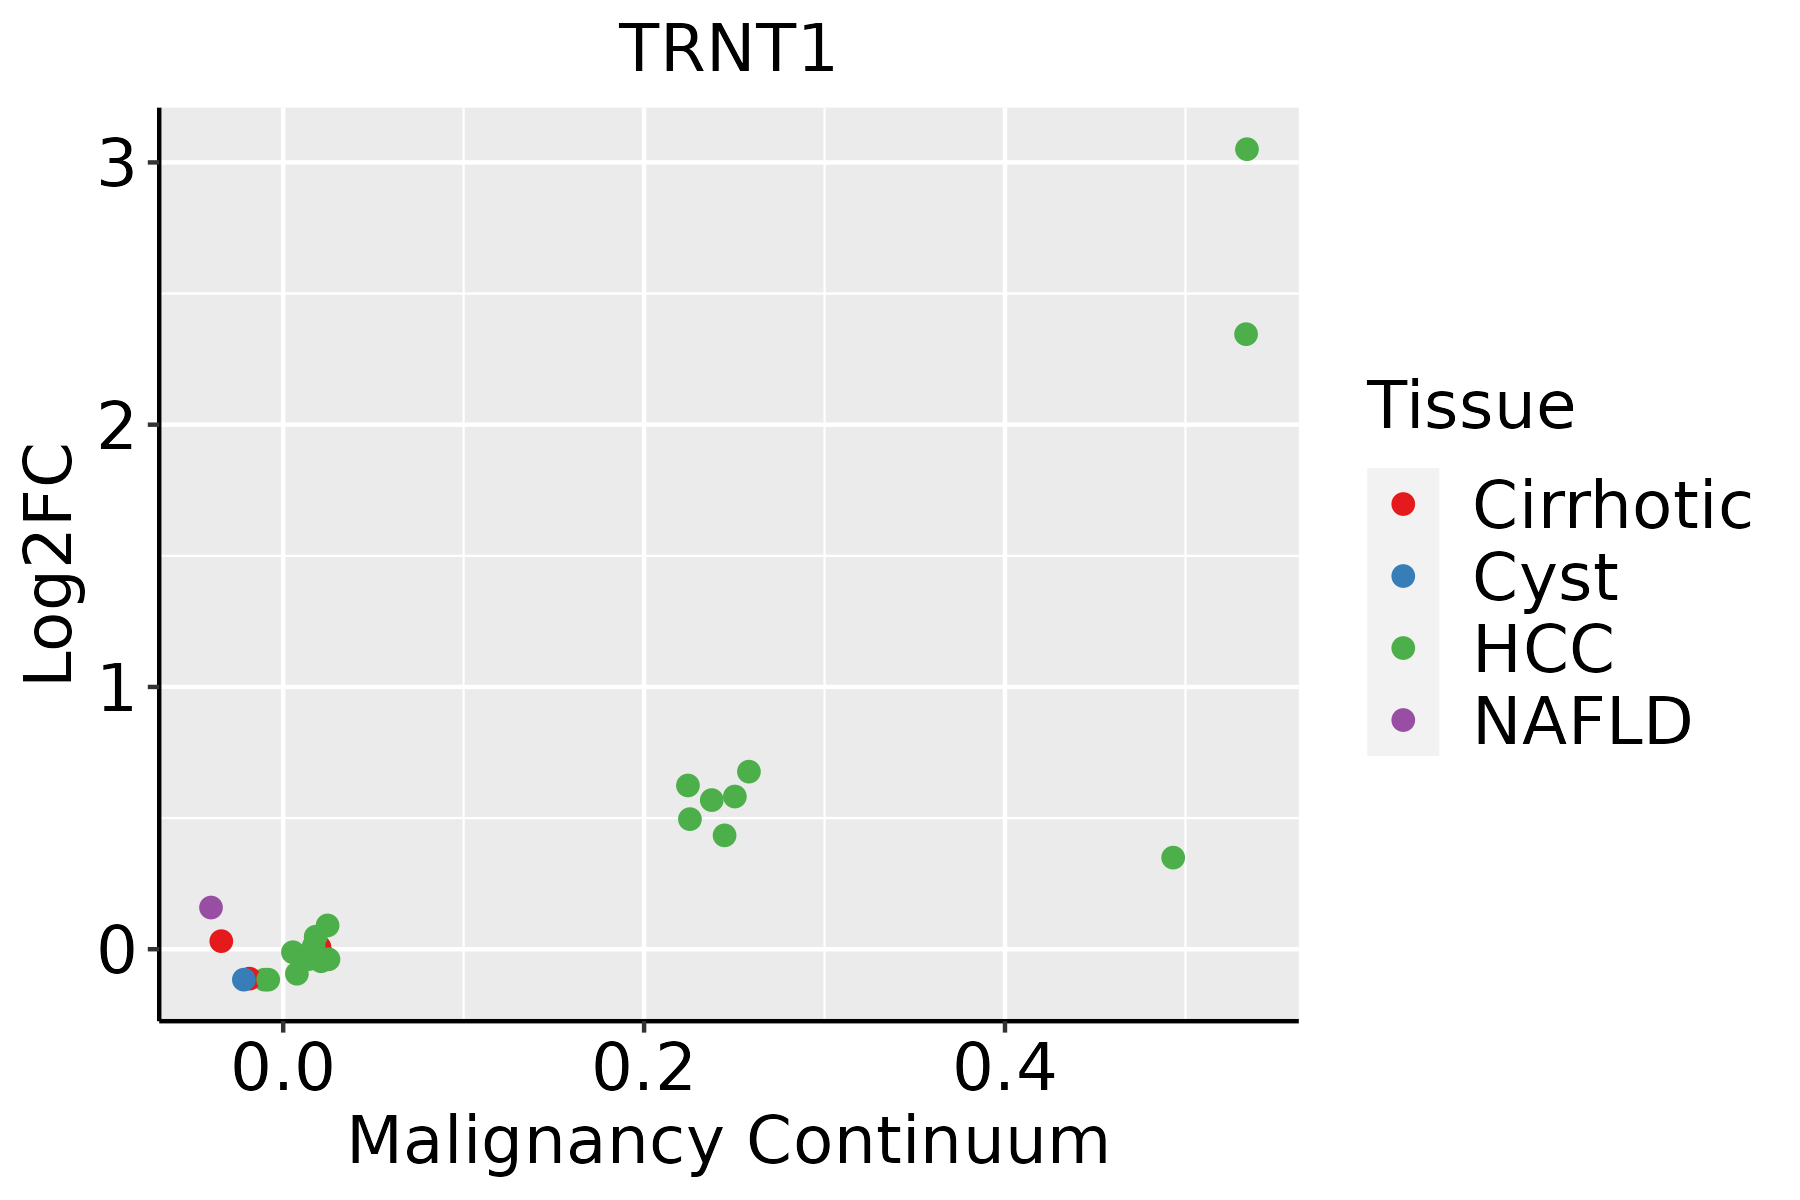 | HCC: Hepatocellular carcinoma |
| NAFLD: Non-alcoholic fatty liver disease | ||
| Thyroid | 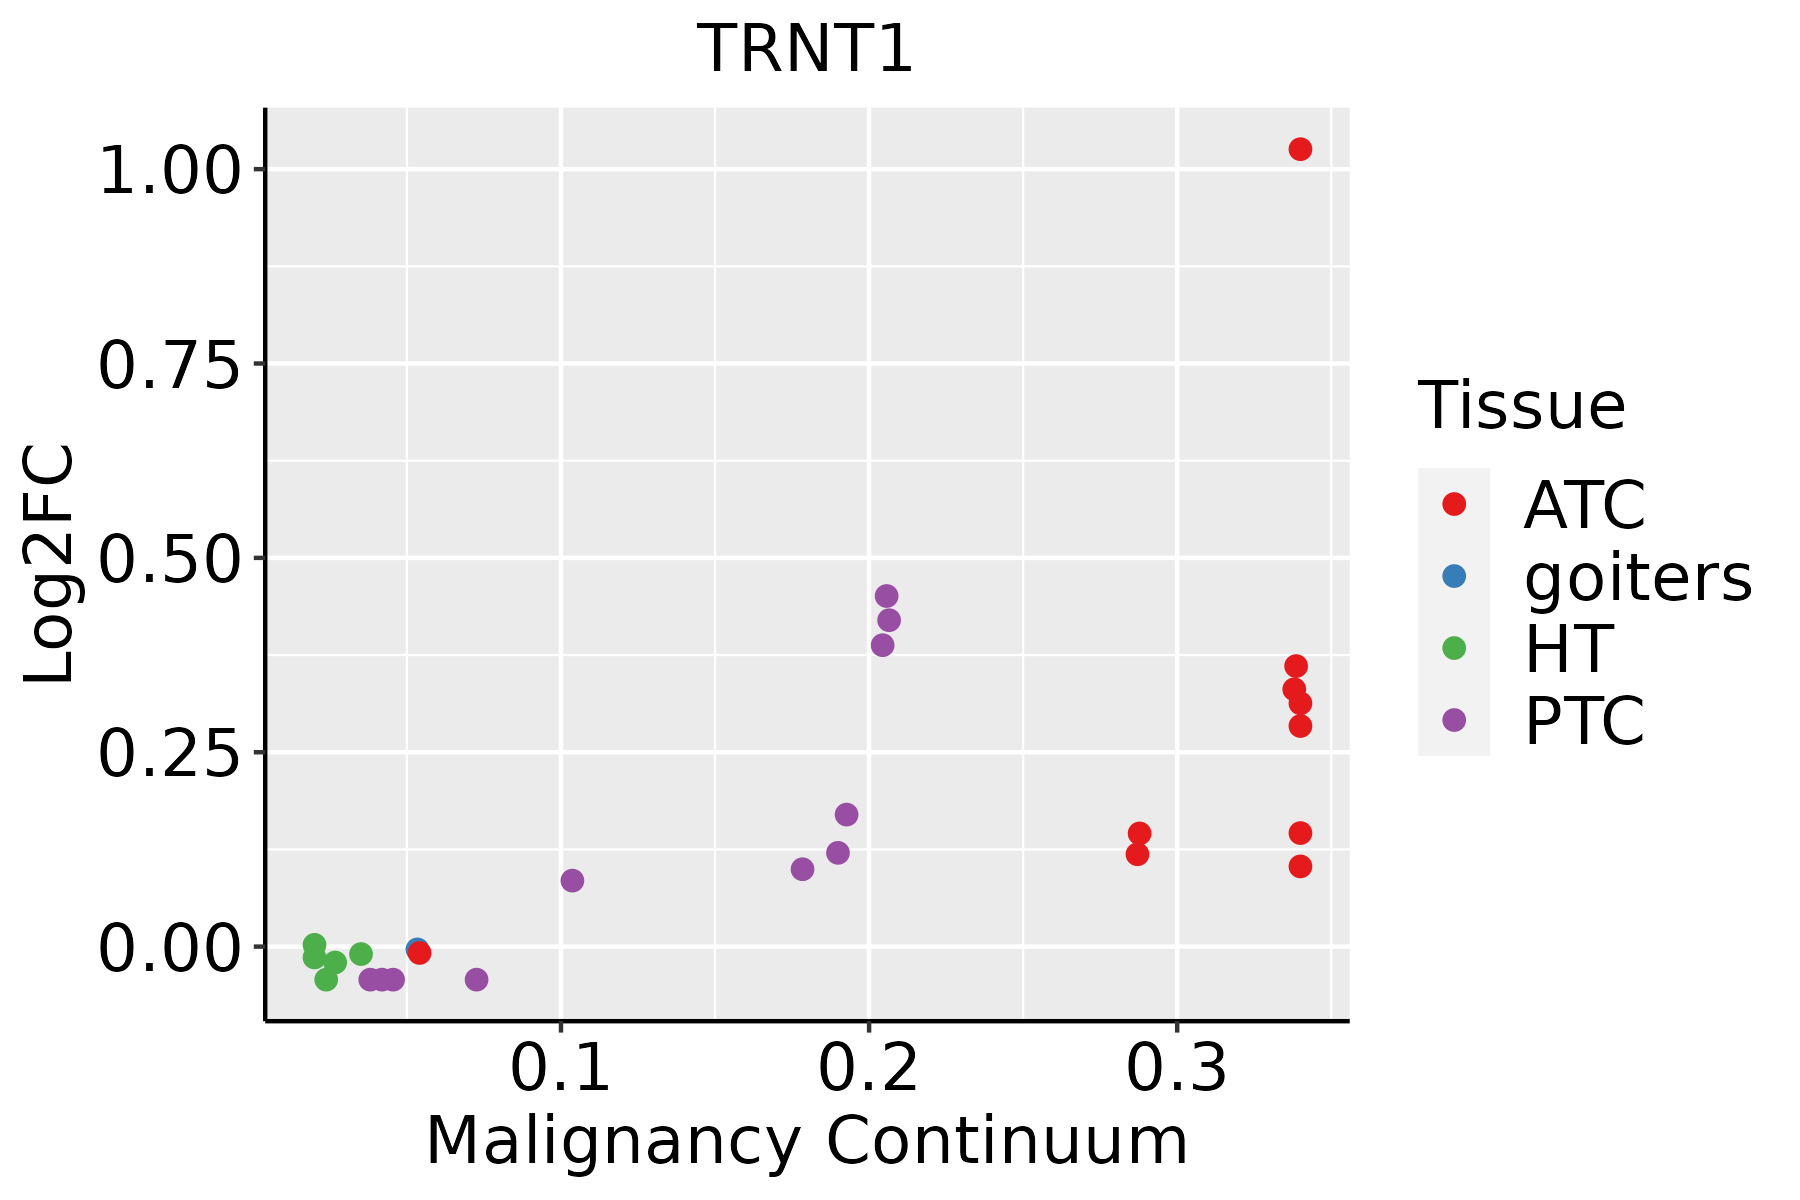 | ATC: Anaplastic thyroid cancer |
| HT: Hashimoto's thyroiditis | ||
| PTC: Papillary thyroid cancer |
| ∗log2FC in expression of this searched gene in stem-like cells from each diseased tissue sample relative to stem-like cells in normal samples in each tissue plotted against the malignancy continuum. Samples are colored based on if they are from different disease stage. |
Top |
Malignant transformation related pathway analysis |
| Find out the enriched GO biological processes and KEGG pathways involved in transition from healthy to precancer to cancer |
| Tissue | Disease Stage | Enriched GO biological Processes |
| Colorectum | AD |  |
| Colorectum | SER |  |
| Colorectum | MSS |  |
| Colorectum | MSI-H |  |
| Colorectum | FAP |  |
| ∗Top 15 enriched GO BP terms are showed in the bar plot of each disease state in each tissue. Each row represents a significant GO biological process which is colored according to the -log10(p.adjust). |
| Page: 1 2 3 4 5 6 7 8 9 |
| GO ID | Tissue | Disease Stage | Description | Gene Ratio | Bg Ratio | pvalue | p.adjust | Count |
| GO:003447015 | Esophagus | ESCC | ncRNA processing | 300/8552 | 395/18723 | 3.09e-35 | 3.26e-32 | 300 |
| GO:003466012 | Esophagus | ESCC | ncRNA metabolic process | 346/8552 | 485/18723 | 4.35e-31 | 2.51e-28 | 346 |
| GO:014005313 | Esophagus | ESCC | mitochondrial gene expression | 93/8552 | 108/18723 | 1.96e-18 | 2.03e-16 | 93 |
| GO:00080333 | Esophagus | ESCC | tRNA processing | 92/8552 | 127/18723 | 7.83e-10 | 1.93e-08 | 92 |
| GO:00063992 | Esophagus | ESCC | tRNA metabolic process | 122/8552 | 179/18723 | 9.03e-10 | 2.19e-08 | 122 |
| GO:00009592 | Esophagus | ESCC | mitochondrial RNA metabolic process | 39/8552 | 49/18723 | 1.20e-06 | 1.49e-05 | 39 |
| GO:00009631 | Esophagus | ESCC | mitochondrial RNA processing | 19/8552 | 20/18723 | 3.83e-06 | 4.14e-05 | 19 |
| GO:00311233 | Esophagus | ESCC | RNA 3'-end processing | 76/8552 | 116/18723 | 1.25e-05 | 1.15e-04 | 76 |
| GO:0090646 | Esophagus | ESCC | mitochondrial tRNA processing | 11/8552 | 12/18723 | 1.26e-03 | 6.06e-03 | 11 |
| GO:00344702 | Liver | HCC | ncRNA processing | 293/7958 | 395/18723 | 4.26e-38 | 6.76e-35 | 293 |
| GO:00346601 | Liver | HCC | ncRNA metabolic process | 332/7958 | 485/18723 | 1.48e-31 | 7.80e-29 | 332 |
| GO:01400531 | Liver | HCC | mitochondrial gene expression | 82/7958 | 108/18723 | 1.49e-12 | 7.20e-11 | 82 |
| GO:00311231 | Liver | HCC | RNA 3'-end processing | 81/7958 | 116/18723 | 2.27e-09 | 6.32e-08 | 81 |
| GO:0008033 | Liver | HCC | tRNA processing | 87/7958 | 127/18723 | 2.66e-09 | 7.23e-08 | 87 |
| GO:0006399 | Liver | HCC | tRNA metabolic process | 108/7958 | 179/18723 | 1.07e-06 | 1.59e-05 | 108 |
| GO:0000959 | Liver | HCC | mitochondrial RNA metabolic process | 30/7958 | 49/18723 | 6.31e-03 | 2.57e-02 | 30 |
| GO:003447018 | Thyroid | PTC | ncRNA processing | 215/5968 | 395/18723 | 7.14e-21 | 1.22e-18 | 215 |
| GO:00346608 | Thyroid | PTC | ncRNA metabolic process | 239/5968 | 485/18723 | 5.54e-16 | 4.26e-14 | 239 |
| GO:00311235 | Thyroid | PTC | RNA 3'-end processing | 65/5968 | 116/18723 | 6.24e-08 | 1.30e-06 | 65 |
| GO:01400536 | Thyroid | PTC | mitochondrial gene expression | 51/5968 | 108/18723 | 6.04e-04 | 3.83e-03 | 51 |
| Page: 1 2 |
| Pathway ID | Tissue | Disease Stage | Description | Gene Ratio | Bg Ratio | pvalue | p.adjust | qvalue | Count |
| Page: 1 |
Top |
Cell-cell communication analysis |
| Identification of potential cell-cell interactions between two cell types and their ligand-receptor pairs for different disease states |
| Ligand | Receptor | LRpair | Pathway | Tissue | Disease Stage |
| Page: 1 |
Top |
Single-cell gene regulatory network inference analysis |
| Find out the significant the regulons (TFs) and the target genes of each regulon across cell types for different disease states |
| TF | Cell Type | Tissue | Disease Stage | Target Gene | RSS | Regulon Activity |
| ∗The dot plots of a searched regulon are shown for all cell subpopulations in each disease state of each tissue based on the regulon specific score inferred using pySCENIC and by calculating the average expression. |
| Page: 1 |
Top |
Somatic mutation of malignant transformation related genes |
| Annotation of somatic variants for genes involved in malignant transformation |
| Hugo Symbol | Variant Class | Variant Classification | dbSNP RS | HGVSc | HGVSp | HGVSp Short | SWISSPROT | BIOTYPE | SIFT | PolyPhen | Tumor Sample Barcode | Tissue | Histology | Sex | Age | Stage | Therapy Types | Drugs | Outcome |
| TRNT1 | SNV | Missense_Mutation | c.806N>C | p.Leu269Ser | p.L269S | Q96Q11 | protein_coding | deleterious(0) | probably_damaging(0.987) | TCGA-A8-A094-01 | Breast | breast invasive carcinoma | Female | >=65 | I/II | Unknown | Unknown | SD | |
| TRNT1 | SNV | Missense_Mutation | novel | c.856N>A | p.Asp286Asn | p.D286N | Q96Q11 | protein_coding | tolerated(0.62) | benign(0) | TCGA-AC-A3BB-01 | Breast | breast invasive carcinoma | Female | <65 | III/IV | Chemotherapy | cytoxan | CR |
| TRNT1 | SNV | Missense_Mutation | c.817N>A | p.Ala273Thr | p.A273T | Q96Q11 | protein_coding | tolerated(0.16) | benign(0.001) | TCGA-D8-A1XK-01 | Breast | breast invasive carcinoma | Female | <65 | I/II | Chemotherapy | doxorubicine+cyclophosphamide | SD | |
| TRNT1 | SNV | Missense_Mutation | rs757405730 | c.947N>T | p.Ala316Val | p.A316V | Q96Q11 | protein_coding | deleterious(0) | benign(0.003) | TCGA-A6-2679-01 | Colorectum | colon adenocarcinoma | Female | >=65 | I/II | Unknown | Unknown | SD |
| TRNT1 | SNV | Missense_Mutation | c.337G>A | p.Ala113Thr | p.A113T | Q96Q11 | protein_coding | deleterious(0.03) | possibly_damaging(0.827) | TCGA-AA-A010-01 | Colorectum | colon adenocarcinoma | Female | <65 | I/II | Chemotherapy | folinic | CR | |
| TRNT1 | SNV | Missense_Mutation | novel | c.1101N>T | p.Lys367Asn | p.K367N | Q96Q11 | protein_coding | deleterious(0.01) | possibly_damaging(0.518) | TCGA-AM-5820-01 | Colorectum | colon adenocarcinoma | Female | <65 | I/II | Unknown | Unknown | SD |
| TRNT1 | SNV | Missense_Mutation | rs759826831 | c.295N>T | p.Arg99Trp | p.R99W | Q96Q11 | protein_coding | deleterious(0) | probably_damaging(0.999) | TCGA-CA-6717-01 | Colorectum | colon adenocarcinoma | Male | <65 | I/II | Chemotherapy | oxaliplatin | CR |
| TRNT1 | SNV | Missense_Mutation | c.454N>T | p.Asp152Tyr | p.D152Y | Q96Q11 | protein_coding | deleterious(0) | probably_damaging(1) | TCGA-F5-6814-01 | Colorectum | rectum adenocarcinoma | Male | <65 | I/II | Unknown | Unknown | SD | |
| TRNT1 | insertion | In_Frame_Ins | novel | c.1100_1101insAACATACAC | p.Lys367_Tyr368insThrTyrThr | p.K367_Y368insTYT | Q96Q11 | protein_coding | TCGA-AM-5820-01 | Colorectum | colon adenocarcinoma | Female | <65 | I/II | Unknown | Unknown | SD | ||
| TRNT1 | deletion | Frame_Shift_Del | c.1246delN | p.Ser418ValfsTer11 | p.S418Vfs*11 | Q96Q11 | protein_coding | TCGA-D5-6540-01 | Colorectum | colon adenocarcinoma | Male | >=65 | I/II | Unknown | Unknown | SD |
| Page: 1 2 3 4 5 6 |
Top |
Related drugs of malignant transformation related genes |
| Identification of chemicals and drugs interact with genes involved in malignant transfromation |
| (DGIdb 4.0) |
| Entrez ID | Symbol | Category | Interaction Types | Drug Claim Name | Drug Name | PMIDs |
| Page: 1 |

Copyright 2023-Present -The University of Texas Health Science Center at Houston |