
|
|||||
|
 | |
| |
| |
| |
| |
| |
|
Gene: TRNAU1AP |
Gene summary for TRNAU1AP |
| Gene information | Species | Human | Gene symbol | TRNAU1AP | Gene ID | 54952 |
| Gene name | tRNA selenocysteine 1 associated protein 1 | |
| Gene Alias | PRO1902 | |
| Cytomap | 1p35.3 | |
| Gene Type | protein-coding | GO ID | GO:0001514 | UniProtAcc | Q9NX07 |
Top |
Malignant transformation analysis |
| Identification of the aberrant gene expression in precancerous and cancerous lesions by comparing the gene expression of stem-like cells in diseased tissues with normal stem cells |
| Entrez ID | Symbol | Replicates | Species | Organ | Tissue | Adj P-value | Log2FC | Malignancy |
| 54952 | TRNAU1AP | LZE2T | Human | Esophagus | ESCC | 4.53e-02 | 2.30e-01 | 0.082 |
| 54952 | TRNAU1AP | LZE4T | Human | Esophagus | ESCC | 2.19e-09 | 2.21e-01 | 0.0811 |
| 54952 | TRNAU1AP | LZE5T | Human | Esophagus | ESCC | 5.87e-04 | 1.73e-01 | 0.0514 |
| 54952 | TRNAU1AP | LZE7T | Human | Esophagus | ESCC | 3.77e-12 | 5.27e-01 | 0.0667 |
| 54952 | TRNAU1AP | LZE8T | Human | Esophagus | ESCC | 7.90e-20 | 3.27e-01 | 0.067 |
| 54952 | TRNAU1AP | LZE20T | Human | Esophagus | ESCC | 9.06e-07 | 3.49e-01 | 0.0662 |
| 54952 | TRNAU1AP | LZE22D1 | Human | Esophagus | HGIN | 1.71e-02 | 1.22e-01 | 0.0595 |
| 54952 | TRNAU1AP | LZE22T | Human | Esophagus | ESCC | 5.48e-04 | 4.36e-01 | 0.068 |
| 54952 | TRNAU1AP | LZE24T | Human | Esophagus | ESCC | 5.60e-15 | 3.66e-01 | 0.0596 |
| 54952 | TRNAU1AP | LZE21T | Human | Esophagus | ESCC | 5.12e-06 | 2.87e-01 | 0.0655 |
| 54952 | TRNAU1AP | LZE6T | Human | Esophagus | ESCC | 6.25e-09 | 3.04e-01 | 0.0845 |
| 54952 | TRNAU1AP | P1T-E | Human | Esophagus | ESCC | 5.65e-11 | 5.92e-01 | 0.0875 |
| 54952 | TRNAU1AP | P2T-E | Human | Esophagus | ESCC | 1.42e-32 | 6.68e-01 | 0.1177 |
| 54952 | TRNAU1AP | P4T-E | Human | Esophagus | ESCC | 4.44e-22 | 4.35e-01 | 0.1323 |
| 54952 | TRNAU1AP | P5T-E | Human | Esophagus | ESCC | 1.38e-36 | 6.27e-01 | 0.1327 |
| 54952 | TRNAU1AP | P8T-E | Human | Esophagus | ESCC | 5.54e-17 | 3.39e-01 | 0.0889 |
| 54952 | TRNAU1AP | P9T-E | Human | Esophagus | ESCC | 4.41e-15 | 2.18e-01 | 0.1131 |
| 54952 | TRNAU1AP | P10T-E | Human | Esophagus | ESCC | 8.66e-37 | 5.93e-01 | 0.116 |
| 54952 | TRNAU1AP | P11T-E | Human | Esophagus | ESCC | 3.12e-09 | 4.48e-01 | 0.1426 |
| 54952 | TRNAU1AP | P12T-E | Human | Esophagus | ESCC | 5.11e-25 | 4.66e-01 | 0.1122 |
| Page: 1 2 3 4 5 6 |
| Tissue | Expression Dynamics | Abbreviation |
| Esophagus |  | ESCC: Esophageal squamous cell carcinoma |
| HGIN: High-grade intraepithelial neoplasias | ||
| LGIN: Low-grade intraepithelial neoplasias | ||
| Liver |  | HCC: Hepatocellular carcinoma |
| NAFLD: Non-alcoholic fatty liver disease | ||
| Oral Cavity | 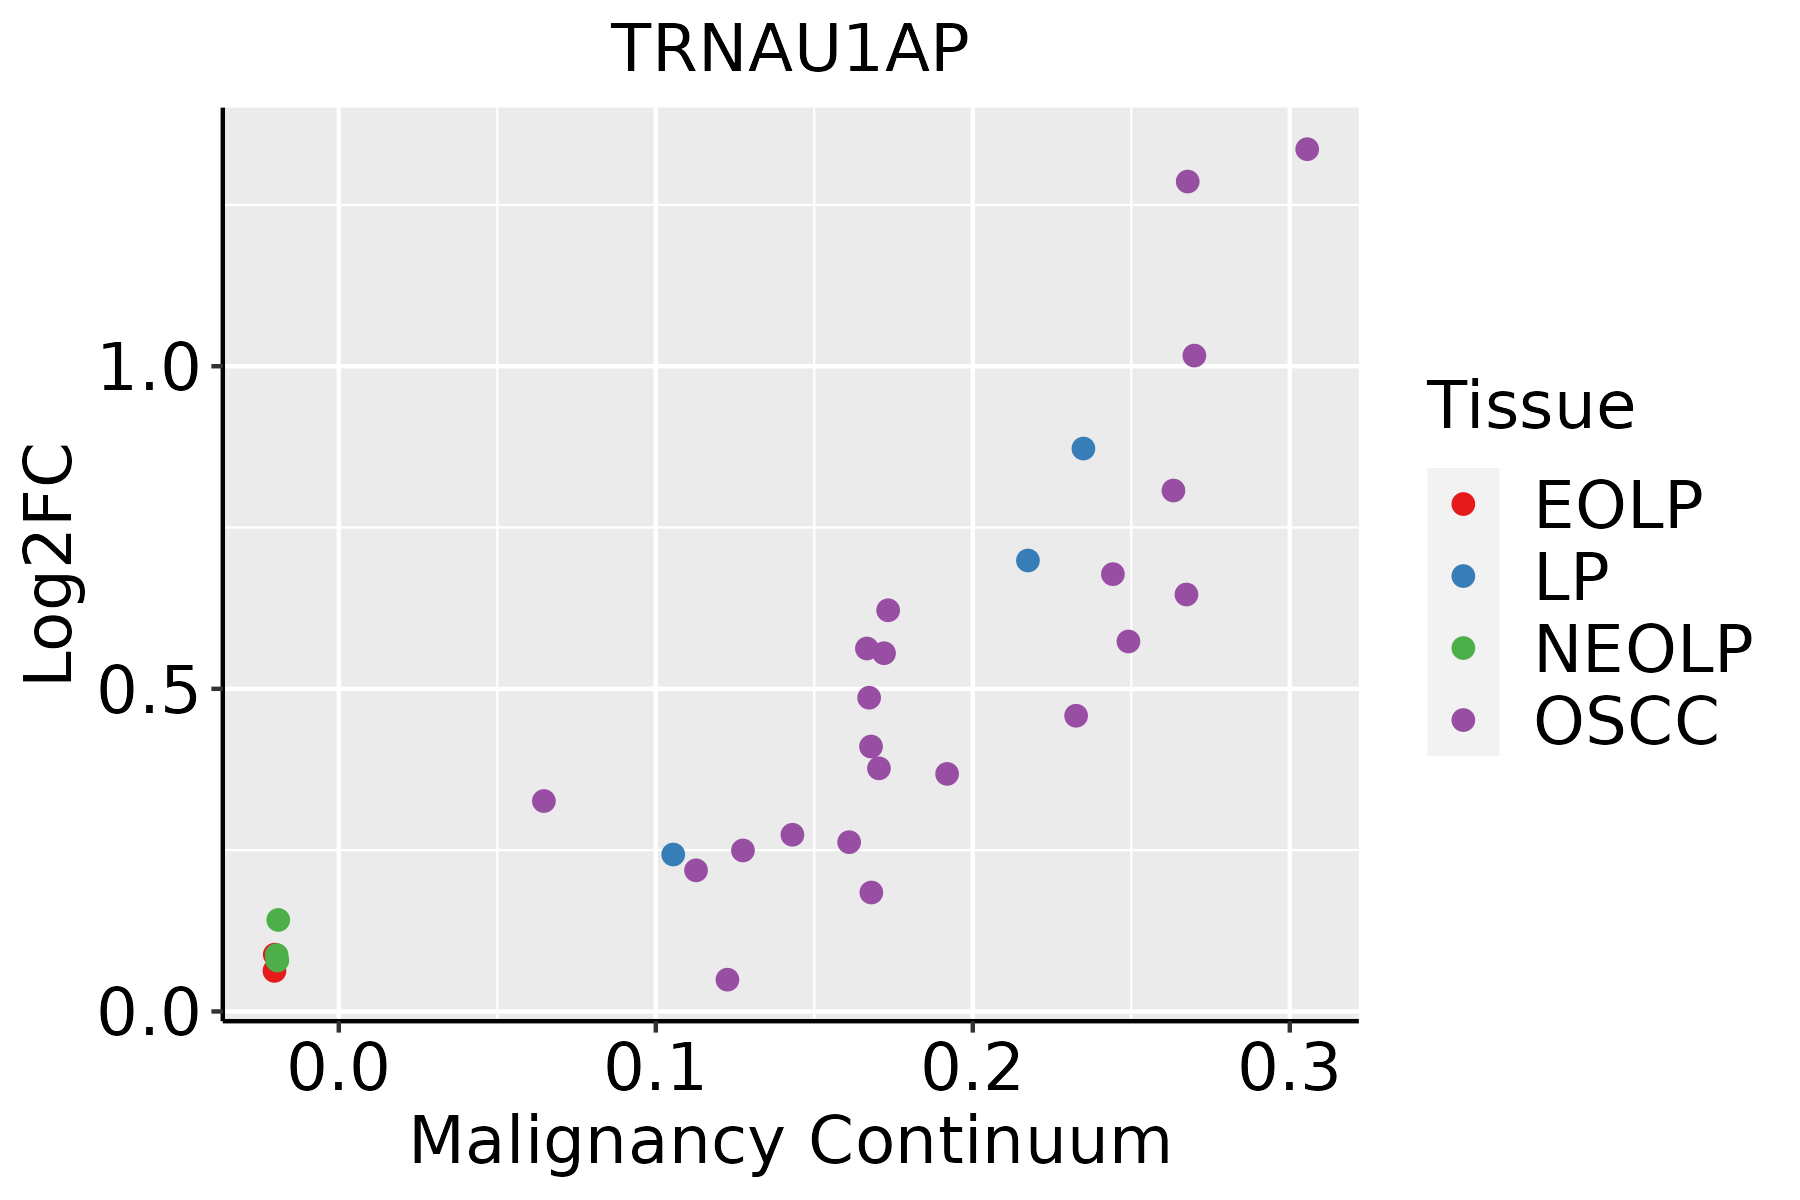 | EOLP: Erosive Oral lichen planus |
| LP: leukoplakia | ||
| NEOLP: Non-erosive oral lichen planus | ||
| OSCC: Oral squamous cell carcinoma | ||
| Skin |  | AK: Actinic keratosis |
| cSCC: Cutaneous squamous cell carcinoma | ||
| SCCIS:squamous cell carcinoma in situ | ||
| Thyroid | 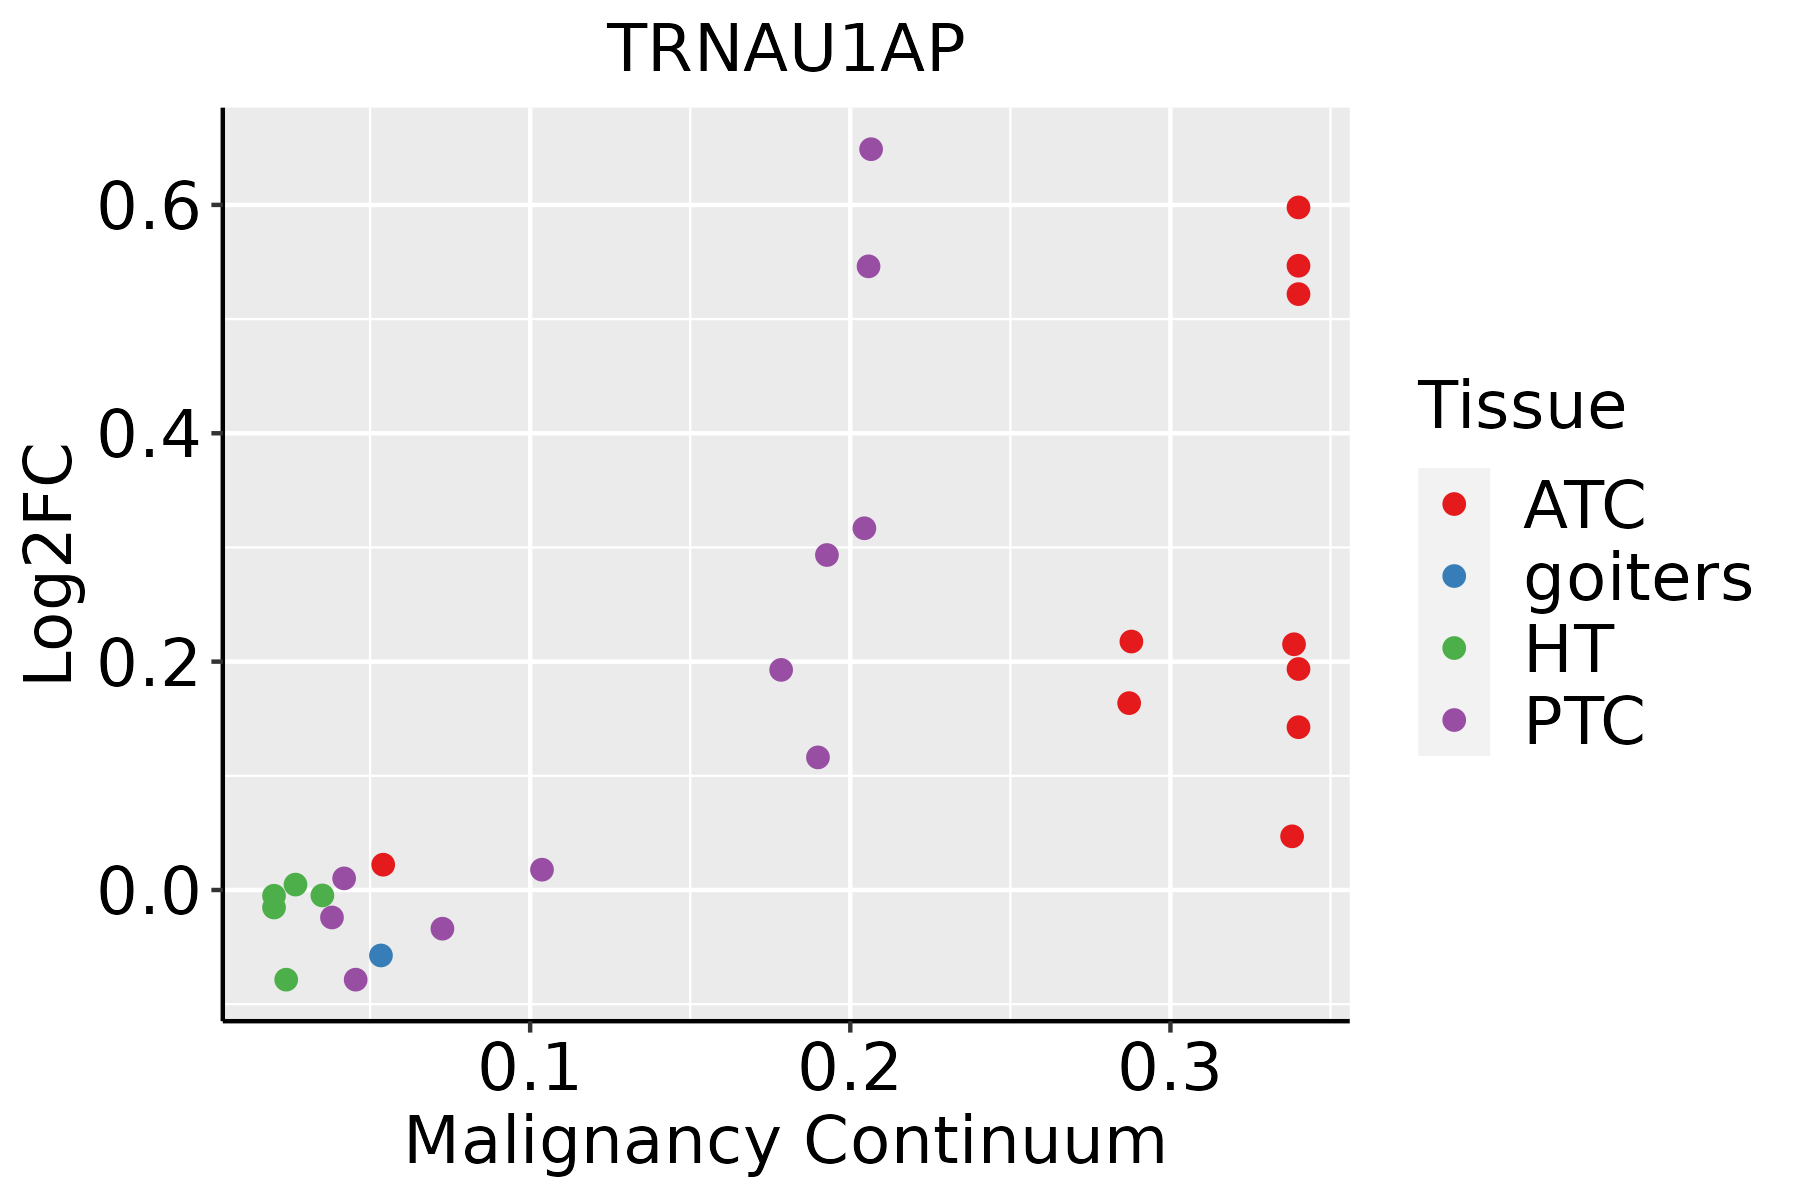 | ATC: Anaplastic thyroid cancer |
| HT: Hashimoto's thyroiditis | ||
| PTC: Papillary thyroid cancer |
| ∗log2FC in expression of this searched gene in stem-like cells from each diseased tissue sample relative to stem-like cells in normal samples in each tissue plotted against the malignancy continuum. Samples are colored based on if they are from different disease stage. |
Top |
Malignant transformation related pathway analysis |
| Find out the enriched GO biological processes and KEGG pathways involved in transition from healthy to precancer to cancer |
| Tissue | Disease Stage | Enriched GO biological Processes |
| Colorectum | AD |  |
| Colorectum | SER |  |
| Colorectum | MSS |  |
| Colorectum | MSI-H |  |
| Colorectum | FAP |  |
| ∗Top 15 enriched GO BP terms are showed in the bar plot of each disease state in each tissue. Each row represents a significant GO biological process which is colored according to the -log10(p.adjust). |
| Page: 1 2 3 4 5 6 7 8 9 |
| GO ID | Tissue | Disease Stage | Description | Gene Ratio | Bg Ratio | pvalue | p.adjust | Count |
| GO:000641727 | Esophagus | HGIN | regulation of translation | 139/2587 | 468/18723 | 1.46e-19 | 7.98e-17 | 139 |
| GO:000641418 | Esophagus | HGIN | translational elongation | 22/2587 | 55/18723 | 1.46e-06 | 5.56e-05 | 22 |
| GO:0006417111 | Esophagus | ESCC | regulation of translation | 304/8552 | 468/18723 | 1.53e-17 | 1.33e-15 | 304 |
| GO:000641419 | Esophagus | ESCC | translational elongation | 41/8552 | 55/18723 | 1.26e-05 | 1.16e-04 | 41 |
| GO:000641712 | Liver | Cirrhotic | regulation of translation | 194/4634 | 468/18723 | 7.28e-16 | 8.79e-14 | 194 |
| GO:000641722 | Liver | HCC | regulation of translation | 287/7958 | 468/18723 | 8.79e-17 | 8.08e-15 | 287 |
| GO:000641412 | Liver | HCC | translational elongation | 36/7958 | 55/18723 | 4.94e-04 | 3.23e-03 | 36 |
| GO:000641720 | Oral cavity | OSCC | regulation of translation | 274/7305 | 468/18723 | 4.39e-18 | 4.63e-16 | 274 |
| GO:000641416 | Oral cavity | OSCC | translational elongation | 37/7305 | 55/18723 | 2.03e-05 | 1.94e-04 | 37 |
| GO:0006417110 | Oral cavity | LP | regulation of translation | 175/4623 | 468/18723 | 4.49e-10 | 2.22e-08 | 175 |
| GO:000641417 | Oral cavity | LP | translational elongation | 25/4623 | 55/18723 | 6.27e-04 | 5.71e-03 | 25 |
| GO:000641729 | Skin | cSCC | regulation of translation | 226/4864 | 468/18723 | 8.78e-26 | 2.62e-23 | 226 |
| GO:000641423 | Skin | cSCC | translational elongation | 30/4864 | 55/18723 | 6.13e-06 | 8.70e-05 | 30 |
| GO:0006417113 | Thyroid | PTC | regulation of translation | 236/5968 | 468/18723 | 2.70e-17 | 2.52e-15 | 236 |
| GO:000641735 | Thyroid | ATC | regulation of translation | 236/6293 | 468/18723 | 2.39e-14 | 1.34e-12 | 236 |
| Page: 1 |
| Pathway ID | Tissue | Disease Stage | Description | Gene Ratio | Bg Ratio | pvalue | p.adjust | qvalue | Count |
| Page: 1 |
Top |
Cell-cell communication analysis |
| Identification of potential cell-cell interactions between two cell types and their ligand-receptor pairs for different disease states |
| Ligand | Receptor | LRpair | Pathway | Tissue | Disease Stage |
| Page: 1 |
Top |
Single-cell gene regulatory network inference analysis |
| Find out the significant the regulons (TFs) and the target genes of each regulon across cell types for different disease states |
| TF | Cell Type | Tissue | Disease Stage | Target Gene | RSS | Regulon Activity |
| ∗The dot plots of a searched regulon are shown for all cell subpopulations in each disease state of each tissue based on the regulon specific score inferred using pySCENIC and by calculating the average expression. |
| Page: 1 |
Top |
Somatic mutation of malignant transformation related genes |
| Annotation of somatic variants for genes involved in malignant transformation |
| Hugo Symbol | Variant Class | Variant Classification | dbSNP RS | HGVSc | HGVSp | HGVSp Short | SWISSPROT | BIOTYPE | SIFT | PolyPhen | Tumor Sample Barcode | Tissue | Histology | Sex | Age | Stage | Therapy Types | Drugs | Outcome |
| TRNAU1AP | SNV | Missense_Mutation | c.505C>T | p.Arg169Trp | p.R169W | Q9NX07 | protein_coding | deleterious(0) | probably_damaging(0.98) | TCGA-BH-A18G-01 | Breast | breast invasive carcinoma | Female | >=65 | I/II | Unknown | Unknown | SD | |
| TRNAU1AP | insertion | Nonsense_Mutation | novel | c.667_668insAAAAAAAAAAAGAAAAAAGAAAAA | p.Tyr223delinsTer | p.Y223delins* | Q9NX07 | protein_coding | TCGA-A2-A0CQ-01 | Breast | breast invasive carcinoma | Female | <65 | I/II | Chemotherapy | adriamycin | SD | ||
| TRNAU1AP | insertion | Frame_Shift_Ins | novel | c.715_716insCCCAGTGGCTCACACCTGT | p.Asp239AlafsTer20 | p.D239Afs*20 | Q9NX07 | protein_coding | TCGA-AN-A0AK-01 | Breast | breast invasive carcinoma | Female | >=65 | I/II | Unknown | Unknown | SD | ||
| TRNAU1AP | SNV | Missense_Mutation | novel | c.544C>T | p.Pro182Ser | p.P182S | Q9NX07 | protein_coding | tolerated(0.37) | benign(0) | TCGA-2W-A8YY-01 | Cervix | cervical & endocervical cancer | Female | <65 | I/II | Chemotherapy | cisplatin | CR |
| TRNAU1AP | SNV | Missense_Mutation | c.581A>C | p.Asn194Thr | p.N194T | Q9NX07 | protein_coding | tolerated(0.1) | benign(0.039) | TCGA-C5-A2LX-01 | Cervix | cervical & endocervical cancer | Female | <65 | I/II | Chemotherapy | cisplatin | SD | |
| TRNAU1AP | SNV | Missense_Mutation | c.784G>A | p.Glu262Lys | p.E262K | Q9NX07 | protein_coding | deleterious(0) | probably_damaging(0.994) | TCGA-IR-A3LK-01 | Cervix | cervical & endocervical cancer | Female | >=65 | I/II | Chemotherapy | cisplatin | PD | |
| TRNAU1AP | SNV | Missense_Mutation | rs772628492 | c.530C>T | p.Ala177Val | p.A177V | Q9NX07 | protein_coding | tolerated(0.25) | benign(0) | TCGA-UC-A7PG-06 | Cervix | cervical & endocervical cancer | Female | <65 | III/IV | Chemotherapy | cisplatin | PD |
| TRNAU1AP | SNV | Missense_Mutation | rs752773020 | c.319G>A | p.Val107Met | p.V107M | Q9NX07 | protein_coding | tolerated(0.08) | possibly_damaging(0.488) | TCGA-VS-A9U6-01 | Cervix | cervical & endocervical cancer | Female | <65 | I/II | Chemotherapy | cisplatin | PD |
| TRNAU1AP | SNV | Missense_Mutation | rs140349108 | c.349N>A | p.Val117Ile | p.V117I | Q9NX07 | protein_coding | tolerated(0.38) | benign(0.006) | TCGA-A6-2672-01 | Colorectum | colon adenocarcinoma | Female | >=65 | III/IV | Unknown | Unknown | SD |
| TRNAU1AP | SNV | Missense_Mutation | novel | c.313N>T | p.Pro105Ser | p.P105S | Q9NX07 | protein_coding | tolerated(0.29) | benign(0.014) | TCGA-AA-A029-01 | Colorectum | colon adenocarcinoma | Male | >=65 | I/II | Unknown | Unknown | SD |
| Page: 1 2 3 |
Top |
Related drugs of malignant transformation related genes |
| Identification of chemicals and drugs interact with genes involved in malignant transfromation |
| (DGIdb 4.0) |
| Entrez ID | Symbol | Category | Interaction Types | Drug Claim Name | Drug Name | PMIDs |
| Page: 1 |

Copyright 2023-Present -The University of Texas Health Science Center at Houston |