
|
|||||
|
 | |
| |
| |
| |
| |
| |
|
Gene: TRMT61B |
Gene summary for TRMT61B |
| Gene information | Species | Human | Gene symbol | TRMT61B | Gene ID | 55006 |
| Gene name | tRNA methyltransferase 61B | |
| Gene Alias | TRMT61B | |
| Cytomap | 2p23.2 | |
| Gene Type | protein-coding | GO ID | GO:0000154 | UniProtAcc | Q9BVS5 |
Top |
Malignant transformation analysis |
| Identification of the aberrant gene expression in precancerous and cancerous lesions by comparing the gene expression of stem-like cells in diseased tissues with normal stem cells |
| Entrez ID | Symbol | Replicates | Species | Organ | Tissue | Adj P-value | Log2FC | Malignancy |
| 55006 | TRMT61B | LZE4T | Human | Esophagus | ESCC | 2.34e-13 | 3.52e-01 | 0.0811 |
| 55006 | TRMT61B | LZE7T | Human | Esophagus | ESCC | 2.07e-06 | 4.26e-01 | 0.0667 |
| 55006 | TRMT61B | LZE8T | Human | Esophagus | ESCC | 3.81e-06 | 9.85e-02 | 0.067 |
| 55006 | TRMT61B | LZE20T | Human | Esophagus | ESCC | 3.16e-02 | 8.46e-02 | 0.0662 |
| 55006 | TRMT61B | LZE22T | Human | Esophagus | ESCC | 3.49e-03 | 3.09e-01 | 0.068 |
| 55006 | TRMT61B | LZE24T | Human | Esophagus | ESCC | 1.98e-12 | 3.35e-01 | 0.0596 |
| 55006 | TRMT61B | LZE21T | Human | Esophagus | ESCC | 2.54e-03 | 3.28e-01 | 0.0655 |
| 55006 | TRMT61B | LZE6T | Human | Esophagus | ESCC | 1.77e-03 | 2.60e-01 | 0.0845 |
| 55006 | TRMT61B | P1T-E | Human | Esophagus | ESCC | 3.67e-08 | 2.68e-01 | 0.0875 |
| 55006 | TRMT61B | P2T-E | Human | Esophagus | ESCC | 4.80e-34 | 6.51e-01 | 0.1177 |
| 55006 | TRMT61B | P4T-E | Human | Esophagus | ESCC | 3.46e-23 | 4.12e-01 | 0.1323 |
| 55006 | TRMT61B | P5T-E | Human | Esophagus | ESCC | 1.60e-15 | 2.11e-01 | 0.1327 |
| 55006 | TRMT61B | P8T-E | Human | Esophagus | ESCC | 3.87e-18 | 2.19e-01 | 0.0889 |
| 55006 | TRMT61B | P9T-E | Human | Esophagus | ESCC | 1.83e-15 | 2.82e-01 | 0.1131 |
| 55006 | TRMT61B | P10T-E | Human | Esophagus | ESCC | 2.33e-19 | 3.85e-01 | 0.116 |
| 55006 | TRMT61B | P11T-E | Human | Esophagus | ESCC | 2.57e-11 | 4.10e-01 | 0.1426 |
| 55006 | TRMT61B | P12T-E | Human | Esophagus | ESCC | 8.10e-24 | 4.38e-01 | 0.1122 |
| 55006 | TRMT61B | P15T-E | Human | Esophagus | ESCC | 1.30e-19 | 3.35e-01 | 0.1149 |
| 55006 | TRMT61B | P16T-E | Human | Esophagus | ESCC | 5.87e-25 | 3.46e-01 | 0.1153 |
| 55006 | TRMT61B | P17T-E | Human | Esophagus | ESCC | 3.03e-06 | 1.74e-01 | 0.1278 |
| Page: 1 2 3 4 5 |
| Tissue | Expression Dynamics | Abbreviation |
| Esophagus | 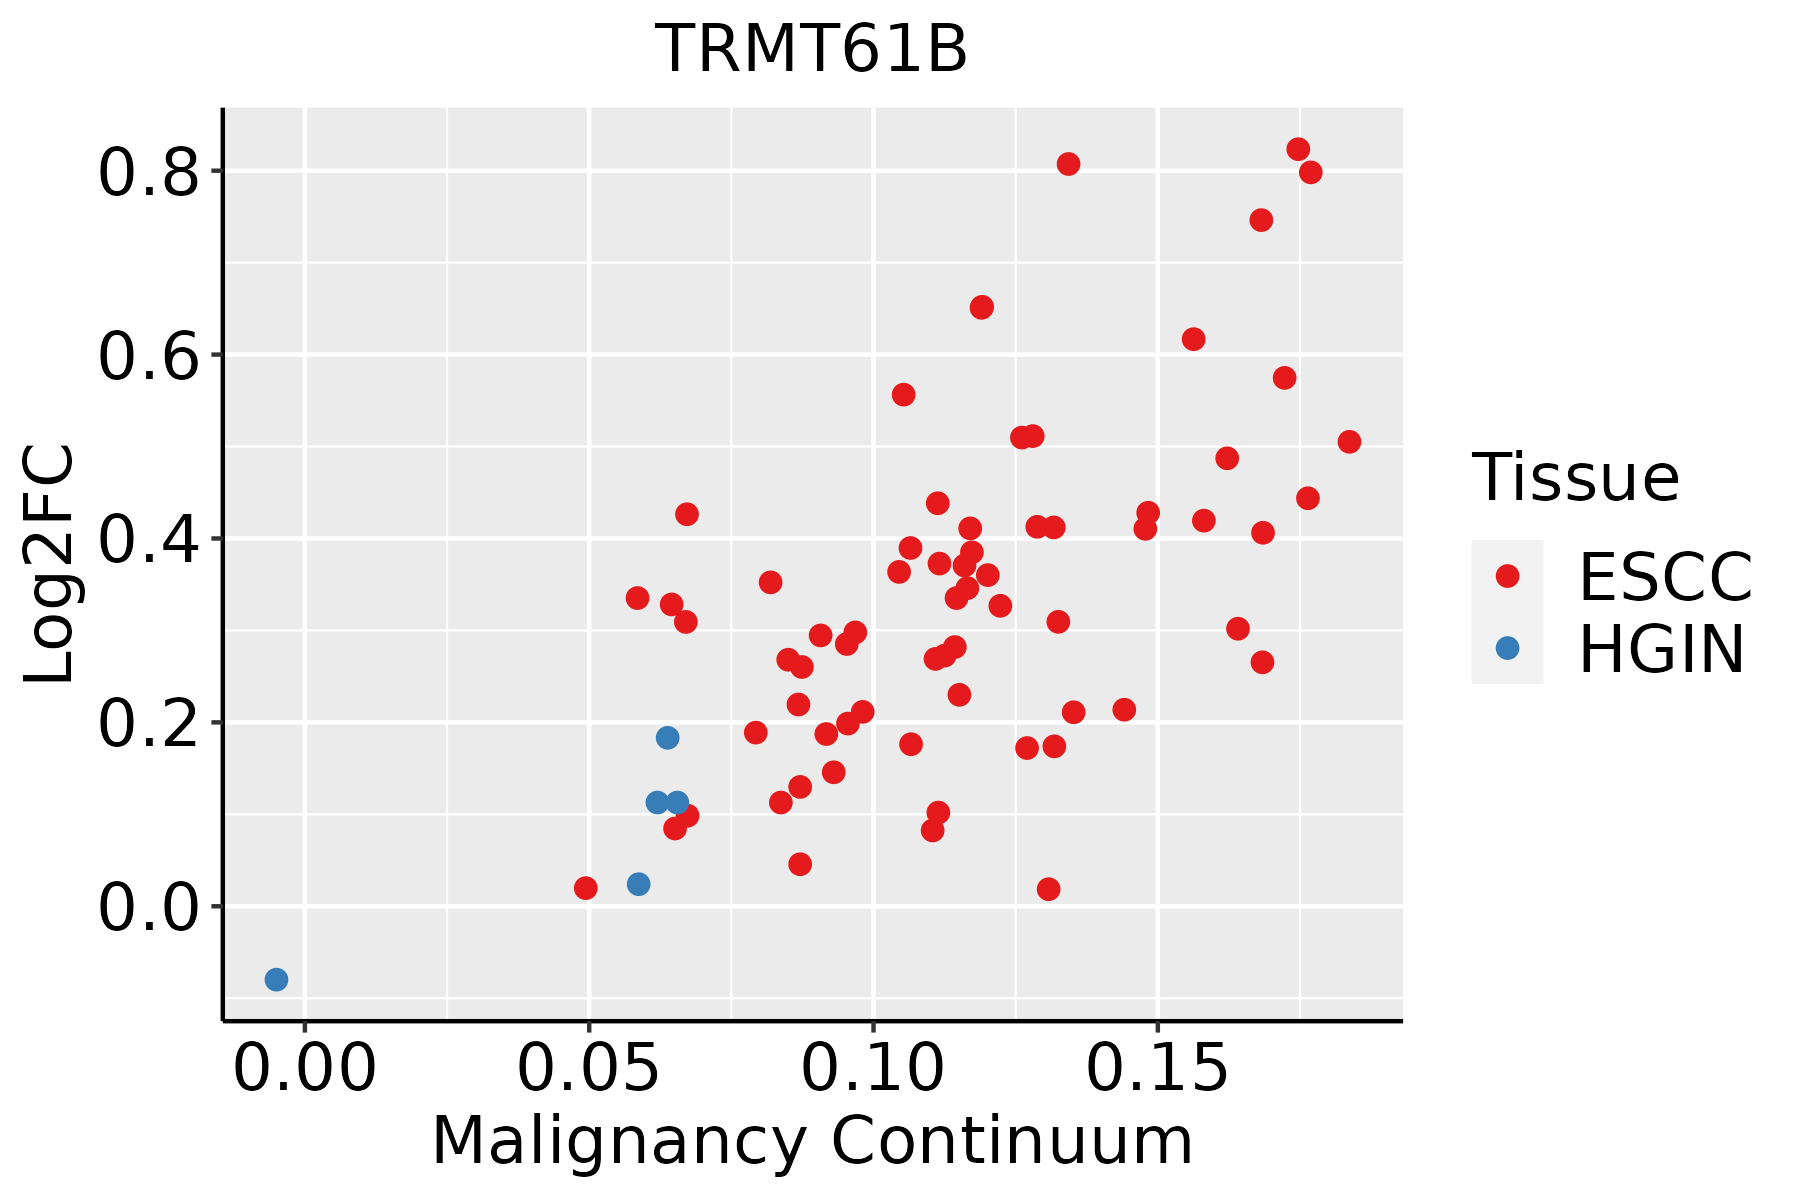 | ESCC: Esophageal squamous cell carcinoma |
| HGIN: High-grade intraepithelial neoplasias | ||
| LGIN: Low-grade intraepithelial neoplasias | ||
| Liver |  | HCC: Hepatocellular carcinoma |
| NAFLD: Non-alcoholic fatty liver disease | ||
| Oral Cavity | 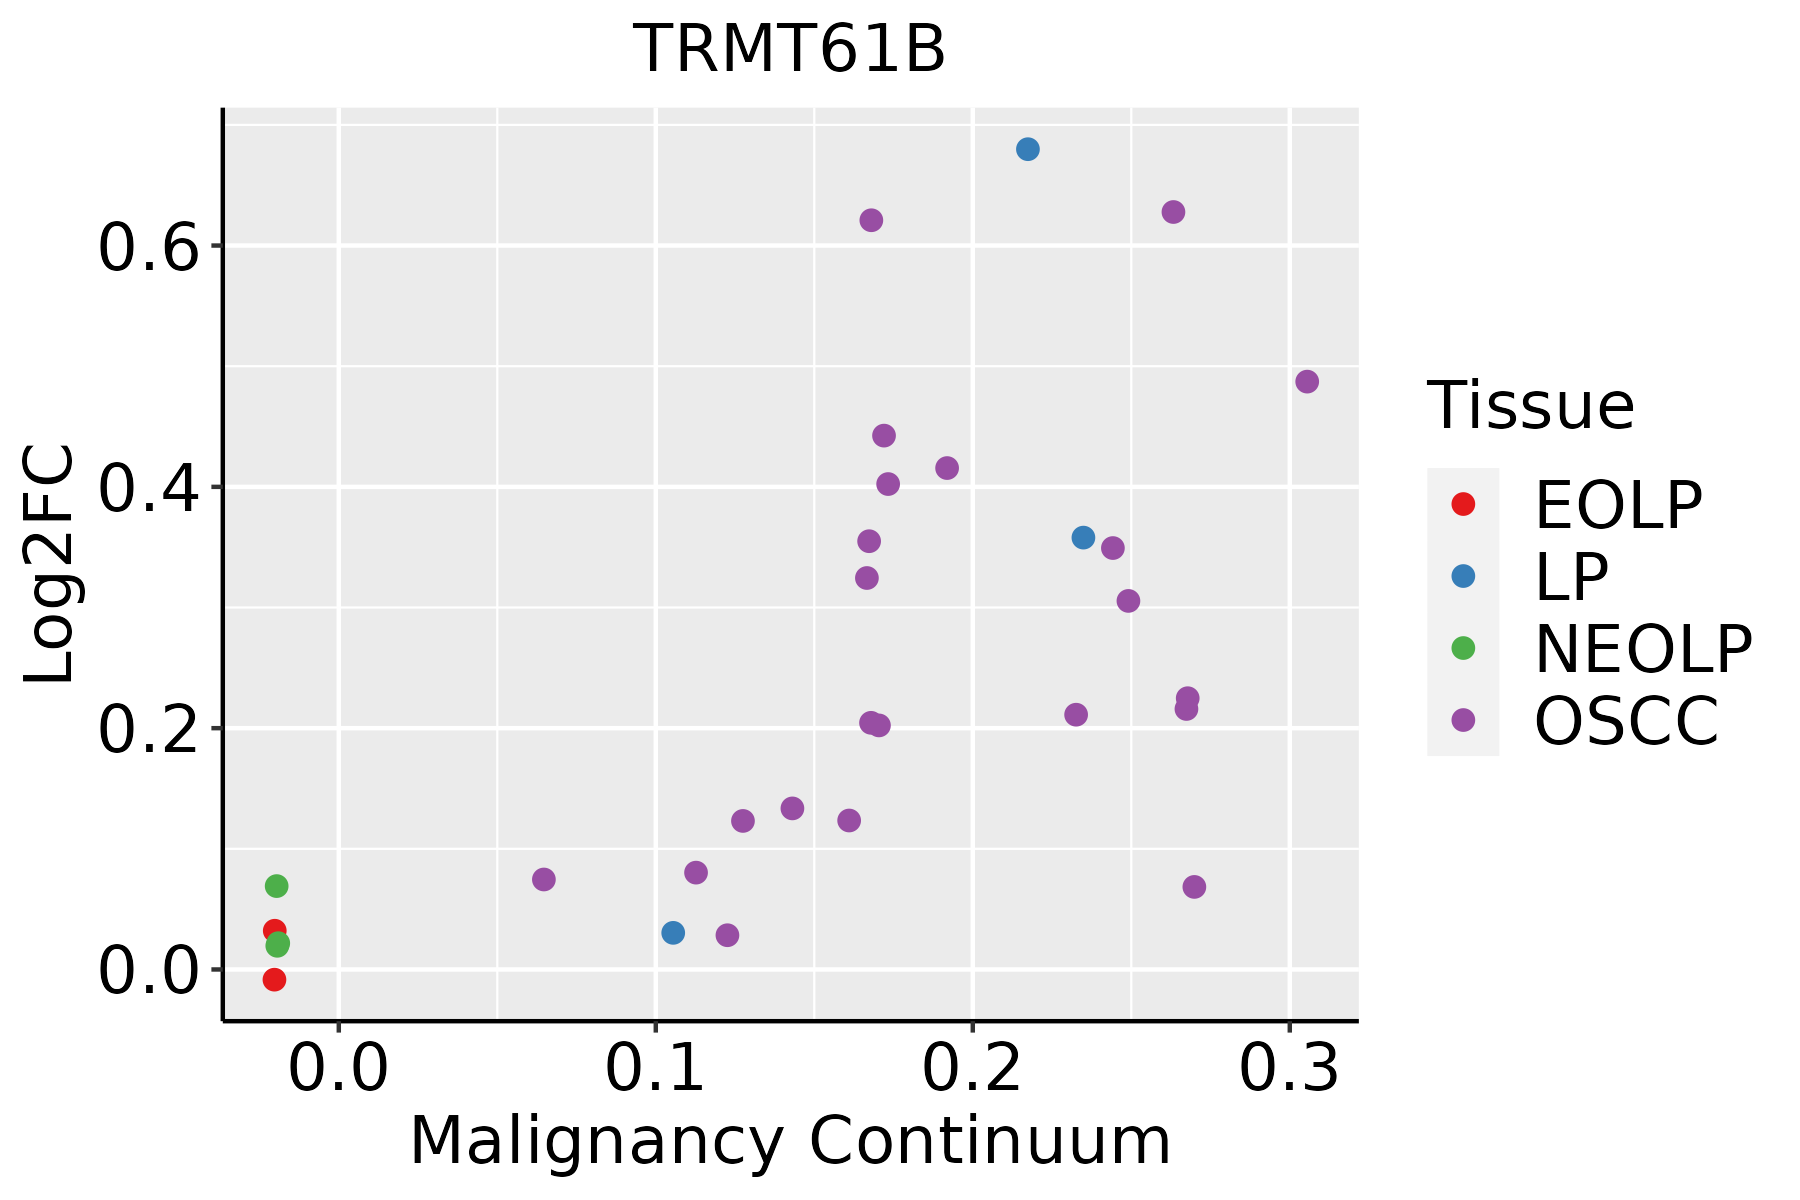 | EOLP: Erosive Oral lichen planus |
| LP: leukoplakia | ||
| NEOLP: Non-erosive oral lichen planus | ||
| OSCC: Oral squamous cell carcinoma |
| ∗log2FC in expression of this searched gene in stem-like cells from each diseased tissue sample relative to stem-like cells in normal samples in each tissue plotted against the malignancy continuum. Samples are colored based on if they are from different disease stage. |
Top |
Malignant transformation related pathway analysis |
| Find out the enriched GO biological processes and KEGG pathways involved in transition from healthy to precancer to cancer |
| Tissue | Disease Stage | Enriched GO biological Processes |
| Colorectum | AD |  |
| Colorectum | SER |  |
| Colorectum | MSS |  |
| Colorectum | MSI-H |  |
| Colorectum | FAP |  |
| ∗Top 15 enriched GO BP terms are showed in the bar plot of each disease state in each tissue. Each row represents a significant GO biological process which is colored according to the -log10(p.adjust). |
| Page: 1 2 3 4 5 6 7 8 9 |
| GO ID | Tissue | Disease Stage | Description | Gene Ratio | Bg Ratio | pvalue | p.adjust | Count |
| GO:0022613111 | Esophagus | ESCC | ribonucleoprotein complex biogenesis | 365/8552 | 463/18723 | 1.74e-49 | 1.11e-45 | 365 |
| GO:0042254111 | Esophagus | ESCC | ribosome biogenesis | 252/8552 | 299/18723 | 3.27e-44 | 1.04e-40 | 252 |
| GO:003447015 | Esophagus | ESCC | ncRNA processing | 300/8552 | 395/18723 | 3.09e-35 | 3.26e-32 | 300 |
| GO:0016072110 | Esophagus | ESCC | rRNA metabolic process | 197/8552 | 236/18723 | 1.31e-33 | 1.18e-30 | 197 |
| GO:0006364110 | Esophagus | ESCC | rRNA processing | 189/8552 | 225/18723 | 4.88e-33 | 3.87e-30 | 189 |
| GO:003466012 | Esophagus | ESCC | ncRNA metabolic process | 346/8552 | 485/18723 | 4.35e-31 | 2.51e-28 | 346 |
| GO:014005313 | Esophagus | ESCC | mitochondrial gene expression | 93/8552 | 108/18723 | 1.96e-18 | 2.03e-16 | 93 |
| GO:00434143 | Esophagus | ESCC | macromolecule methylation | 199/8552 | 316/18723 | 3.44e-10 | 9.57e-09 | 199 |
| GO:00080333 | Esophagus | ESCC | tRNA processing | 92/8552 | 127/18723 | 7.83e-10 | 1.93e-08 | 92 |
| GO:00063992 | Esophagus | ESCC | tRNA metabolic process | 122/8552 | 179/18723 | 9.03e-10 | 2.19e-08 | 122 |
| GO:00322592 | Esophagus | ESCC | methylation | 222/8552 | 364/18723 | 2.26e-09 | 5.09e-08 | 222 |
| GO:00094512 | Esophagus | ESCC | RNA modification | 114/8552 | 167/18723 | 2.76e-09 | 6.04e-08 | 114 |
| GO:00009592 | Esophagus | ESCC | mitochondrial RNA metabolic process | 39/8552 | 49/18723 | 1.20e-06 | 1.49e-05 | 39 |
| GO:00009631 | Esophagus | ESCC | mitochondrial RNA processing | 19/8552 | 20/18723 | 3.83e-06 | 4.14e-05 | 19 |
| GO:00015101 | Esophagus | ESCC | RNA methylation | 58/8552 | 83/18723 | 6.87e-06 | 6.94e-05 | 58 |
| GO:00064002 | Esophagus | ESCC | tRNA modification | 62/8552 | 90/18723 | 7.02e-06 | 7.04e-05 | 62 |
| GO:00304881 | Esophagus | ESCC | tRNA methylation | 30/8552 | 41/18723 | 3.27e-04 | 1.93e-03 | 30 |
| GO:00800092 | Esophagus | ESCC | mRNA methylation | 14/8552 | 16/18723 | 6.78e-04 | 3.56e-03 | 14 |
| GO:00165561 | Esophagus | ESCC | mRNA modification | 21/8552 | 27/18723 | 6.88e-04 | 3.61e-03 | 21 |
| GO:0090646 | Esophagus | ESCC | mitochondrial tRNA processing | 11/8552 | 12/18723 | 1.26e-03 | 6.06e-03 | 11 |
| Page: 1 2 3 4 |
| Pathway ID | Tissue | Disease Stage | Description | Gene Ratio | Bg Ratio | pvalue | p.adjust | qvalue | Count |
| Page: 1 |
Top |
Cell-cell communication analysis |
| Identification of potential cell-cell interactions between two cell types and their ligand-receptor pairs for different disease states |
| Ligand | Receptor | LRpair | Pathway | Tissue | Disease Stage |
| Page: 1 |
Top |
Single-cell gene regulatory network inference analysis |
| Find out the significant the regulons (TFs) and the target genes of each regulon across cell types for different disease states |
| TF | Cell Type | Tissue | Disease Stage | Target Gene | RSS | Regulon Activity |
| ∗The dot plots of a searched regulon are shown for all cell subpopulations in each disease state of each tissue based on the regulon specific score inferred using pySCENIC and by calculating the average expression. |
| Page: 1 |
Top |
Somatic mutation of malignant transformation related genes |
| Annotation of somatic variants for genes involved in malignant transformation |
| Hugo Symbol | Variant Class | Variant Classification | dbSNP RS | HGVSc | HGVSp | HGVSp Short | SWISSPROT | BIOTYPE | SIFT | PolyPhen | Tumor Sample Barcode | Tissue | Histology | Sex | Age | Stage | Therapy Types | Drugs | Outcome |
| TRMT61B | SNV | Missense_Mutation | c.988N>C | p.Asp330His | p.D330H | Q9BVS5 | protein_coding | tolerated(0.14) | possibly_damaging(0.773) | TCGA-AC-A23H-01 | Breast | breast invasive carcinoma | Female | >=65 | I/II | Unknown | Unknown | PD | |
| TRMT61B | SNV | Missense_Mutation | rs375238952 | c.377N>T | p.Ser126Leu | p.S126L | Q9BVS5 | protein_coding | tolerated(0.28) | benign(0.006) | TCGA-D8-A147-01 | Breast | breast invasive carcinoma | Female | <65 | I/II | Chemotherapy | doxorubicine | SD |
| TRMT61B | insertion | Frame_Shift_Ins | novel | c.462_463insACCCCGTATGAGGTGTGGTTTGAGTATTTTA | p.Glu155ThrfsTer16 | p.E155Tfs*16 | Q9BVS5 | protein_coding | TCGA-A2-A0EX-01 | Breast | breast invasive carcinoma | Female | <65 | I/II | Hormone Therapy | tamoxiphen | SD | ||
| TRMT61B | insertion | Frame_Shift_Ins | novel | c.1039dupT | p.Tyr347LeufsTer5 | p.Y347Lfs*5 | Q9BVS5 | protein_coding | TCGA-A7-A0CJ-01 | Breast | breast invasive carcinoma | Female | <65 | I/II | Chemotherapy | cytoxan | SD | ||
| TRMT61B | deletion | Frame_Shift_Del | c.542delN | p.Asn181IlefsTer21 | p.N181Ifs*21 | Q9BVS5 | protein_coding | TCGA-BH-A0GZ-01 | Breast | breast invasive carcinoma | Female | <65 | I/II | Hormone Therapy | arimidex | SD | |||
| TRMT61B | SNV | Missense_Mutation | c.780N>A | p.Met260Ile | p.M260I | Q9BVS5 | protein_coding | deleterious(0.02) | possibly_damaging(0.781) | TCGA-Q1-A73P-01 | Cervix | cervical & endocervical cancer | Female | <65 | I/II | Unknown | Unknown | SD | |
| TRMT61B | deletion | Frame_Shift_Del | c.542delN | p.Asn181IlefsTer21 | p.N181Ifs*21 | Q9BVS5 | protein_coding | TCGA-EK-A2R9-01 | Cervix | cervical & endocervical cancer | Female | <65 | I/II | Unknown | Unknown | SD | |||
| TRMT61B | SNV | Missense_Mutation | rs760677287 | c.10G>A | p.Ala4Thr | p.A4T | Q9BVS5 | protein_coding | tolerated_low_confidence(0.09) | benign(0.007) | TCGA-A6-5660-01 | Colorectum | colon adenocarcinoma | Male | >=65 | III/IV | Ancillary | leucovorin | SD |
| TRMT61B | SNV | Missense_Mutation | rs781061232 | c.1120N>T | p.Arg374Cys | p.R374C | Q9BVS5 | protein_coding | deleterious(0.02) | benign(0.04) | TCGA-AZ-4315-01 | Colorectum | colon adenocarcinoma | Male | <65 | I/II | Unknown | Unknown | SD |
| TRMT61B | SNV | Missense_Mutation | c.507N>T | p.Lys169Asn | p.K169N | Q9BVS5 | protein_coding | deleterious(0) | possibly_damaging(0.894) | TCGA-CA-6718-01 | Colorectum | colon adenocarcinoma | Male | <65 | I/II | Unknown | Unknown | PD |
| Page: 1 2 3 4 5 |
Top |
Related drugs of malignant transformation related genes |
| Identification of chemicals and drugs interact with genes involved in malignant transfromation |
| (DGIdb 4.0) |
| Entrez ID | Symbol | Category | Interaction Types | Drug Claim Name | Drug Name | PMIDs |
| Page: 1 |

Copyright 2023-Present -The University of Texas Health Science Center at Houston |