
|
|||||
|
 | |
| |
| |
| |
| |
| |
|
Gene: TRMT6 |
Gene summary for TRMT6 |
| Gene information | Species | Human | Gene symbol | TRMT6 | Gene ID | 51605 |
| Gene name | tRNA methyltransferase 6 non-catalytic subunit | |
| Gene Alias | CGI-09 | |
| Cytomap | 20p12.3 | |
| Gene Type | protein-coding | GO ID | GO:0001510 | UniProtAcc | Q9UJA5 |
Top |
Malignant transformation analysis |
| Identification of the aberrant gene expression in precancerous and cancerous lesions by comparing the gene expression of stem-like cells in diseased tissues with normal stem cells |
| Entrez ID | Symbol | Replicates | Species | Organ | Tissue | Adj P-value | Log2FC | Malignancy |
| 51605 | TRMT6 | LZE2T | Human | Esophagus | ESCC | 2.47e-07 | 3.05e-01 | 0.082 |
| 51605 | TRMT6 | LZE4T | Human | Esophagus | ESCC | 5.16e-08 | 2.47e-01 | 0.0811 |
| 51605 | TRMT6 | LZE7T | Human | Esophagus | ESCC | 2.13e-04 | 5.02e-01 | 0.0667 |
| 51605 | TRMT6 | LZE8T | Human | Esophagus | ESCC | 1.68e-07 | 7.61e-02 | 0.067 |
| 51605 | TRMT6 | LZE24T | Human | Esophagus | ESCC | 4.17e-13 | 1.26e-01 | 0.0596 |
| 51605 | TRMT6 | LZE21T | Human | Esophagus | ESCC | 4.08e-02 | -5.24e-02 | 0.0655 |
| 51605 | TRMT6 | P2T-E | Human | Esophagus | ESCC | 2.34e-15 | 3.16e-01 | 0.1177 |
| 51605 | TRMT6 | P4T-E | Human | Esophagus | ESCC | 1.08e-21 | 6.93e-01 | 0.1323 |
| 51605 | TRMT6 | P5T-E | Human | Esophagus | ESCC | 1.20e-09 | 3.25e-01 | 0.1327 |
| 51605 | TRMT6 | P8T-E | Human | Esophagus | ESCC | 7.32e-10 | 2.13e-01 | 0.0889 |
| 51605 | TRMT6 | P9T-E | Human | Esophagus | ESCC | 9.45e-11 | 2.36e-01 | 0.1131 |
| 51605 | TRMT6 | P10T-E | Human | Esophagus | ESCC | 1.77e-17 | 4.59e-01 | 0.116 |
| 51605 | TRMT6 | P11T-E | Human | Esophagus | ESCC | 8.47e-07 | 2.43e-01 | 0.1426 |
| 51605 | TRMT6 | P12T-E | Human | Esophagus | ESCC | 5.75e-13 | 4.08e-01 | 0.1122 |
| 51605 | TRMT6 | P15T-E | Human | Esophagus | ESCC | 7.27e-18 | 4.40e-01 | 0.1149 |
| 51605 | TRMT6 | P16T-E | Human | Esophagus | ESCC | 3.70e-14 | 3.74e-01 | 0.1153 |
| 51605 | TRMT6 | P19T-E | Human | Esophagus | ESCC | 7.81e-06 | 2.81e-01 | 0.1662 |
| 51605 | TRMT6 | P20T-E | Human | Esophagus | ESCC | 1.53e-14 | 5.13e-01 | 0.1124 |
| 51605 | TRMT6 | P21T-E | Human | Esophagus | ESCC | 4.48e-21 | 7.94e-01 | 0.1617 |
| 51605 | TRMT6 | P22T-E | Human | Esophagus | ESCC | 1.24e-15 | 1.96e-02 | 0.1236 |
| Page: 1 2 3 4 5 6 |
| Tissue | Expression Dynamics | Abbreviation |
| Esophagus | 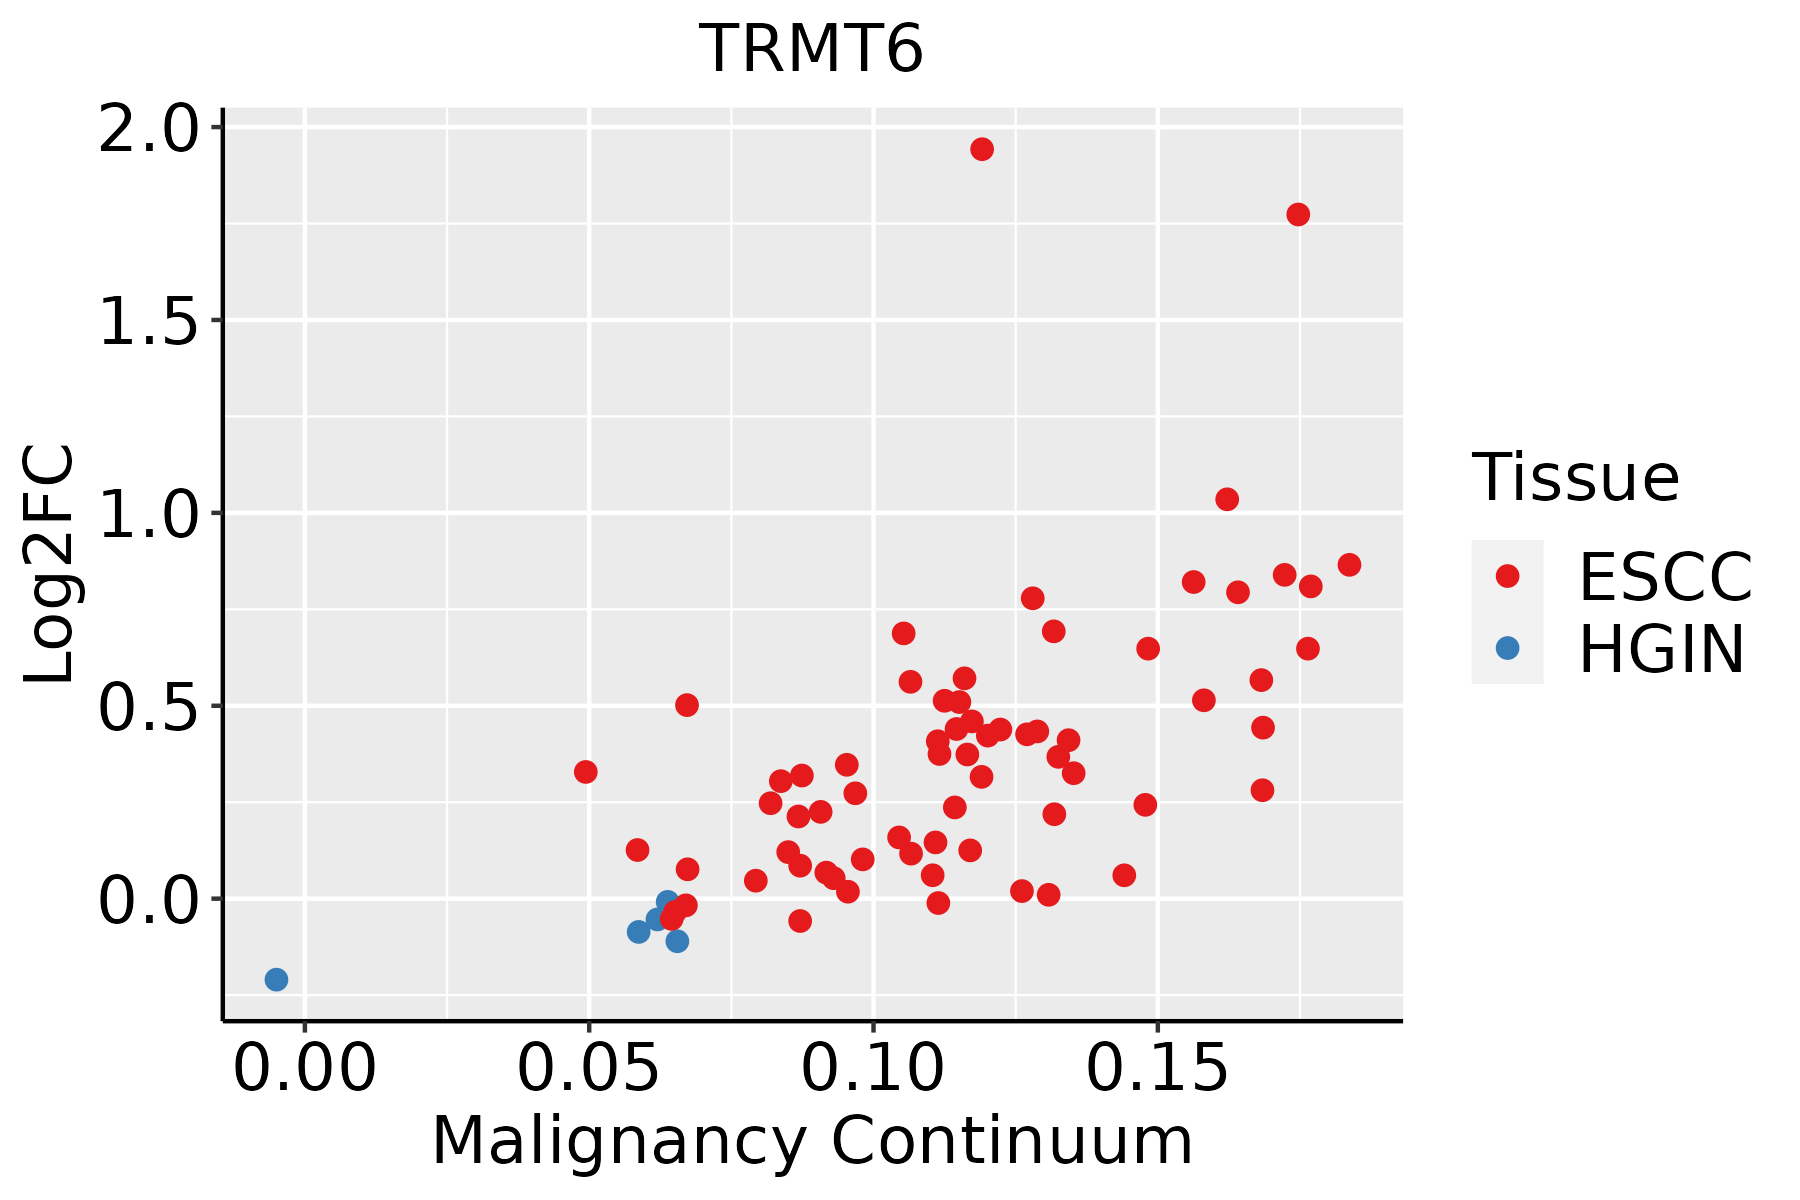 | ESCC: Esophageal squamous cell carcinoma |
| HGIN: High-grade intraepithelial neoplasias | ||
| LGIN: Low-grade intraepithelial neoplasias | ||
| Liver | 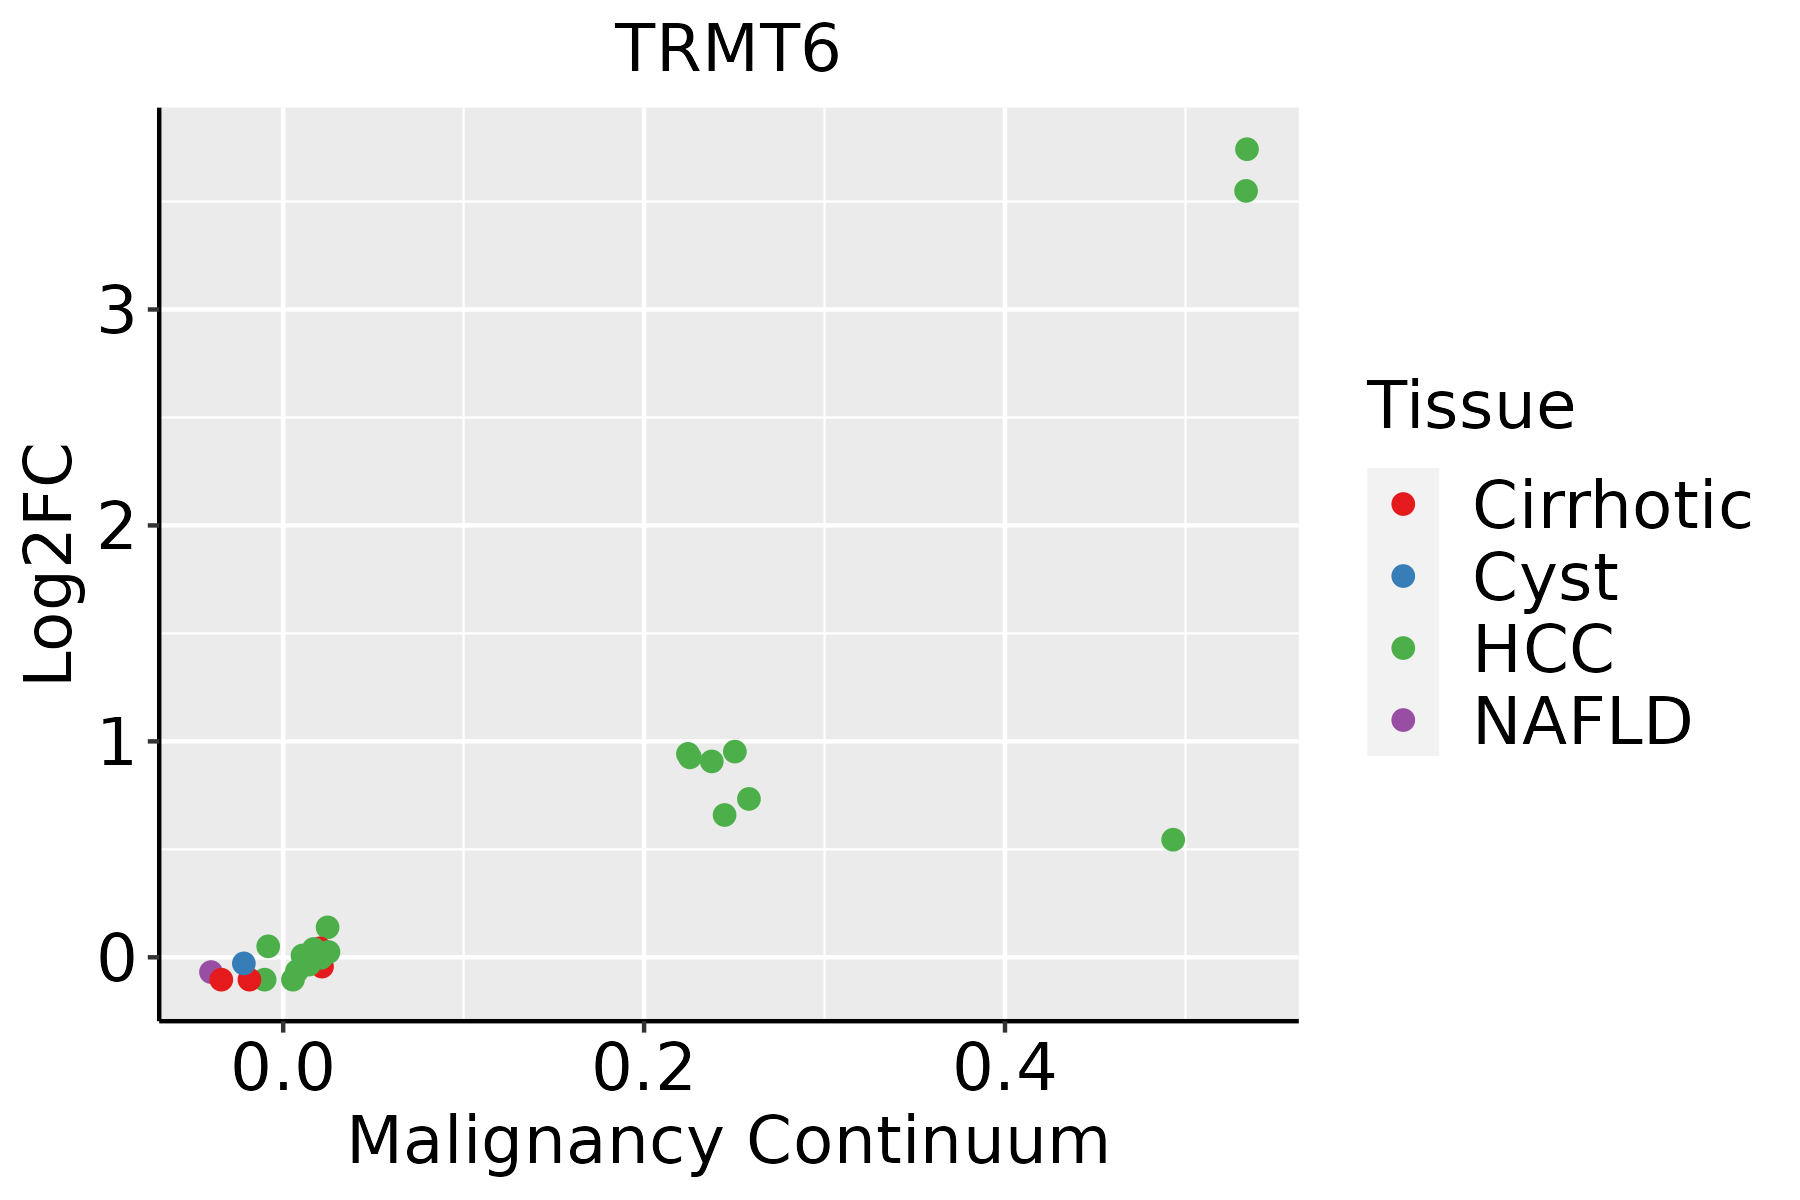 | HCC: Hepatocellular carcinoma |
| NAFLD: Non-alcoholic fatty liver disease | ||
| Oral Cavity |  | EOLP: Erosive Oral lichen planus |
| LP: leukoplakia | ||
| NEOLP: Non-erosive oral lichen planus | ||
| OSCC: Oral squamous cell carcinoma | ||
| Skin | 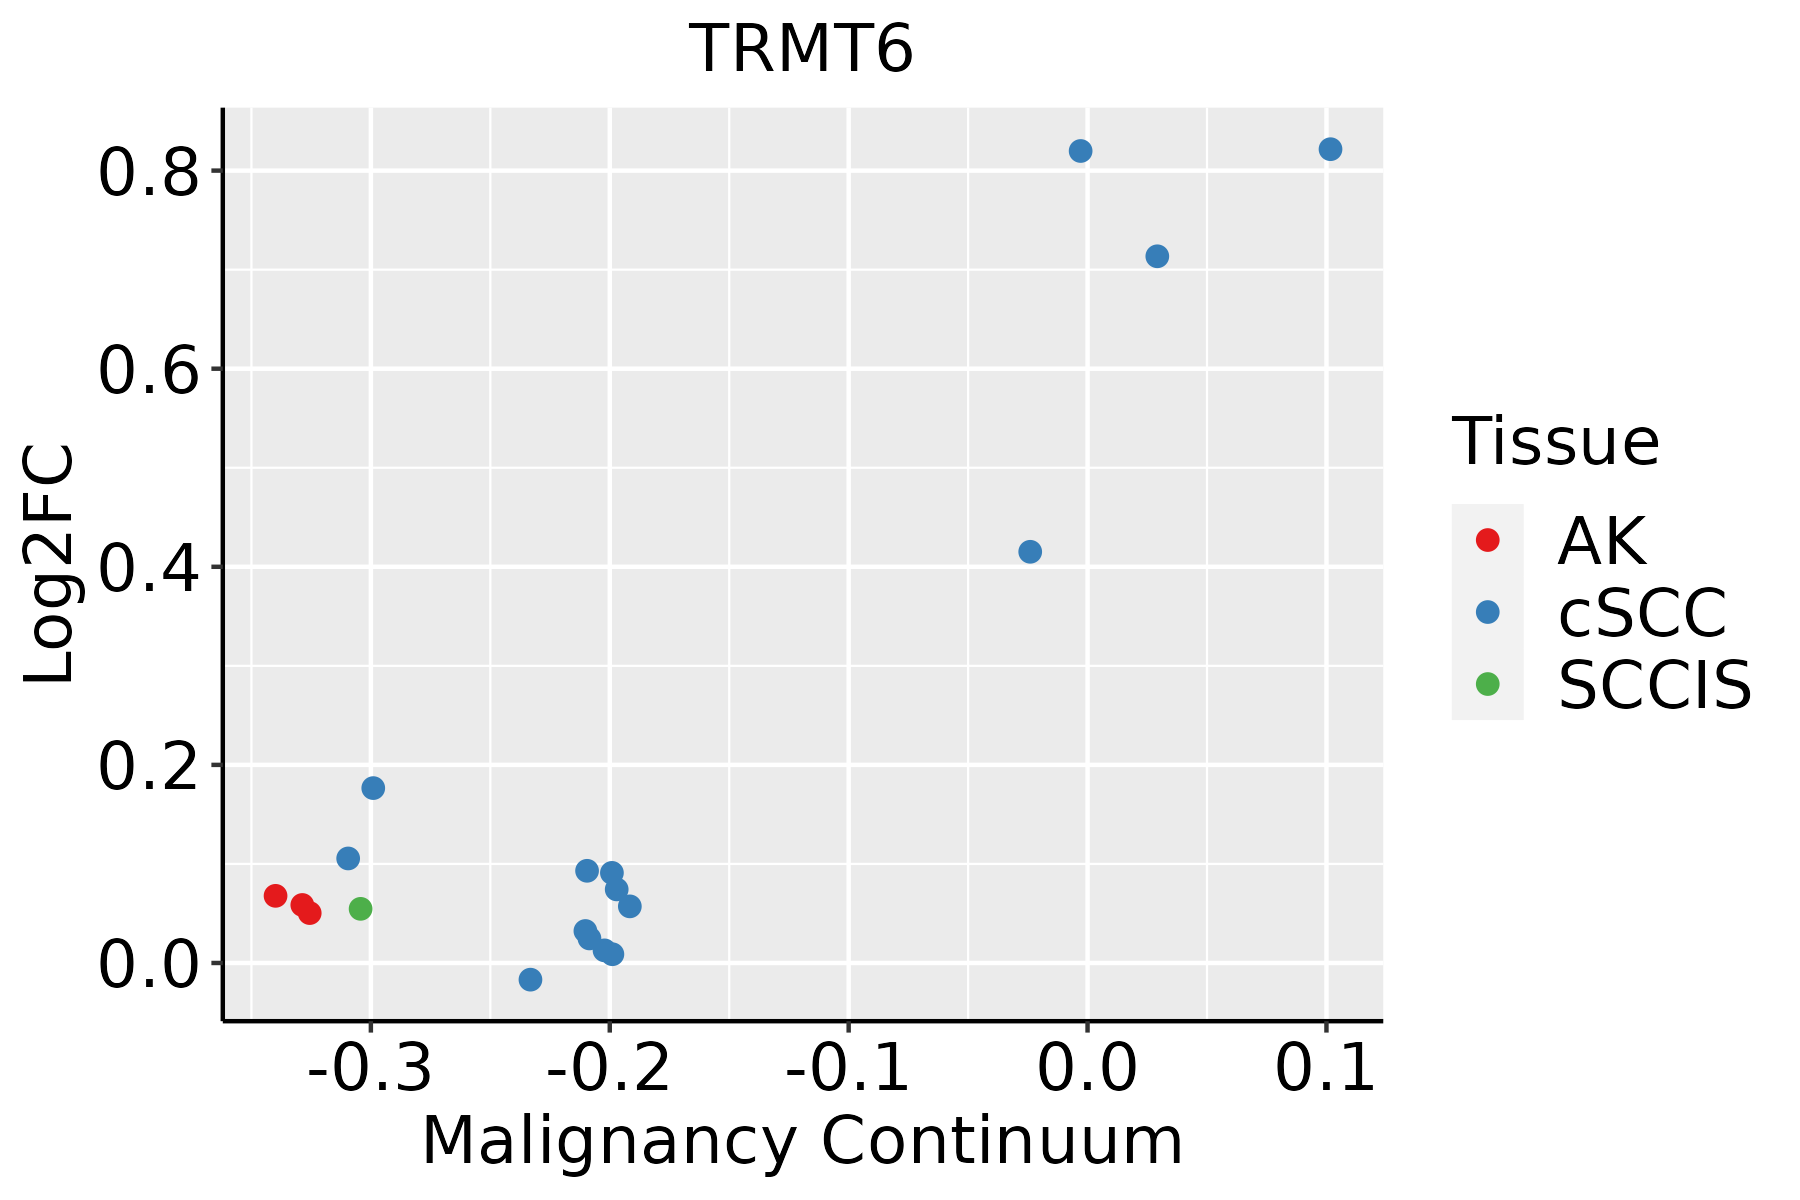 | AK: Actinic keratosis |
| cSCC: Cutaneous squamous cell carcinoma | ||
| SCCIS:squamous cell carcinoma in situ | ||
| Thyroid |  | ATC: Anaplastic thyroid cancer |
| HT: Hashimoto's thyroiditis | ||
| PTC: Papillary thyroid cancer |
| ∗log2FC in expression of this searched gene in stem-like cells from each diseased tissue sample relative to stem-like cells in normal samples in each tissue plotted against the malignancy continuum. Samples are colored based on if they are from different disease stage. |
Top |
Malignant transformation related pathway analysis |
| Find out the enriched GO biological processes and KEGG pathways involved in transition from healthy to precancer to cancer |
| Tissue | Disease Stage | Enriched GO biological Processes |
| Colorectum | AD |  |
| Colorectum | SER |  |
| Colorectum | MSS |  |
| Colorectum | MSI-H |  |
| Colorectum | FAP |  |
| ∗Top 15 enriched GO BP terms are showed in the bar plot of each disease state in each tissue. Each row represents a significant GO biological process which is colored according to the -log10(p.adjust). |
| Page: 1 2 3 4 5 6 7 8 9 |
| GO ID | Tissue | Disease Stage | Description | Gene Ratio | Bg Ratio | pvalue | p.adjust | Count |
| GO:0022613111 | Esophagus | ESCC | ribonucleoprotein complex biogenesis | 365/8552 | 463/18723 | 1.74e-49 | 1.11e-45 | 365 |
| GO:0042254111 | Esophagus | ESCC | ribosome biogenesis | 252/8552 | 299/18723 | 3.27e-44 | 1.04e-40 | 252 |
| GO:003447015 | Esophagus | ESCC | ncRNA processing | 300/8552 | 395/18723 | 3.09e-35 | 3.26e-32 | 300 |
| GO:0016072110 | Esophagus | ESCC | rRNA metabolic process | 197/8552 | 236/18723 | 1.31e-33 | 1.18e-30 | 197 |
| GO:0006364110 | Esophagus | ESCC | rRNA processing | 189/8552 | 225/18723 | 4.88e-33 | 3.87e-30 | 189 |
| GO:003466012 | Esophagus | ESCC | ncRNA metabolic process | 346/8552 | 485/18723 | 4.35e-31 | 2.51e-28 | 346 |
| GO:014005313 | Esophagus | ESCC | mitochondrial gene expression | 93/8552 | 108/18723 | 1.96e-18 | 2.03e-16 | 93 |
| GO:00434143 | Esophagus | ESCC | macromolecule methylation | 199/8552 | 316/18723 | 3.44e-10 | 9.57e-09 | 199 |
| GO:00080333 | Esophagus | ESCC | tRNA processing | 92/8552 | 127/18723 | 7.83e-10 | 1.93e-08 | 92 |
| GO:00063992 | Esophagus | ESCC | tRNA metabolic process | 122/8552 | 179/18723 | 9.03e-10 | 2.19e-08 | 122 |
| GO:00322592 | Esophagus | ESCC | methylation | 222/8552 | 364/18723 | 2.26e-09 | 5.09e-08 | 222 |
| GO:00094512 | Esophagus | ESCC | RNA modification | 114/8552 | 167/18723 | 2.76e-09 | 6.04e-08 | 114 |
| GO:00009592 | Esophagus | ESCC | mitochondrial RNA metabolic process | 39/8552 | 49/18723 | 1.20e-06 | 1.49e-05 | 39 |
| GO:00009631 | Esophagus | ESCC | mitochondrial RNA processing | 19/8552 | 20/18723 | 3.83e-06 | 4.14e-05 | 19 |
| GO:00015101 | Esophagus | ESCC | RNA methylation | 58/8552 | 83/18723 | 6.87e-06 | 6.94e-05 | 58 |
| GO:00064002 | Esophagus | ESCC | tRNA modification | 62/8552 | 90/18723 | 7.02e-06 | 7.04e-05 | 62 |
| GO:00304881 | Esophagus | ESCC | tRNA methylation | 30/8552 | 41/18723 | 3.27e-04 | 1.93e-03 | 30 |
| GO:00800092 | Esophagus | ESCC | mRNA methylation | 14/8552 | 16/18723 | 6.78e-04 | 3.56e-03 | 14 |
| GO:00165561 | Esophagus | ESCC | mRNA modification | 21/8552 | 27/18723 | 6.88e-04 | 3.61e-03 | 21 |
| GO:0090646 | Esophagus | ESCC | mitochondrial tRNA processing | 11/8552 | 12/18723 | 1.26e-03 | 6.06e-03 | 11 |
| Page: 1 2 3 4 5 |
| Pathway ID | Tissue | Disease Stage | Description | Gene Ratio | Bg Ratio | pvalue | p.adjust | qvalue | Count |
| Page: 1 |
Top |
Cell-cell communication analysis |
| Identification of potential cell-cell interactions between two cell types and their ligand-receptor pairs for different disease states |
| Ligand | Receptor | LRpair | Pathway | Tissue | Disease Stage |
| Page: 1 |
Top |
Single-cell gene regulatory network inference analysis |
| Find out the significant the regulons (TFs) and the target genes of each regulon across cell types for different disease states |
| TF | Cell Type | Tissue | Disease Stage | Target Gene | RSS | Regulon Activity |
| ∗The dot plots of a searched regulon are shown for all cell subpopulations in each disease state of each tissue based on the regulon specific score inferred using pySCENIC and by calculating the average expression. |
| Page: 1 |
Top |
Somatic mutation of malignant transformation related genes |
| Annotation of somatic variants for genes involved in malignant transformation |
| Hugo Symbol | Variant Class | Variant Classification | dbSNP RS | HGVSc | HGVSp | HGVSp Short | SWISSPROT | BIOTYPE | SIFT | PolyPhen | Tumor Sample Barcode | Tissue | Histology | Sex | Age | Stage | Therapy Types | Drugs | Outcome |
| TRMT6 | SNV | Missense_Mutation | rs544190283 | c.712N>T | p.Arg238Trp | p.R238W | Q9UJA5 | protein_coding | deleterious(0) | probably_damaging(1) | TCGA-AN-A046-01 | Breast | breast invasive carcinoma | Female | >=65 | I/II | Unknown | Unknown | SD |
| TRMT6 | SNV | Missense_Mutation | c.1439A>C | p.His480Pro | p.H480P | Q9UJA5 | protein_coding | tolerated_low_confidence(0.22) | benign(0) | TCGA-EW-A1J5-01 | Breast | breast invasive carcinoma | Female | <65 | I/II | Chemotherapy | adriamycin | SD | |
| TRMT6 | SNV | Missense_Mutation | novel | c.188G>C | p.Gly63Ala | p.G63A | Q9UJA5 | protein_coding | deleterious(0.02) | probably_damaging(0.974) | TCGA-PE-A5DE-01 | Breast | breast invasive carcinoma | Female | <65 | I/II | Chemotherapy | taxotere | CR |
| TRMT6 | deletion | Frame_Shift_Del | novel | c.607delN | p.Met203Ter | p.M203* | Q9UJA5 | protein_coding | TCGA-D8-A27V-01 | Breast | breast invasive carcinoma | Female | <65 | I/II | Hormone Therapy | tamoxiphen | SD | ||
| TRMT6 | deletion | Frame_Shift_Del | rs780358338 | c.458delA | p.Lys153AsnfsTer9 | p.K153Nfs*9 | Q9UJA5 | protein_coding | TCGA-VS-A9U6-01 | Cervix | cervical & endocervical cancer | Female | <65 | I/II | Chemotherapy | cisplatin | PD | ||
| TRMT6 | SNV | Missense_Mutation | c.125G>A | p.Arg42Lys | p.R42K | Q9UJA5 | protein_coding | tolerated(1) | benign(0.003) | TCGA-AA-A01P-01 | Colorectum | colon adenocarcinoma | Female | >=65 | III/IV | Unknown | Unknown | PD | |
| TRMT6 | SNV | Missense_Mutation | c.1255G>T | p.Gly419Trp | p.G419W | Q9UJA5 | protein_coding | deleterious(0) | probably_damaging(1) | TCGA-G4-6304-01 | Colorectum | colon adenocarcinoma | Female | >=65 | I/II | Chemotherapy | fluorouracil | PD | |
| TRMT6 | SNV | Missense_Mutation | rs766405213 | c.578N>T | p.Thr193Met | p.T193M | Q9UJA5 | protein_coding | deleterious(0) | probably_damaging(1) | TCGA-G4-6309-01 | Colorectum | colon adenocarcinoma | Female | <65 | III/IV | Chemotherapy | xeloda | PD |
| TRMT6 | deletion | Frame_Shift_Del | c.147delN | p.Lys49AsnfsTer20 | p.K49Nfs*20 | Q9UJA5 | protein_coding | TCGA-A6-5661-01 | Colorectum | colon adenocarcinoma | Female | >=65 | I/II | Unknown | Unknown | SD | |||
| TRMT6 | deletion | Frame_Shift_Del | rs780358338 | c.458delA | p.Lys153AsnfsTer9 | p.K153Nfs*9 | Q9UJA5 | protein_coding | TCGA-AU-6004-01 | Colorectum | colon adenocarcinoma | Female | >=65 | I/II | Unknown | Unknown | SD |
| Page: 1 2 3 4 5 |
Top |
Related drugs of malignant transformation related genes |
| Identification of chemicals and drugs interact with genes involved in malignant transfromation |
| (DGIdb 4.0) |
| Entrez ID | Symbol | Category | Interaction Types | Drug Claim Name | Drug Name | PMIDs |
| Page: 1 |

Copyright 2023-Present -The University of Texas Health Science Center at Houston |