
|
|||||
|
 | |
| |
| |
| |
| |
| |
|
Gene: TRMT5 |
Gene summary for TRMT5 |
| Gene information | Species | Human | Gene symbol | TRMT5 | Gene ID | 57570 |
| Gene name | tRNA methyltransferase 5 | |
| Gene Alias | COXPD26 | |
| Cytomap | 14q23.1 | |
| Gene Type | protein-coding | GO ID | GO:0000959 | UniProtAcc | Q32P41 |
Top |
Malignant transformation analysis |
| Identification of the aberrant gene expression in precancerous and cancerous lesions by comparing the gene expression of stem-like cells in diseased tissues with normal stem cells |
| Entrez ID | Symbol | Replicates | Species | Organ | Tissue | Adj P-value | Log2FC | Malignancy |
| 57570 | TRMT5 | LZE2T | Human | Esophagus | ESCC | 2.87e-04 | 3.77e-01 | 0.082 |
| 57570 | TRMT5 | LZE4T | Human | Esophagus | ESCC | 4.69e-07 | 2.04e-01 | 0.0811 |
| 57570 | TRMT5 | LZE5T | Human | Esophagus | ESCC | 9.05e-03 | 2.71e-01 | 0.0514 |
| 57570 | TRMT5 | LZE20T | Human | Esophagus | ESCC | 5.38e-06 | 1.81e-01 | 0.0662 |
| 57570 | TRMT5 | LZE24T | Human | Esophagus | ESCC | 1.04e-08 | 2.35e-01 | 0.0596 |
| 57570 | TRMT5 | P2T-E | Human | Esophagus | ESCC | 1.50e-09 | 2.15e-01 | 0.1177 |
| 57570 | TRMT5 | P4T-E | Human | Esophagus | ESCC | 8.71e-10 | 2.29e-01 | 0.1323 |
| 57570 | TRMT5 | P5T-E | Human | Esophagus | ESCC | 1.14e-11 | 2.33e-01 | 0.1327 |
| 57570 | TRMT5 | P8T-E | Human | Esophagus | ESCC | 1.00e-07 | 1.46e-01 | 0.0889 |
| 57570 | TRMT5 | P9T-E | Human | Esophagus | ESCC | 2.81e-07 | 1.25e-01 | 0.1131 |
| 57570 | TRMT5 | P10T-E | Human | Esophagus | ESCC | 1.14e-09 | 1.98e-01 | 0.116 |
| 57570 | TRMT5 | P11T-E | Human | Esophagus | ESCC | 1.00e-06 | 2.98e-01 | 0.1426 |
| 57570 | TRMT5 | P12T-E | Human | Esophagus | ESCC | 4.42e-25 | 4.33e-01 | 0.1122 |
| 57570 | TRMT5 | P15T-E | Human | Esophagus | ESCC | 2.17e-33 | 5.96e-01 | 0.1149 |
| 57570 | TRMT5 | P16T-E | Human | Esophagus | ESCC | 2.08e-17 | 2.66e-01 | 0.1153 |
| 57570 | TRMT5 | P17T-E | Human | Esophagus | ESCC | 7.81e-07 | 2.62e-01 | 0.1278 |
| 57570 | TRMT5 | P19T-E | Human | Esophagus | ESCC | 8.80e-05 | 2.77e-01 | 0.1662 |
| 57570 | TRMT5 | P20T-E | Human | Esophagus | ESCC | 3.39e-09 | 1.95e-01 | 0.1124 |
| 57570 | TRMT5 | P21T-E | Human | Esophagus | ESCC | 3.56e-13 | 2.02e-01 | 0.1617 |
| 57570 | TRMT5 | P22T-E | Human | Esophagus | ESCC | 2.41e-09 | 1.32e-01 | 0.1236 |
| Page: 1 2 3 |
| Tissue | Expression Dynamics | Abbreviation |
| Esophagus | 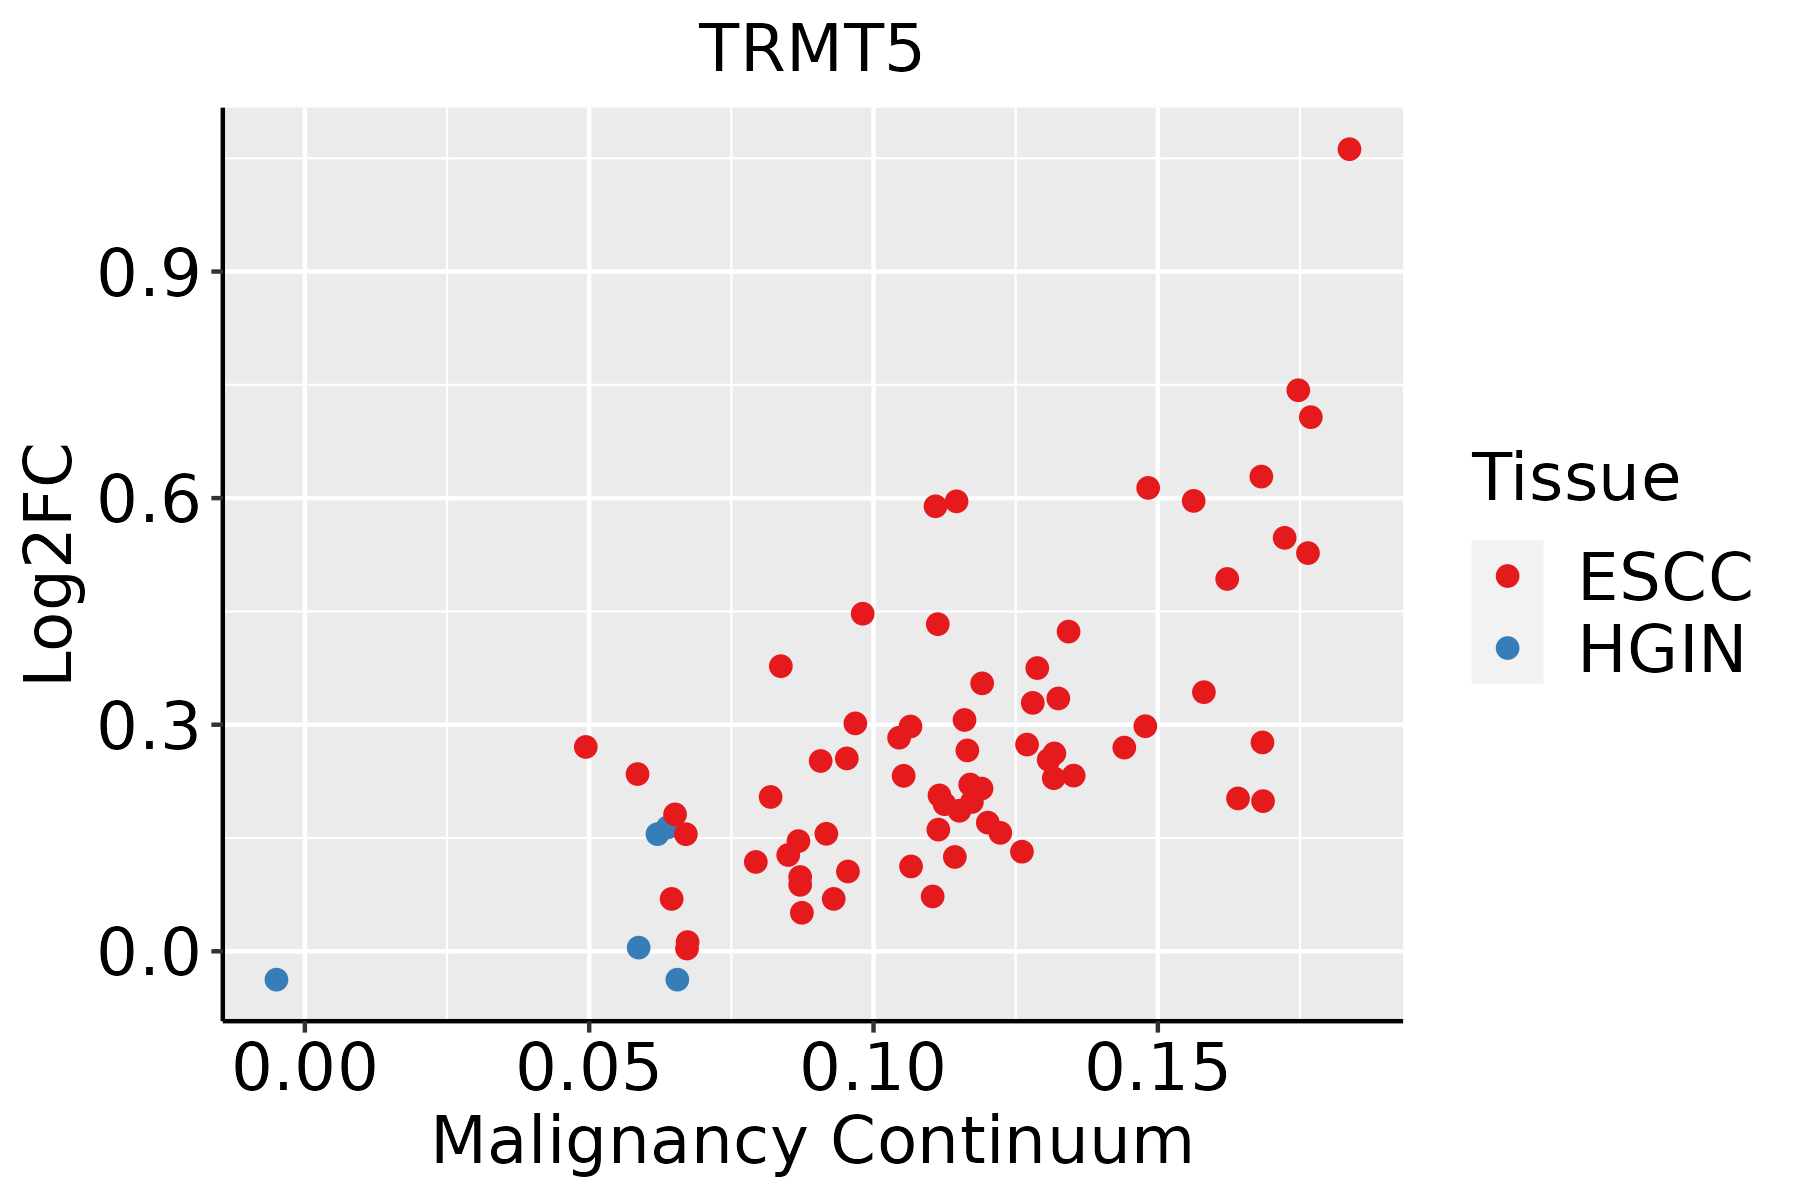 | ESCC: Esophageal squamous cell carcinoma |
| HGIN: High-grade intraepithelial neoplasias | ||
| LGIN: Low-grade intraepithelial neoplasias |
| ∗log2FC in expression of this searched gene in stem-like cells from each diseased tissue sample relative to stem-like cells in normal samples in each tissue plotted against the malignancy continuum. Samples are colored based on if they are from different disease stage. |
Top |
Malignant transformation related pathway analysis |
| Find out the enriched GO biological processes and KEGG pathways involved in transition from healthy to precancer to cancer |
| Tissue | Disease Stage | Enriched GO biological Processes |
| Colorectum | AD |  |
| Colorectum | SER |  |
| Colorectum | MSS |  |
| Colorectum | MSI-H |  |
| Colorectum | FAP |  |
| ∗Top 15 enriched GO BP terms are showed in the bar plot of each disease state in each tissue. Each row represents a significant GO biological process which is colored according to the -log10(p.adjust). |
| Page: 1 2 3 4 5 6 7 8 9 |
| GO ID | Tissue | Disease Stage | Description | Gene Ratio | Bg Ratio | pvalue | p.adjust | Count |
| GO:003447015 | Esophagus | ESCC | ncRNA processing | 300/8552 | 395/18723 | 3.09e-35 | 3.26e-32 | 300 |
| GO:003466012 | Esophagus | ESCC | ncRNA metabolic process | 346/8552 | 485/18723 | 4.35e-31 | 2.51e-28 | 346 |
| GO:014005313 | Esophagus | ESCC | mitochondrial gene expression | 93/8552 | 108/18723 | 1.96e-18 | 2.03e-16 | 93 |
| GO:00434143 | Esophagus | ESCC | macromolecule methylation | 199/8552 | 316/18723 | 3.44e-10 | 9.57e-09 | 199 |
| GO:00080333 | Esophagus | ESCC | tRNA processing | 92/8552 | 127/18723 | 7.83e-10 | 1.93e-08 | 92 |
| GO:00063992 | Esophagus | ESCC | tRNA metabolic process | 122/8552 | 179/18723 | 9.03e-10 | 2.19e-08 | 122 |
| GO:00322592 | Esophagus | ESCC | methylation | 222/8552 | 364/18723 | 2.26e-09 | 5.09e-08 | 222 |
| GO:00094512 | Esophagus | ESCC | RNA modification | 114/8552 | 167/18723 | 2.76e-09 | 6.04e-08 | 114 |
| GO:00009592 | Esophagus | ESCC | mitochondrial RNA metabolic process | 39/8552 | 49/18723 | 1.20e-06 | 1.49e-05 | 39 |
| GO:00009631 | Esophagus | ESCC | mitochondrial RNA processing | 19/8552 | 20/18723 | 3.83e-06 | 4.14e-05 | 19 |
| GO:00015101 | Esophagus | ESCC | RNA methylation | 58/8552 | 83/18723 | 6.87e-06 | 6.94e-05 | 58 |
| GO:00064002 | Esophagus | ESCC | tRNA modification | 62/8552 | 90/18723 | 7.02e-06 | 7.04e-05 | 62 |
| GO:00304881 | Esophagus | ESCC | tRNA methylation | 30/8552 | 41/18723 | 3.27e-04 | 1.93e-03 | 30 |
| GO:0090646 | Esophagus | ESCC | mitochondrial tRNA processing | 11/8552 | 12/18723 | 1.26e-03 | 6.06e-03 | 11 |
| Page: 1 |
| Pathway ID | Tissue | Disease Stage | Description | Gene Ratio | Bg Ratio | pvalue | p.adjust | qvalue | Count |
| Page: 1 |
Top |
Cell-cell communication analysis |
| Identification of potential cell-cell interactions between two cell types and their ligand-receptor pairs for different disease states |
| Ligand | Receptor | LRpair | Pathway | Tissue | Disease Stage |
| Page: 1 |
Top |
Single-cell gene regulatory network inference analysis |
| Find out the significant the regulons (TFs) and the target genes of each regulon across cell types for different disease states |
| TF | Cell Type | Tissue | Disease Stage | Target Gene | RSS | Regulon Activity |
| ∗The dot plots of a searched regulon are shown for all cell subpopulations in each disease state of each tissue based on the regulon specific score inferred using pySCENIC and by calculating the average expression. |
| Page: 1 |
Top |
Somatic mutation of malignant transformation related genes |
| Annotation of somatic variants for genes involved in malignant transformation |
| Hugo Symbol | Variant Class | Variant Classification | dbSNP RS | HGVSc | HGVSp | HGVSp Short | SWISSPROT | BIOTYPE | SIFT | PolyPhen | Tumor Sample Barcode | Tissue | Histology | Sex | Age | Stage | Therapy Types | Drugs | Outcome |
| TRMT5 | SNV | Missense_Mutation | c.334N>C | p.Ser112Pro | p.S112P | Q32P41 | protein_coding | tolerated(0.16) | benign(0.009) | TCGA-BH-A1EN-01 | Breast | breast invasive carcinoma | Female | >=65 | I/II | Unknown | Unknown | SD | |
| TRMT5 | SNV | Missense_Mutation | novel | c.1111N>A | p.Leu371Met | p.L371M | Q32P41 | protein_coding | tolerated(0.23) | benign(0.102) | TCGA-BH-A209-01 | Breast | breast invasive carcinoma | Female | >=65 | I/II | Unknown | Unknown | SD |
| TRMT5 | SNV | Missense_Mutation | c.686N>G | p.Lys229Arg | p.K229R | Q32P41 | protein_coding | deleterious(0) | probably_damaging(0.955) | TCGA-C8-A131-01 | Breast | breast invasive carcinoma | Female | >=65 | III/IV | Chemotherapy | 5-fluorouracil | CR | |
| TRMT5 | insertion | Frame_Shift_Ins | novel | c.1001_1002insCTTTCCCTGTTCAGAGCAT | p.Lys334AsnfsTer14 | p.K334Nfs*14 | Q32P41 | protein_coding | TCGA-A8-A083-01 | Breast | breast invasive carcinoma | Female | >=65 | I/II | Unknown | Unknown | SD | ||
| TRMT5 | insertion | Nonsense_Mutation | novel | c.999_1000insGTGAAATGTTAACCCTCTA | p.Lys334ValfsTer4 | p.K334Vfs*4 | Q32P41 | protein_coding | TCGA-A8-A083-01 | Breast | breast invasive carcinoma | Female | >=65 | I/II | Unknown | Unknown | SD | ||
| TRMT5 | insertion | Frame_Shift_Ins | novel | c.1002_1003insCCAT | p.Trp335ProfsTer8 | p.W335Pfs*8 | Q32P41 | protein_coding | TCGA-AQ-A04J-01 | Breast | breast invasive carcinoma | Female | <65 | I/II | Chemotherapy | cytoxan | SD | ||
| TRMT5 | insertion | Nonsense_Mutation | novel | c.1000_1001insTATAGCTAAGCTAAAAGAAT | p.Lys334IlefsTer2 | p.K334Ifs*2 | Q32P41 | protein_coding | TCGA-AQ-A04J-01 | Breast | breast invasive carcinoma | Female | <65 | I/II | Chemotherapy | cytoxan | SD | ||
| TRMT5 | SNV | Missense_Mutation | novel | c.1150N>T | p.Val384Phe | p.V384F | Q32P41 | protein_coding | tolerated(0.1) | benign(0.136) | TCGA-IR-A3LI-01 | Cervix | cervical & endocervical cancer | Female | <65 | I/II | Chemotherapy | cisplatin | CR |
| TRMT5 | SNV | Missense_Mutation | rs143033104 | c.850N>T | p.Arg284Cys | p.R284C | Q32P41 | protein_coding | deleterious(0) | probably_damaging(1) | TCGA-VS-A8EK-01 | Cervix | cervical & endocervical cancer | Female | >=65 | I/II | Chemotherapy | cisplatin | PD |
| TRMT5 | SNV | Missense_Mutation | c.359G>A | p.Arg120His | p.R120H | Q32P41 | protein_coding | deleterious(0.01) | probably_damaging(0.917) | TCGA-AA-3663-01 | Colorectum | colon adenocarcinoma | Male | <65 | I/II | Unknown | Unknown | SD |
| Page: 1 2 3 4 5 |
Top |
Related drugs of malignant transformation related genes |
| Identification of chemicals and drugs interact with genes involved in malignant transfromation |
| (DGIdb 4.0) |
| Entrez ID | Symbol | Category | Interaction Types | Drug Claim Name | Drug Name | PMIDs |
| Page: 1 |

Copyright 2023-Present -The University of Texas Health Science Center at Houston |