
|
|||||
|
 | |
| |
| |
| |
| |
| |
|
Gene: TRMT2A |
Gene summary for TRMT2A |
| Gene information | Species | Human | Gene symbol | TRMT2A | Gene ID | 27037 |
| Gene name | tRNA methyltransferase 2 homolog A | |
| Gene Alias | HTF9C | |
| Cytomap | 22q11.21 | |
| Gene Type | protein-coding | GO ID | GO:0001510 | UniProtAcc | Q8IZ69 |
Top |
Malignant transformation analysis |
| Identification of the aberrant gene expression in precancerous and cancerous lesions by comparing the gene expression of stem-like cells in diseased tissues with normal stem cells |
| Entrez ID | Symbol | Replicates | Species | Organ | Tissue | Adj P-value | Log2FC | Malignancy |
| 27037 | TRMT2A | LZE7T | Human | Esophagus | ESCC | 1.68e-05 | 2.99e-01 | 0.0667 |
| 27037 | TRMT2A | LZE24T | Human | Esophagus | ESCC | 5.37e-12 | 2.62e-01 | 0.0596 |
| 27037 | TRMT2A | P1T-E | Human | Esophagus | ESCC | 5.99e-04 | 2.95e-01 | 0.0875 |
| 27037 | TRMT2A | P2T-E | Human | Esophagus | ESCC | 4.85e-14 | 2.27e-01 | 0.1177 |
| 27037 | TRMT2A | P4T-E | Human | Esophagus | ESCC | 4.93e-09 | 2.62e-01 | 0.1323 |
| 27037 | TRMT2A | P5T-E | Human | Esophagus | ESCC | 5.54e-11 | 2.32e-01 | 0.1327 |
| 27037 | TRMT2A | P8T-E | Human | Esophagus | ESCC | 7.15e-15 | 2.31e-01 | 0.0889 |
| 27037 | TRMT2A | P9T-E | Human | Esophagus | ESCC | 1.92e-06 | 1.92e-01 | 0.1131 |
| 27037 | TRMT2A | P10T-E | Human | Esophagus | ESCC | 4.75e-32 | 5.49e-01 | 0.116 |
| 27037 | TRMT2A | P11T-E | Human | Esophagus | ESCC | 2.93e-08 | 3.13e-01 | 0.1426 |
| 27037 | TRMT2A | P12T-E | Human | Esophagus | ESCC | 1.00e-17 | 3.35e-01 | 0.1122 |
| 27037 | TRMT2A | P15T-E | Human | Esophagus | ESCC | 9.39e-08 | 2.43e-01 | 0.1149 |
| 27037 | TRMT2A | P16T-E | Human | Esophagus | ESCC | 1.53e-19 | 3.85e-01 | 0.1153 |
| 27037 | TRMT2A | P17T-E | Human | Esophagus | ESCC | 4.58e-08 | 3.65e-01 | 0.1278 |
| 27037 | TRMT2A | P20T-E | Human | Esophagus | ESCC | 8.21e-10 | 2.32e-01 | 0.1124 |
| 27037 | TRMT2A | P21T-E | Human | Esophagus | ESCC | 6.39e-34 | 6.04e-01 | 0.1617 |
| 27037 | TRMT2A | P22T-E | Human | Esophagus | ESCC | 9.93e-18 | 3.07e-01 | 0.1236 |
| 27037 | TRMT2A | P23T-E | Human | Esophagus | ESCC | 1.04e-17 | 3.90e-01 | 0.108 |
| 27037 | TRMT2A | P24T-E | Human | Esophagus | ESCC | 6.08e-15 | 2.94e-01 | 0.1287 |
| 27037 | TRMT2A | P26T-E | Human | Esophagus | ESCC | 2.26e-22 | 4.18e-01 | 0.1276 |
| Page: 1 2 3 4 5 |
| Tissue | Expression Dynamics | Abbreviation |
| Esophagus | 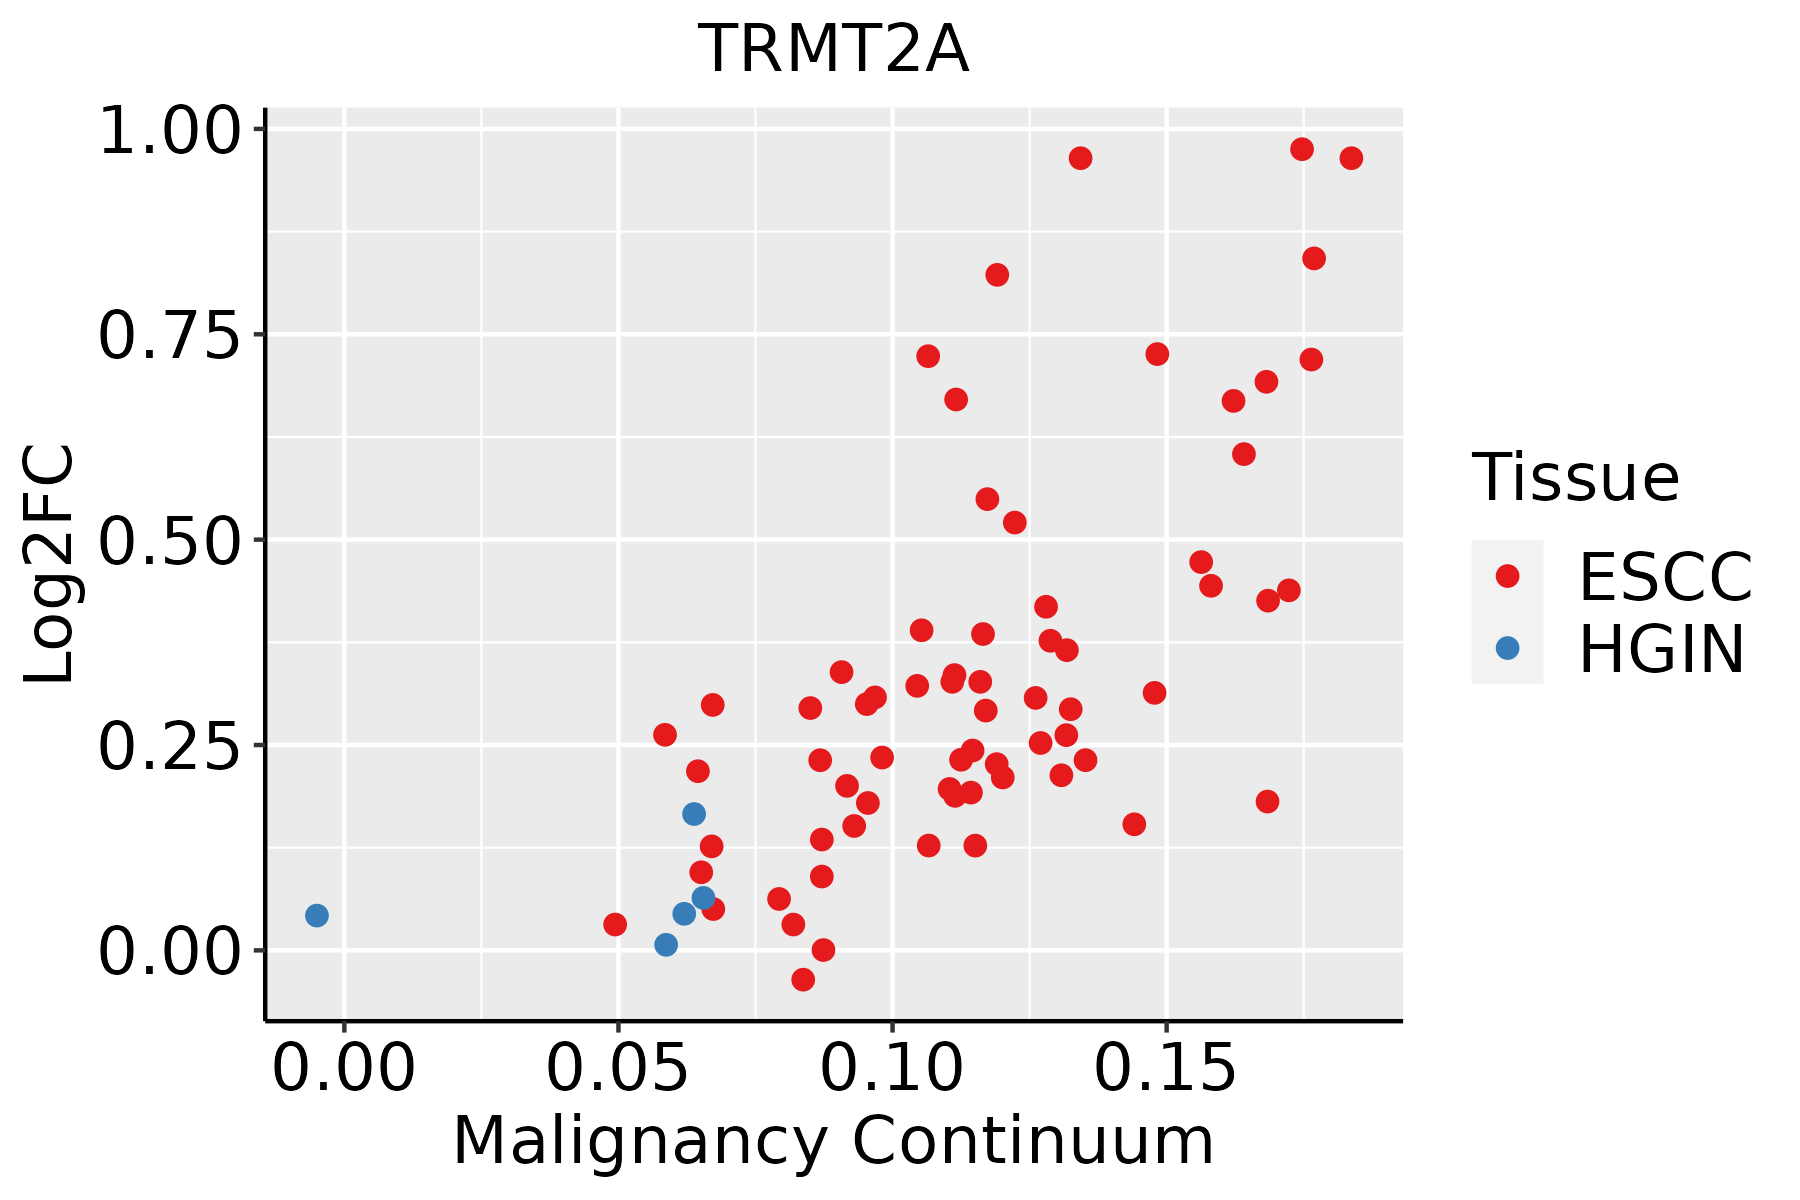 | ESCC: Esophageal squamous cell carcinoma |
| HGIN: High-grade intraepithelial neoplasias | ||
| LGIN: Low-grade intraepithelial neoplasias | ||
| Liver | 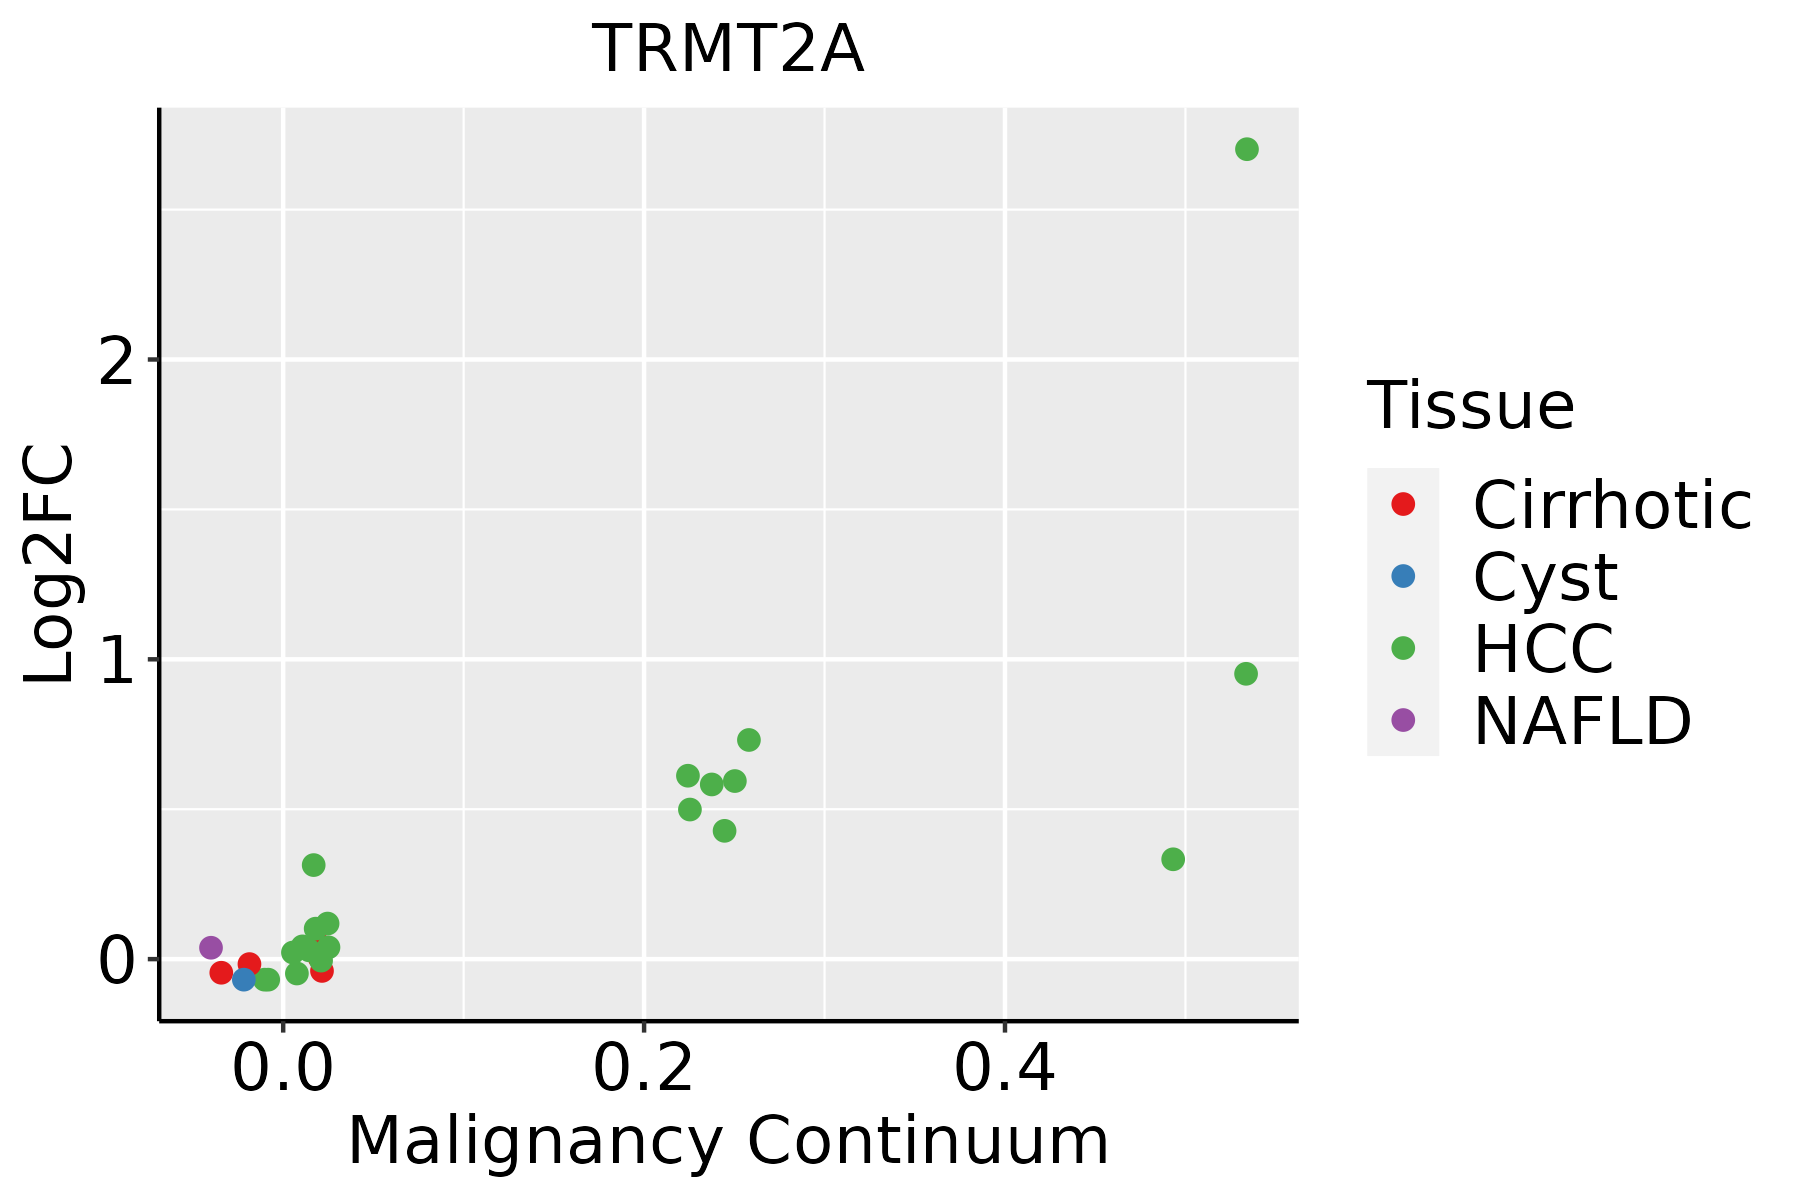 | HCC: Hepatocellular carcinoma |
| NAFLD: Non-alcoholic fatty liver disease | ||
| Oral Cavity | 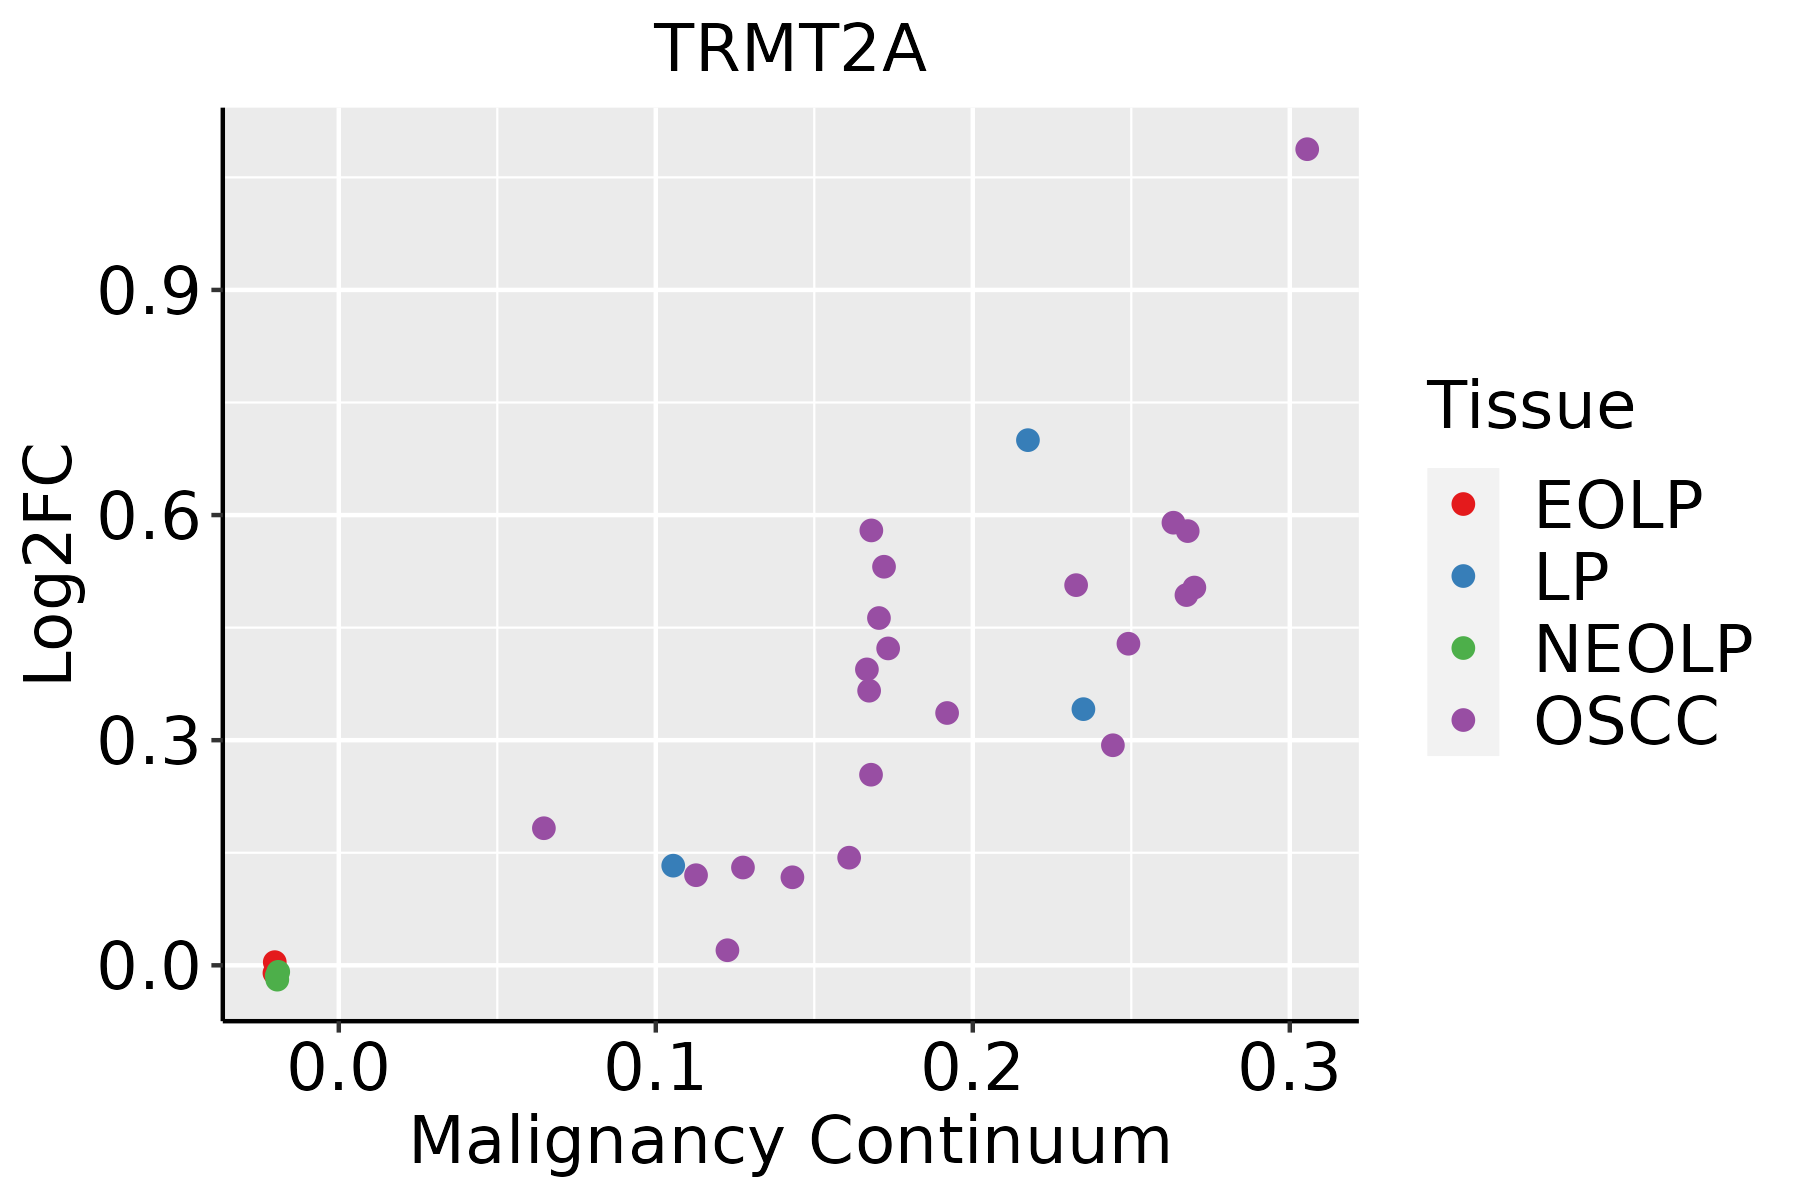 | EOLP: Erosive Oral lichen planus |
| LP: leukoplakia | ||
| NEOLP: Non-erosive oral lichen planus | ||
| OSCC: Oral squamous cell carcinoma |
| ∗log2FC in expression of this searched gene in stem-like cells from each diseased tissue sample relative to stem-like cells in normal samples in each tissue plotted against the malignancy continuum. Samples are colored based on if they are from different disease stage. |
Top |
Malignant transformation related pathway analysis |
| Find out the enriched GO biological processes and KEGG pathways involved in transition from healthy to precancer to cancer |
| Tissue | Disease Stage | Enriched GO biological Processes |
| Colorectum | AD |  |
| Colorectum | SER |  |
| Colorectum | MSS |  |
| Colorectum | MSI-H |  |
| Colorectum | FAP |  |
| ∗Top 15 enriched GO BP terms are showed in the bar plot of each disease state in each tissue. Each row represents a significant GO biological process which is colored according to the -log10(p.adjust). |
| Page: 1 2 3 4 5 6 7 8 9 |
| GO ID | Tissue | Disease Stage | Description | Gene Ratio | Bg Ratio | pvalue | p.adjust | Count |
| GO:00434143 | Esophagus | ESCC | macromolecule methylation | 199/8552 | 316/18723 | 3.44e-10 | 9.57e-09 | 199 |
| GO:00322592 | Esophagus | ESCC | methylation | 222/8552 | 364/18723 | 2.26e-09 | 5.09e-08 | 222 |
| GO:00094512 | Esophagus | ESCC | RNA modification | 114/8552 | 167/18723 | 2.76e-09 | 6.04e-08 | 114 |
| GO:00015101 | Esophagus | ESCC | RNA methylation | 58/8552 | 83/18723 | 6.87e-06 | 6.94e-05 | 58 |
| GO:00434141 | Liver | HCC | macromolecule methylation | 183/7958 | 316/18723 | 2.00e-08 | 4.72e-07 | 183 |
| GO:0032259 | Liver | HCC | methylation | 206/7958 | 364/18723 | 3.35e-08 | 7.53e-07 | 206 |
| GO:0009451 | Liver | HCC | RNA modification | 101/7958 | 167/18723 | 2.02e-06 | 2.78e-05 | 101 |
| GO:0001510 | Liver | HCC | RNA methylation | 53/7958 | 83/18723 | 6.96e-05 | 6.29e-04 | 53 |
| GO:00094511 | Oral cavity | OSCC | RNA modification | 95/7305 | 167/18723 | 2.05e-06 | 2.62e-05 | 95 |
| GO:00434142 | Oral cavity | OSCC | macromolecule methylation | 149/7305 | 316/18723 | 1.82e-03 | 8.60e-03 | 149 |
| GO:00322591 | Oral cavity | OSCC | methylation | 168/7305 | 364/18723 | 3.03e-03 | 1.31e-02 | 168 |
| Page: 1 |
| Pathway ID | Tissue | Disease Stage | Description | Gene Ratio | Bg Ratio | pvalue | p.adjust | qvalue | Count |
| Page: 1 |
Top |
Cell-cell communication analysis |
| Identification of potential cell-cell interactions between two cell types and their ligand-receptor pairs for different disease states |
| Ligand | Receptor | LRpair | Pathway | Tissue | Disease Stage |
| Page: 1 |
Top |
Single-cell gene regulatory network inference analysis |
| Find out the significant the regulons (TFs) and the target genes of each regulon across cell types for different disease states |
| TF | Cell Type | Tissue | Disease Stage | Target Gene | RSS | Regulon Activity |
| ∗The dot plots of a searched regulon are shown for all cell subpopulations in each disease state of each tissue based on the regulon specific score inferred using pySCENIC and by calculating the average expression. |
| Page: 1 |
Top |
Somatic mutation of malignant transformation related genes |
| Annotation of somatic variants for genes involved in malignant transformation |
| Hugo Symbol | Variant Class | Variant Classification | dbSNP RS | HGVSc | HGVSp | HGVSp Short | SWISSPROT | BIOTYPE | SIFT | PolyPhen | Tumor Sample Barcode | Tissue | Histology | Sex | Age | Stage | Therapy Types | Drugs | Outcome |
| TRMT2A | SNV | Missense_Mutation | c.1186N>A | p.Asp396Asn | p.D396N | protein_coding | tolerated(0.06) | benign(0.029) | TCGA-A2-A0YD-01 | Breast | breast invasive carcinoma | Female | <65 | I/II | Chemotherapy | cytoxan | SD | ||
| TRMT2A | SNV | Missense_Mutation | c.1125N>C | p.Lys375Asn | p.K375N | protein_coding | tolerated(0.05) | benign(0.031) | TCGA-A8-A06Q-01 | Breast | breast invasive carcinoma | Female | <65 | III/IV | Unknown | Unknown | SD | ||
| TRMT2A | SNV | Missense_Mutation | rs766757264 | c.1090N>C | p.Thr364Pro | p.T364P | protein_coding | deleterious(0) | probably_damaging(0.947) | TCGA-AC-A23H-01 | Breast | breast invasive carcinoma | Female | >=65 | I/II | Unknown | Unknown | PD | |
| TRMT2A | SNV | Missense_Mutation | c.511N>T | p.Val171Leu | p.V171L | protein_coding | deleterious(0.02) | benign(0.199) | TCGA-AC-A23H-01 | Breast | breast invasive carcinoma | Female | >=65 | I/II | Unknown | Unknown | PD | ||
| TRMT2A | SNV | Missense_Mutation | rs760703455 | c.395N>T | p.Ala132Val | p.A132V | protein_coding | tolerated(0.52) | benign(0.007) | TCGA-C8-A1HG-01 | Breast | breast invasive carcinoma | Female | <65 | I/II | Unknown | Unknown | SD | |
| TRMT2A | SNV | Missense_Mutation | c.1125N>C | p.Lys375Asn | p.K375N | protein_coding | tolerated(0.05) | benign(0.031) | TCGA-S3-AA15-01 | Breast | breast invasive carcinoma | Female | <65 | I/II | Chemotherapy | adriamycin | CR | ||
| TRMT2A | deletion | Frame_Shift_Del | c.1889delN | p.Pro630GlnfsTer25 | p.P630Qfs*25 | protein_coding | TCGA-A8-A09Z-01 | Breast | breast invasive carcinoma | Female | >=65 | I/II | Unknown | Unknown | SD | ||||
| TRMT2A | insertion | Nonsense_Mutation | novel | c.1180_1181insTGATTTG | p.His394LeufsTer3 | p.H394Lfs*3 | protein_coding | TCGA-AO-A03R-01 | Breast | breast invasive carcinoma | Female | <65 | I/II | Chemotherapy | doxorubicin | SD | |||
| TRMT2A | insertion | Frame_Shift_Ins | novel | c.1179_1180insA | p.His394ThrfsTer103 | p.H394Tfs*103 | protein_coding | TCGA-AO-A03R-01 | Breast | breast invasive carcinoma | Female | <65 | I/II | Chemotherapy | doxorubicin | SD | |||
| TRMT2A | SNV | Missense_Mutation | rs200053743 | c.1648N>T | p.Arg550Trp | p.R550W | protein_coding | deleterious(0) | probably_damaging(0.982) | TCGA-2W-A8YY-01 | Cervix | cervical & endocervical cancer | Female | <65 | I/II | Chemotherapy | cisplatin | CR |
| Page: 1 2 3 4 5 |
Top |
Related drugs of malignant transformation related genes |
| Identification of chemicals and drugs interact with genes involved in malignant transfromation |
| (DGIdb 4.0) |
| Entrez ID | Symbol | Category | Interaction Types | Drug Claim Name | Drug Name | PMIDs |
| Page: 1 |

Copyright 2023-Present -The University of Texas Health Science Center at Houston |