
|
|||||
|
 | |
| |
| |
| |
| |
| |
|
Gene: TRMT13 |
Gene summary for TRMT13 |
| Gene information | Species | Human | Gene symbol | TRMT13 | Gene ID | 54482 |
| Gene name | tRNA methyltransferase 13 homolog | |
| Gene Alias | CCDC76 | |
| Cytomap | 1p21.2 | |
| Gene Type | protein-coding | GO ID | GO:0001510 | UniProtAcc | Q9NUP7 |
Top |
Malignant transformation analysis |
| Identification of the aberrant gene expression in precancerous and cancerous lesions by comparing the gene expression of stem-like cells in diseased tissues with normal stem cells |
| Entrez ID | Symbol | Replicates | Species | Organ | Tissue | Adj P-value | Log2FC | Malignancy |
| 54482 | TRMT13 | HCC1_Meng | Human | Liver | HCC | 1.00e-51 | 1.13e-01 | 0.0246 |
| 54482 | TRMT13 | HCC2_Meng | Human | Liver | HCC | 2.04e-16 | 1.02e-01 | 0.0107 |
| 54482 | TRMT13 | HCC1 | Human | Liver | HCC | 8.02e-04 | 3.07e+00 | 0.5336 |
| 54482 | TRMT13 | HCC2 | Human | Liver | HCC | 1.26e-06 | 2.23e+00 | 0.5341 |
| 54482 | TRMT13 | S015 | Human | Liver | HCC | 2.75e-05 | 3.80e-01 | 0.2375 |
| 54482 | TRMT13 | S028 | Human | Liver | HCC | 4.14e-02 | 3.01e-01 | 0.2503 |
| 54482 | TRMT13 | S029 | Human | Liver | HCC | 1.67e-02 | 2.93e-01 | 0.2581 |
| 54482 | TRMT13 | RNA-P17T-P17T-4 | Human | Lung | IAC | 4.56e-03 | 5.67e-01 | 0.343 |
| 54482 | TRMT13 | RNA-P17T-P17T-8 | Human | Lung | IAC | 9.11e-07 | 7.14e-01 | 0.3329 |
| 54482 | TRMT13 | RNA-P6T2-P6T2-1 | Human | Lung | IAC | 1.20e-04 | 2.93e-01 | -0.0166 |
| 54482 | TRMT13 | RNA-P6T2-P6T2-2 | Human | Lung | IAC | 6.26e-07 | 3.77e-01 | -0.0132 |
| 54482 | TRMT13 | RNA-P6T2-P6T2-3 | Human | Lung | IAC | 1.20e-04 | 2.22e-01 | -0.013 |
| 54482 | TRMT13 | RNA-P6T2-P6T2-4 | Human | Lung | IAC | 1.45e-06 | 3.61e-01 | -0.0121 |
| Page: 1 |
| Tissue | Expression Dynamics | Abbreviation |
| Liver | 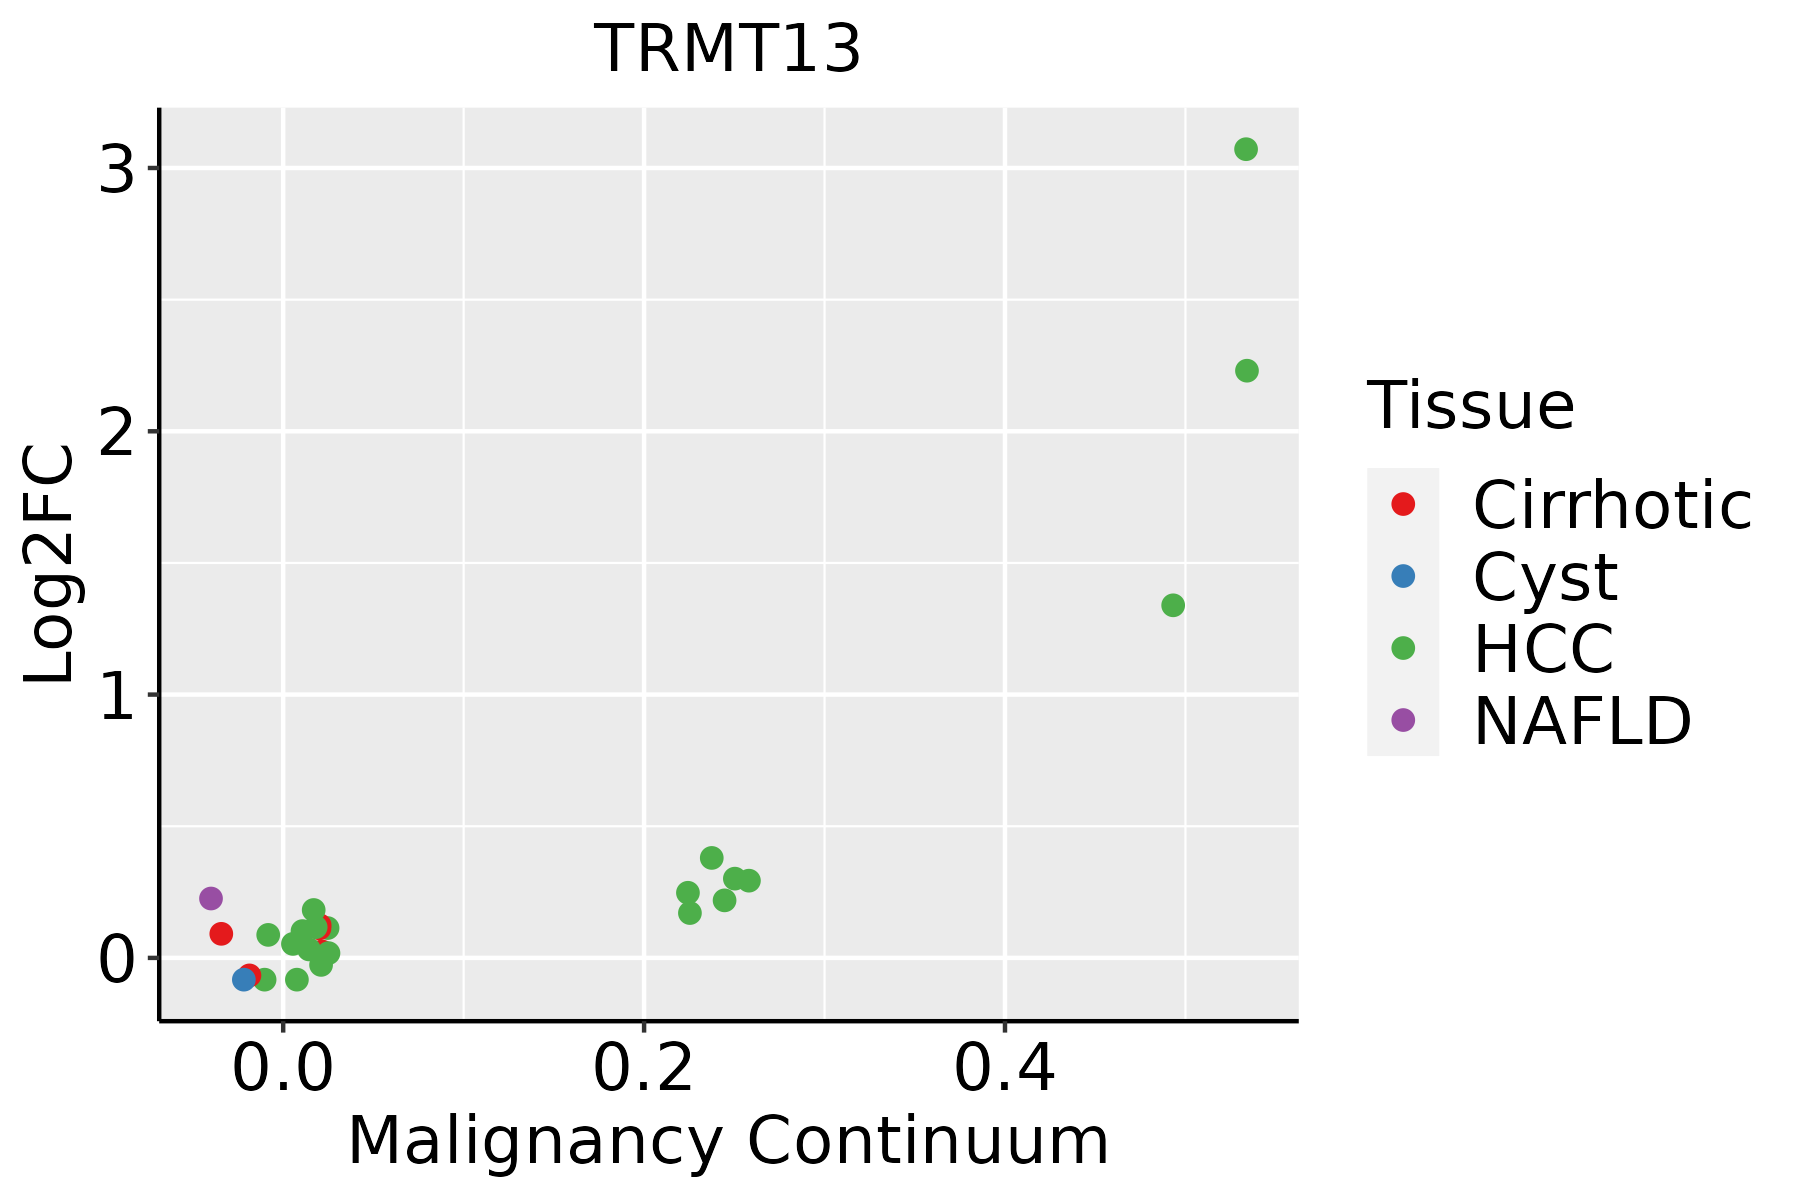 | HCC: Hepatocellular carcinoma |
| NAFLD: Non-alcoholic fatty liver disease | ||
| Lung | 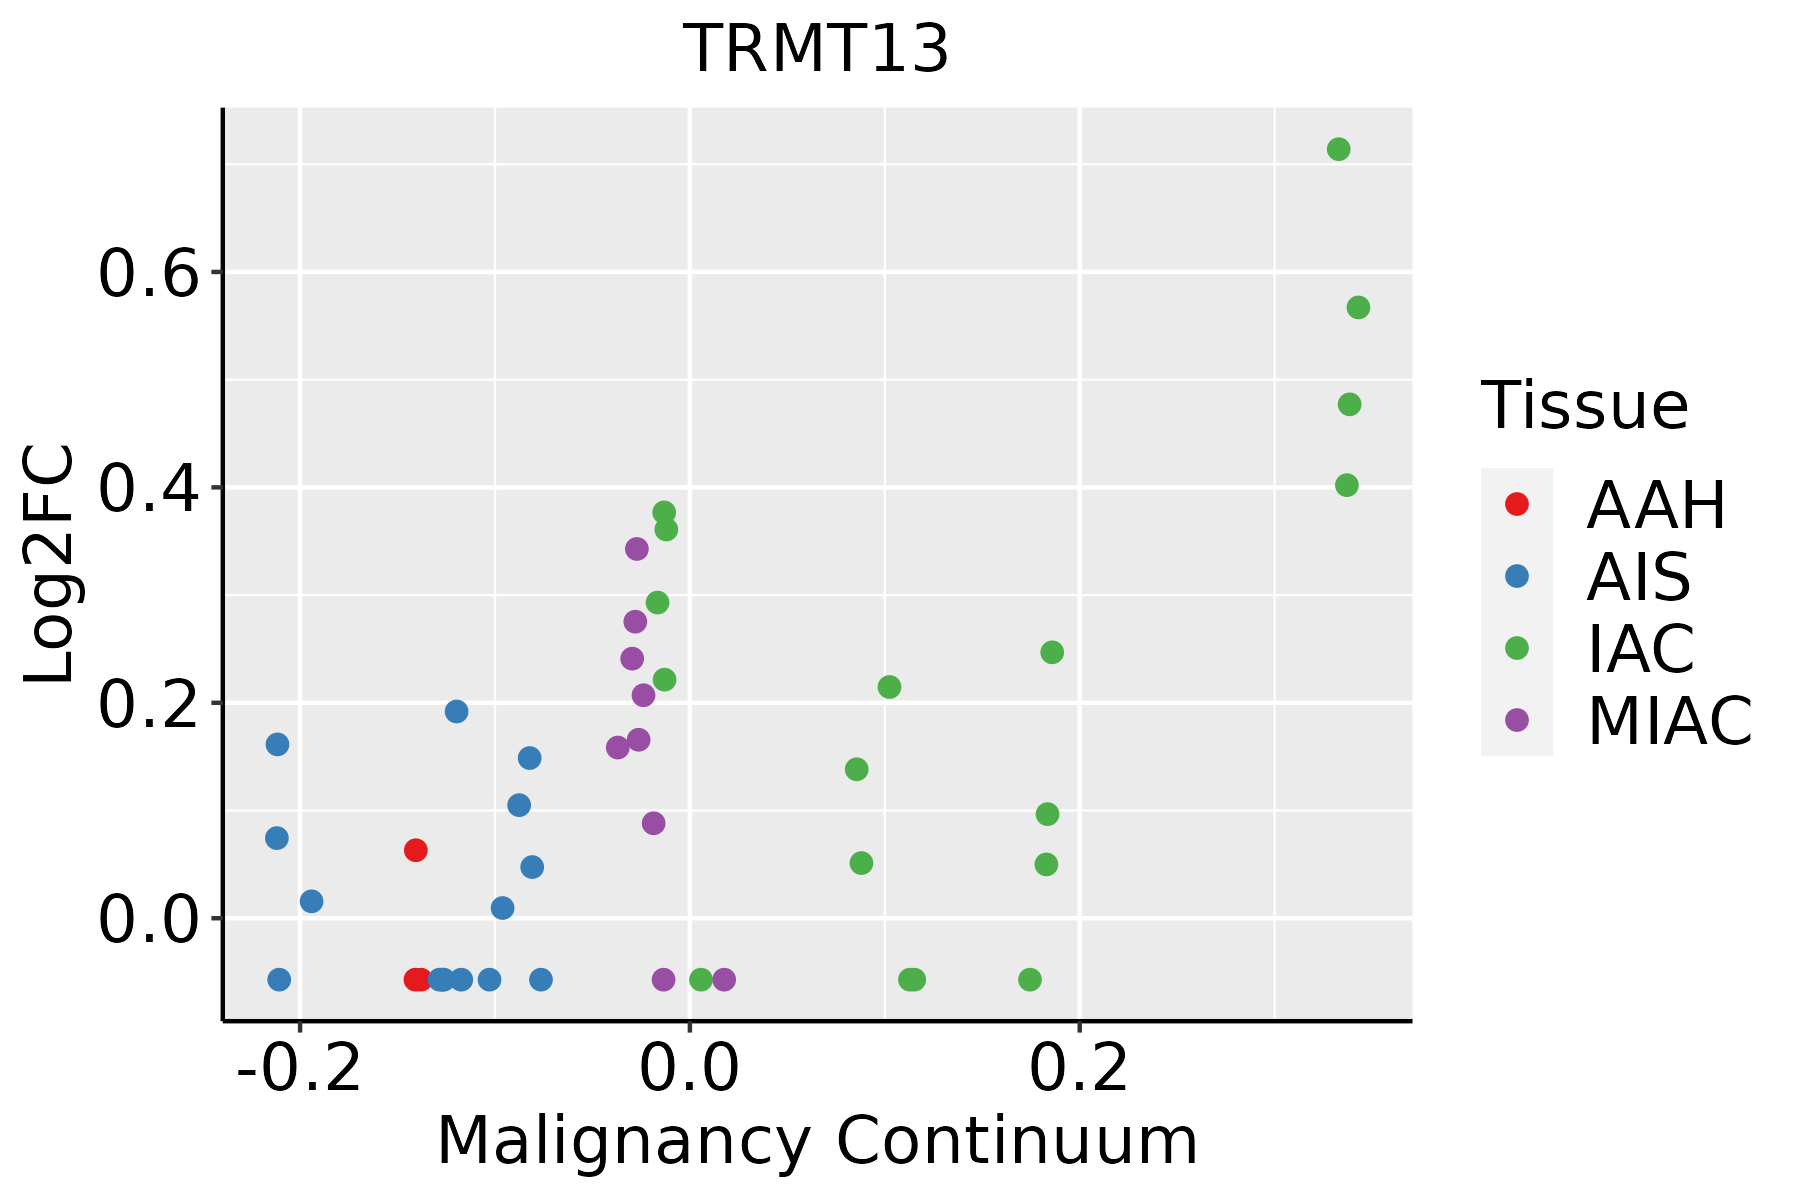 | AAH: Atypical adenomatous hyperplasia |
| AIS: Adenocarcinoma in situ | ||
| IAC: Invasive lung adenocarcinoma | ||
| MIA: Minimally invasive adenocarcinoma |
| ∗log2FC in expression of this searched gene in stem-like cells from each diseased tissue sample relative to stem-like cells in normal samples in each tissue plotted against the malignancy continuum. Samples are colored based on if they are from different disease stage. |
Top |
Malignant transformation related pathway analysis |
| Find out the enriched GO biological processes and KEGG pathways involved in transition from healthy to precancer to cancer |
| Tissue | Disease Stage | Enriched GO biological Processes |
| Colorectum | AD |  |
| Colorectum | SER |  |
| Colorectum | MSS |  |
| Colorectum | MSI-H |  |
| Colorectum | FAP |  |
| ∗Top 15 enriched GO BP terms are showed in the bar plot of each disease state in each tissue. Each row represents a significant GO biological process which is colored according to the -log10(p.adjust). |
| Page: 1 2 3 4 5 6 7 8 9 |
| GO ID | Tissue | Disease Stage | Description | Gene Ratio | Bg Ratio | pvalue | p.adjust | Count |
| GO:00344702 | Liver | HCC | ncRNA processing | 293/7958 | 395/18723 | 4.26e-38 | 6.76e-35 | 293 |
| GO:00346601 | Liver | HCC | ncRNA metabolic process | 332/7958 | 485/18723 | 1.48e-31 | 7.80e-29 | 332 |
| GO:0008033 | Liver | HCC | tRNA processing | 87/7958 | 127/18723 | 2.66e-09 | 7.23e-08 | 87 |
| GO:00434141 | Liver | HCC | macromolecule methylation | 183/7958 | 316/18723 | 2.00e-08 | 4.72e-07 | 183 |
| GO:0032259 | Liver | HCC | methylation | 206/7958 | 364/18723 | 3.35e-08 | 7.53e-07 | 206 |
| GO:0006399 | Liver | HCC | tRNA metabolic process | 108/7958 | 179/18723 | 1.07e-06 | 1.59e-05 | 108 |
| GO:0009451 | Liver | HCC | RNA modification | 101/7958 | 167/18723 | 2.02e-06 | 2.78e-05 | 101 |
| GO:0006400 | Liver | HCC | tRNA modification | 60/7958 | 90/18723 | 3.09e-06 | 4.09e-05 | 60 |
| GO:0001510 | Liver | HCC | RNA methylation | 53/7958 | 83/18723 | 6.96e-05 | 6.29e-04 | 53 |
| GO:0030488 | Liver | HCC | tRNA methylation | 29/7958 | 41/18723 | 2.38e-04 | 1.79e-03 | 29 |
| Page: 1 |
| Pathway ID | Tissue | Disease Stage | Description | Gene Ratio | Bg Ratio | pvalue | p.adjust | qvalue | Count |
| Page: 1 |
Top |
Cell-cell communication analysis |
| Identification of potential cell-cell interactions between two cell types and their ligand-receptor pairs for different disease states |
| Ligand | Receptor | LRpair | Pathway | Tissue | Disease Stage |
| Page: 1 |
Top |
Single-cell gene regulatory network inference analysis |
| Find out the significant the regulons (TFs) and the target genes of each regulon across cell types for different disease states |
| TF | Cell Type | Tissue | Disease Stage | Target Gene | RSS | Regulon Activity |
| ∗The dot plots of a searched regulon are shown for all cell subpopulations in each disease state of each tissue based on the regulon specific score inferred using pySCENIC and by calculating the average expression. |
| Page: 1 |
Top |
Somatic mutation of malignant transformation related genes |
| Annotation of somatic variants for genes involved in malignant transformation |
| Hugo Symbol | Variant Class | Variant Classification | dbSNP RS | HGVSc | HGVSp | HGVSp Short | SWISSPROT | BIOTYPE | SIFT | PolyPhen | Tumor Sample Barcode | Tissue | Histology | Sex | Age | Stage | Therapy Types | Drugs | Outcome |
| TRMT13 | SNV | Missense_Mutation | c.841N>A | p.Glu281Lys | p.E281K | Q9NUP7 | protein_coding | deleterious(0.01) | probably_damaging(0.913) | TCGA-AC-A5XS-01 | Breast | breast invasive carcinoma | Female | >=65 | I/II | Hormone Therapy | femara | SD | |
| TRMT13 | SNV | Missense_Mutation | novel | c.964N>A | p.Glu322Lys | p.E322K | Q9NUP7 | protein_coding | tolerated(0.15) | benign(0.265) | TCGA-BH-A2L8-01 | Breast | breast invasive carcinoma | Female | <65 | I/II | Chemotherapy | cytoxan | CR |
| TRMT13 | SNV | Missense_Mutation | c.523N>A | p.Glu175Lys | p.E175K | Q9NUP7 | protein_coding | deleterious(0.03) | probably_damaging(0.979) | TCGA-D8-A1Y1-01 | Breast | breast invasive carcinoma | Female | >=65 | III/IV | Hormone Therapy | tamoxiphen | PD | |
| TRMT13 | insertion | Frame_Shift_Ins | novel | c.413_414insAAAC | p.Asp139AsnfsTer15 | p.D139Nfs*15 | Q9NUP7 | protein_coding | TCGA-AR-A0U0-01 | Breast | breast invasive carcinoma | Female | >=65 | I/II | Unknown | Unknown | SD | ||
| TRMT13 | insertion | Frame_Shift_Ins | novel | c.415_416insACTTGAGACAAAA | p.His140LeufsTer17 | p.H140Lfs*17 | Q9NUP7 | protein_coding | TCGA-AR-A0U0-01 | Breast | breast invasive carcinoma | Female | >=65 | I/II | Unknown | Unknown | SD | ||
| TRMT13 | deletion | Frame_Shift_Del | c.53delG | p.Arg18AsnfsTer44 | p.R18Nfs*44 | Q9NUP7 | protein_coding | TCGA-D8-A27V-01 | Breast | breast invasive carcinoma | Female | <65 | I/II | Hormone Therapy | tamoxiphen | SD | |||
| TRMT13 | deletion | Frame_Shift_Del | c.300delT | p.Asp100GlufsTer9 | p.D100Efs*9 | Q9NUP7 | protein_coding | TCGA-EW-A2FV-01 | Breast | breast invasive carcinoma | Female | <65 | III/IV | Chemotherapy | docetaxel | SD | |||
| TRMT13 | deletion | Frame_Shift_Del | novel | c.1181delA | p.Asn394MetfsTer34 | p.N394Mfs*34 | Q9NUP7 | protein_coding | TCGA-EW-A2FV-01 | Breast | breast invasive carcinoma | Female | <65 | III/IV | Chemotherapy | docetaxel | SD | ||
| TRMT13 | SNV | Missense_Mutation | c.673G>C | p.Asp225His | p.D225H | Q9NUP7 | protein_coding | deleterious(0) | probably_damaging(1) | TCGA-FU-A23K-01 | Cervix | cervical & endocervical cancer | Female | <65 | III/IV | Unknown | Unknown | SD | |
| TRMT13 | SNV | Missense_Mutation | rs779650558 | c.893N>A | p.Arg298His | p.R298H | Q9NUP7 | protein_coding | deleterious(0.02) | probably_damaging(0.98) | TCGA-VS-A94Z-01 | Cervix | cervical & endocervical cancer | Female | <65 | I/II | Chemotherapy | cisplatin | CR |
| Page: 1 2 3 4 5 6 7 |
Top |
Related drugs of malignant transformation related genes |
| Identification of chemicals and drugs interact with genes involved in malignant transfromation |
| (DGIdb 4.0) |
| Entrez ID | Symbol | Category | Interaction Types | Drug Claim Name | Drug Name | PMIDs |
| Page: 1 |

Copyright 2023-Present -The University of Texas Health Science Center at Houston |