
|
|||||
|
 | |
| |
| |
| |
| |
| |
|
Gene: TRMT112 |
Gene summary for TRMT112 |
| Gene information | Species | Human | Gene symbol | TRMT112 | Gene ID | 51504 |
| Gene name | tRNA methyltransferase activator subunit 11-2 | |
| Gene Alias | HSPC152 | |
| Cytomap | 11q13.1 | |
| Gene Type | protein-coding | GO ID | GO:0000154 | UniProtAcc | Q9UI30 |
Top |
Malignant transformation analysis |
| Identification of the aberrant gene expression in precancerous and cancerous lesions by comparing the gene expression of stem-like cells in diseased tissues with normal stem cells |
| Entrez ID | Symbol | Replicates | Species | Organ | Tissue | Adj P-value | Log2FC | Malignancy |
| 51504 | TRMT112 | GSM4909286 | Human | Breast | IDC | 3.26e-09 | -1.30e-01 | 0.1081 |
| 51504 | TRMT112 | GSM4909289 | Human | Breast | IDC | 4.08e-02 | 3.26e-01 | 0.1064 |
| 51504 | TRMT112 | GSM4909290 | Human | Breast | IDC | 1.01e-27 | 5.84e-01 | 0.2096 |
| 51504 | TRMT112 | GSM4909291 | Human | Breast | IDC | 2.57e-18 | 4.80e-01 | 0.1753 |
| 51504 | TRMT112 | GSM4909294 | Human | Breast | IDC | 4.04e-09 | 1.64e-01 | 0.2022 |
| 51504 | TRMT112 | GSM4909296 | Human | Breast | IDC | 1.63e-30 | 4.15e-01 | 0.1524 |
| 51504 | TRMT112 | GSM4909297 | Human | Breast | IDC | 4.74e-21 | -7.48e-02 | 0.1517 |
| 51504 | TRMT112 | GSM4909301 | Human | Breast | IDC | 4.27e-15 | 3.89e-01 | 0.1577 |
| 51504 | TRMT112 | GSM4909302 | Human | Breast | IDC | 1.07e-03 | 8.60e-02 | 0.1545 |
| 51504 | TRMT112 | GSM4909307 | Human | Breast | IDC | 2.52e-11 | 3.88e-01 | 0.1569 |
| 51504 | TRMT112 | GSM4909308 | Human | Breast | IDC | 1.33e-19 | 4.43e-01 | 0.158 |
| 51504 | TRMT112 | GSM4909309 | Human | Breast | IDC | 1.73e-21 | 3.45e-01 | 0.0483 |
| 51504 | TRMT112 | GSM4909311 | Human | Breast | IDC | 4.75e-53 | -1.75e-01 | 0.1534 |
| 51504 | TRMT112 | GSM4909312 | Human | Breast | IDC | 2.91e-19 | 1.88e-02 | 0.1552 |
| 51504 | TRMT112 | GSM4909313 | Human | Breast | IDC | 1.32e-03 | -6.79e-02 | 0.0391 |
| 51504 | TRMT112 | GSM4909316 | Human | Breast | IDC | 1.62e-03 | 1.34e-01 | 0.21 |
| 51504 | TRMT112 | GSM4909318 | Human | Breast | IDC | 3.34e-10 | 3.90e-01 | 0.2031 |
| 51504 | TRMT112 | GSM4909319 | Human | Breast | IDC | 6.47e-70 | -1.20e-01 | 0.1563 |
| 51504 | TRMT112 | GSM4909320 | Human | Breast | IDC | 8.65e-19 | 3.65e-01 | 0.1575 |
| 51504 | TRMT112 | GSM4909321 | Human | Breast | IDC | 9.48e-25 | 2.93e-01 | 0.1559 |
| Page: 1 2 3 4 5 6 7 8 9 10 11 12 |
| Tissue | Expression Dynamics | Abbreviation |
| Breast | 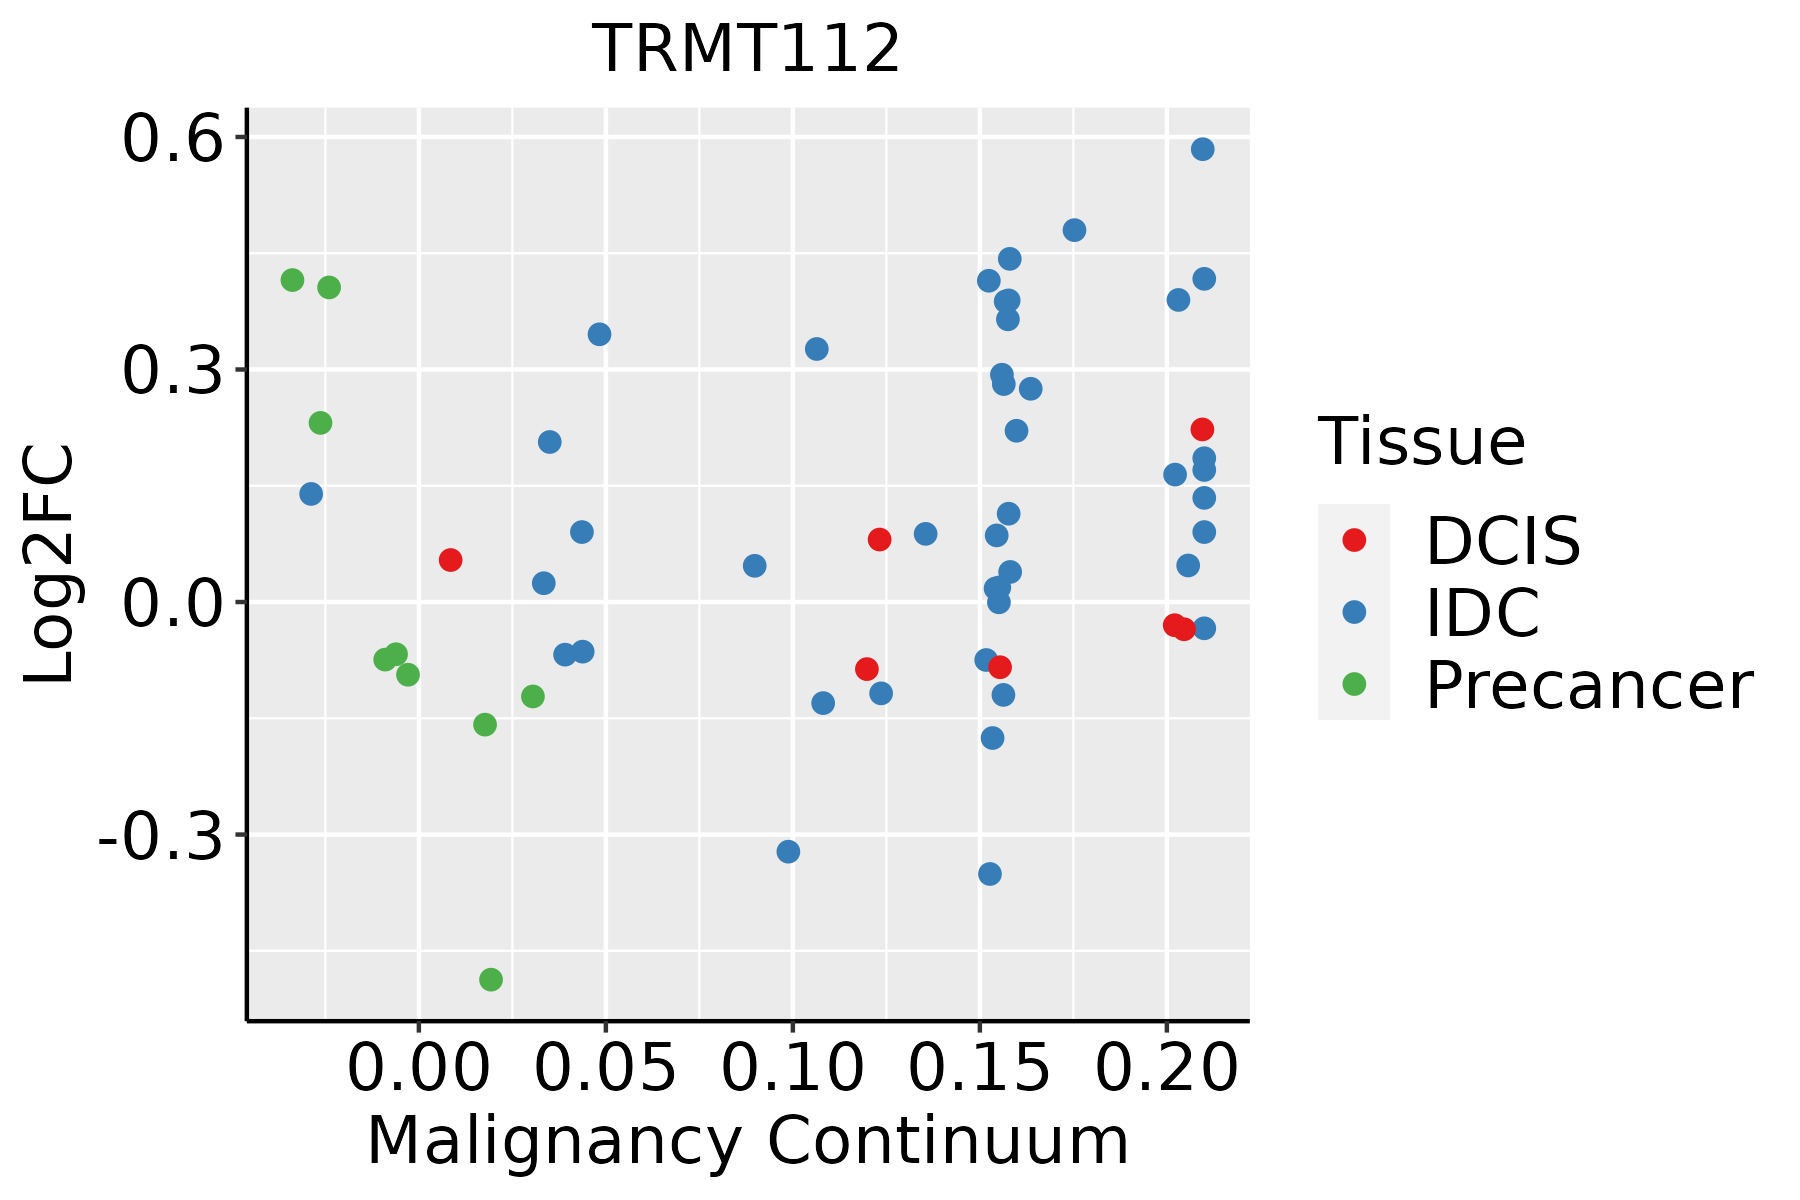 | IDC: Invasive ductal carcinoma |
| DCIS: Ductal carcinoma in situ | ||
| Precancer(BRCA1-mut): Precancerous lesion from BRCA1 mutation carriers | ||
| Cervix | 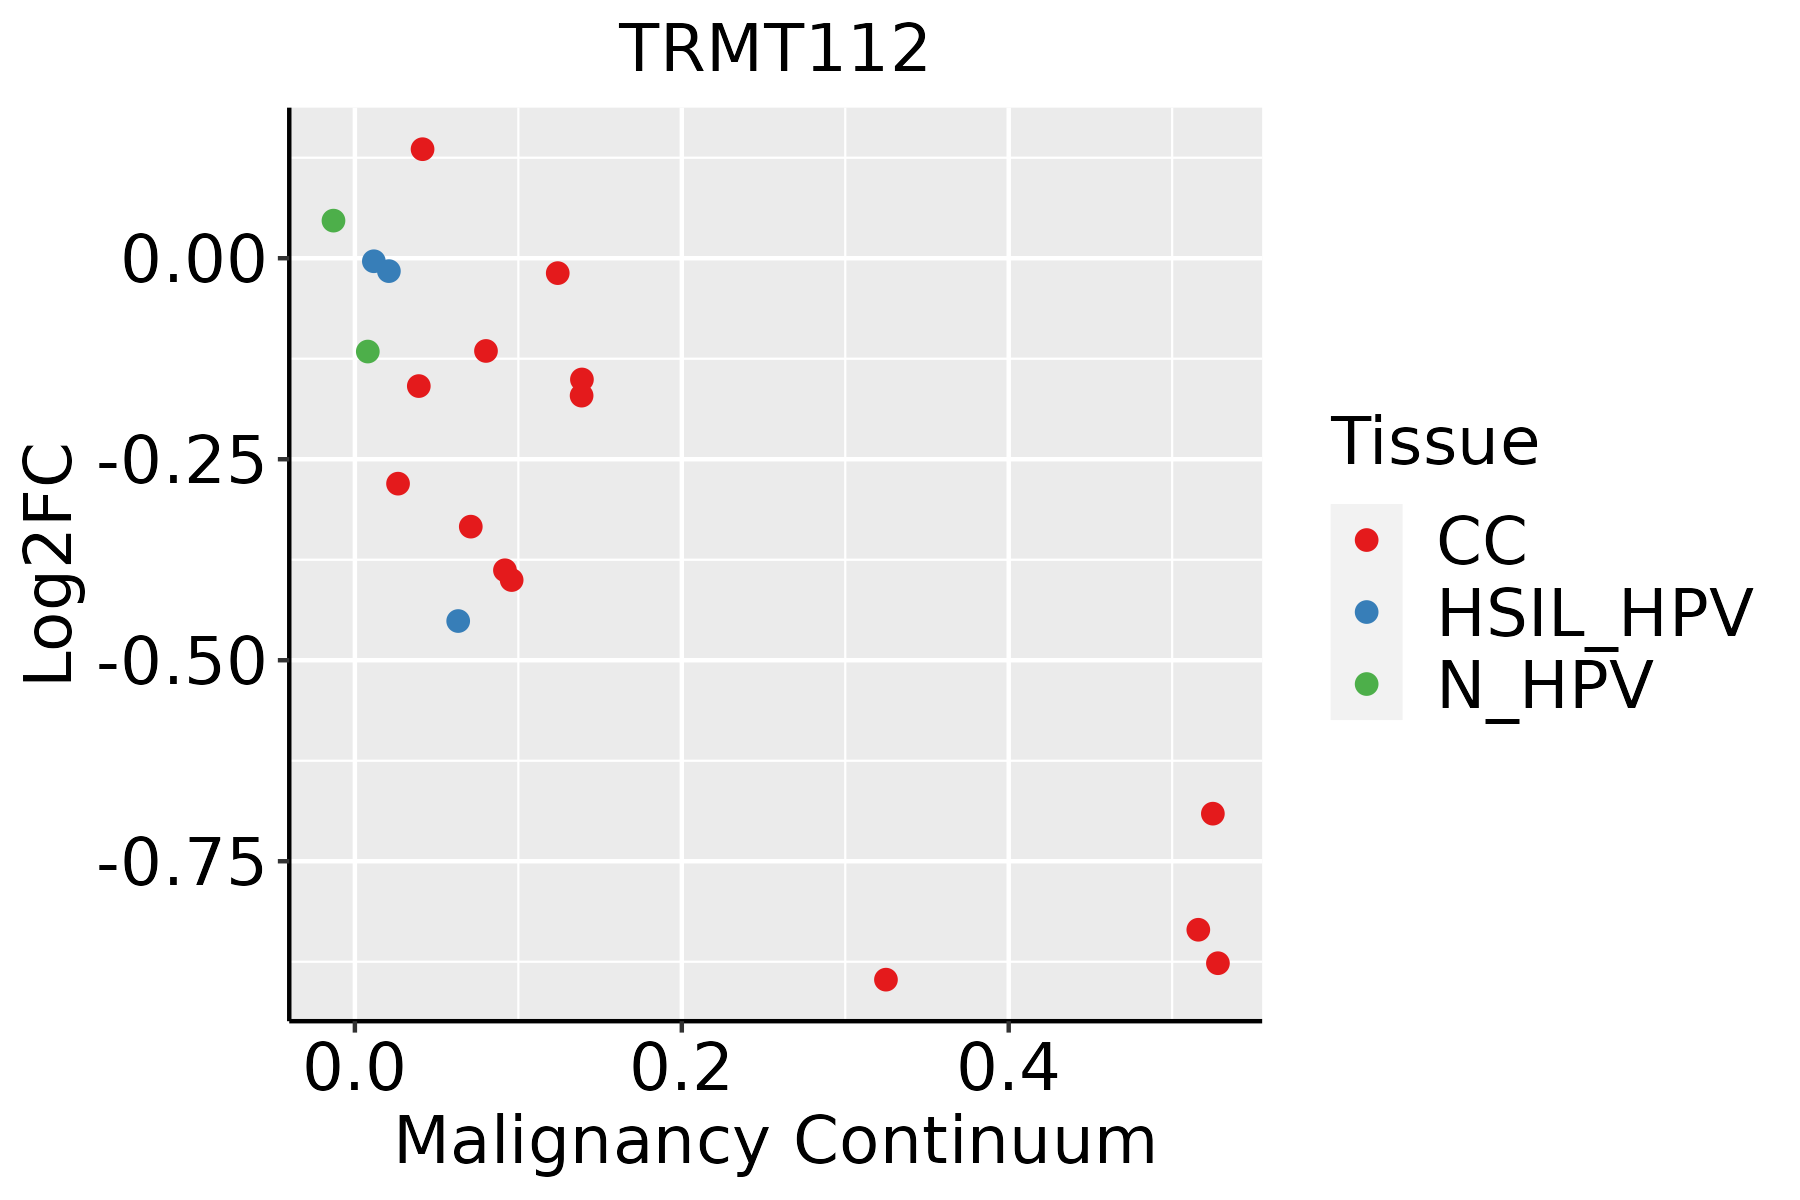 | CC: Cervix cancer |
| HSIL_HPV: HPV-infected high-grade squamous intraepithelial lesions | ||
| N_HPV: HPV-infected normal cervix | ||
| Endometrium | 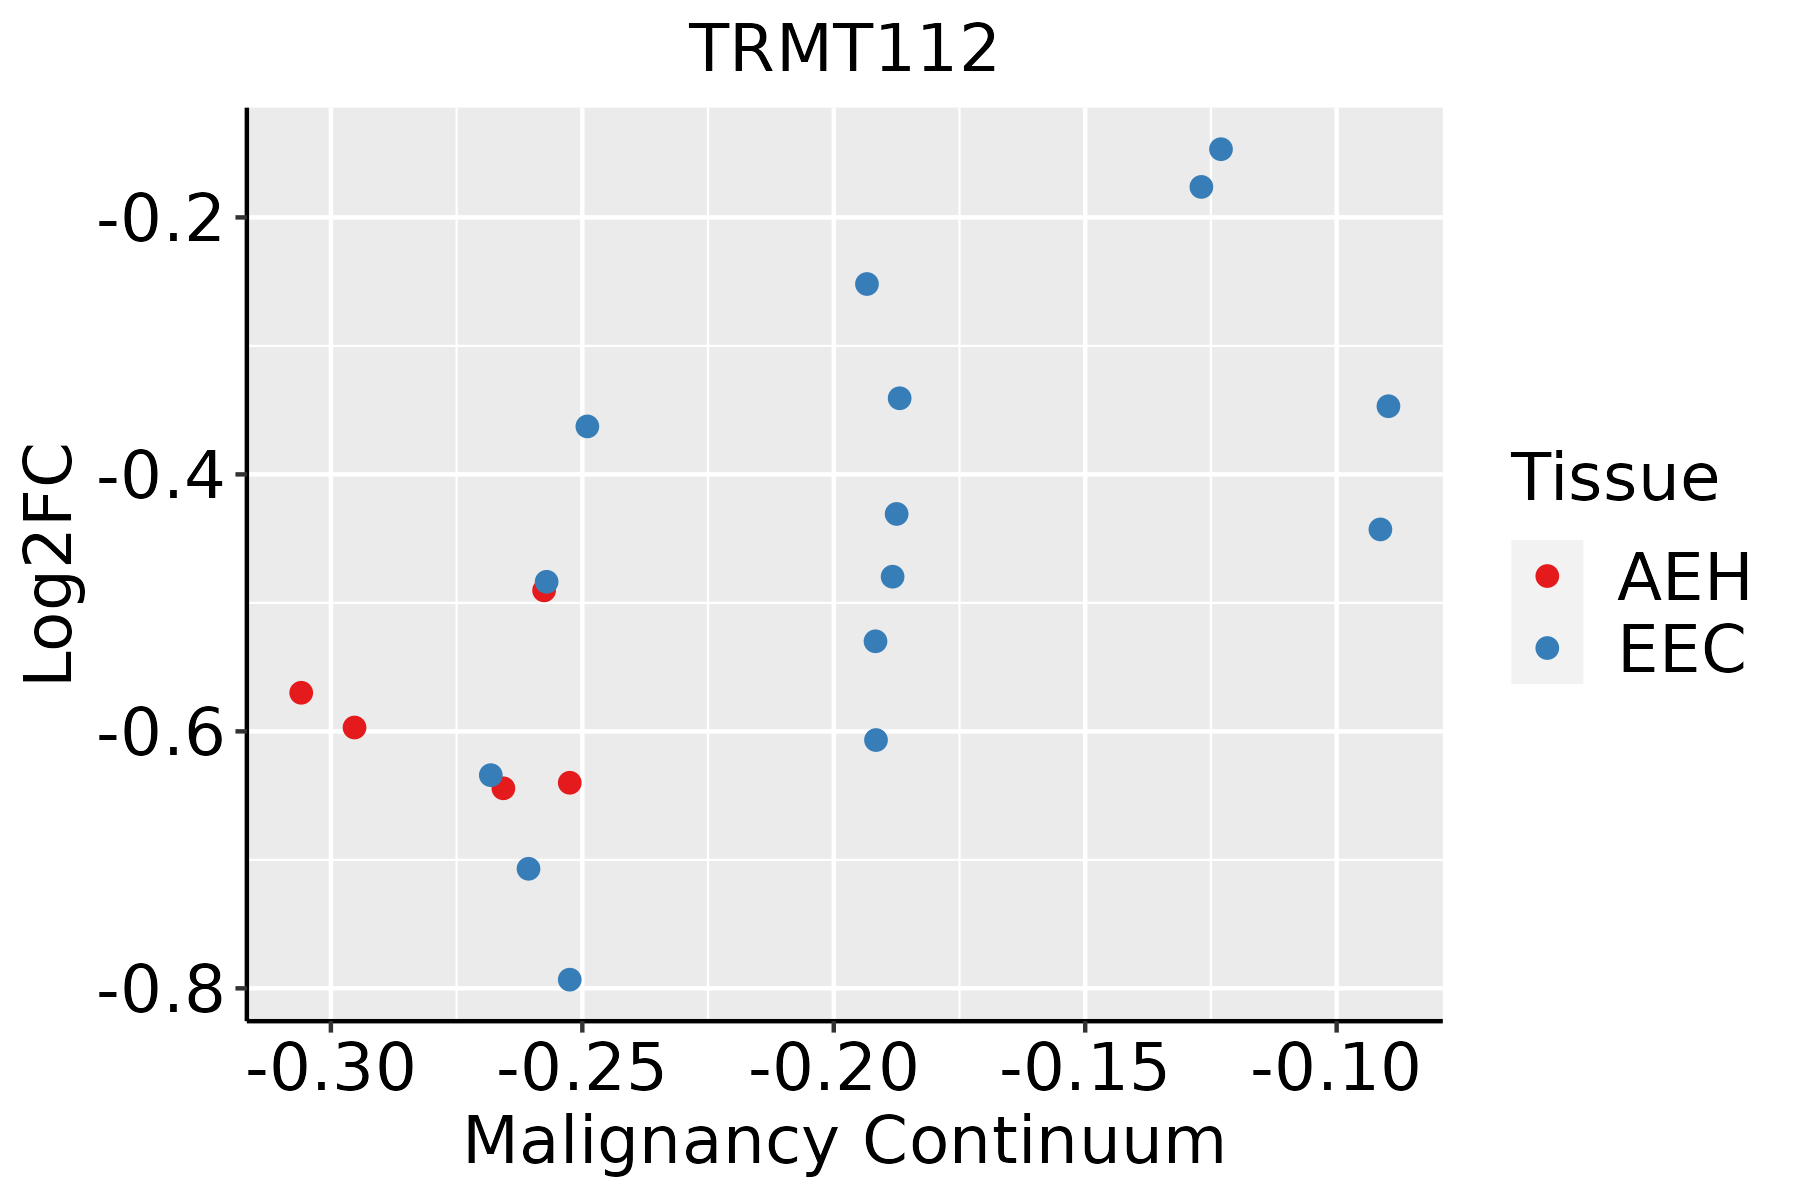 | AEH: Atypical endometrial hyperplasia |
| EEC: Endometrioid Cancer | ||
| Esophagus | 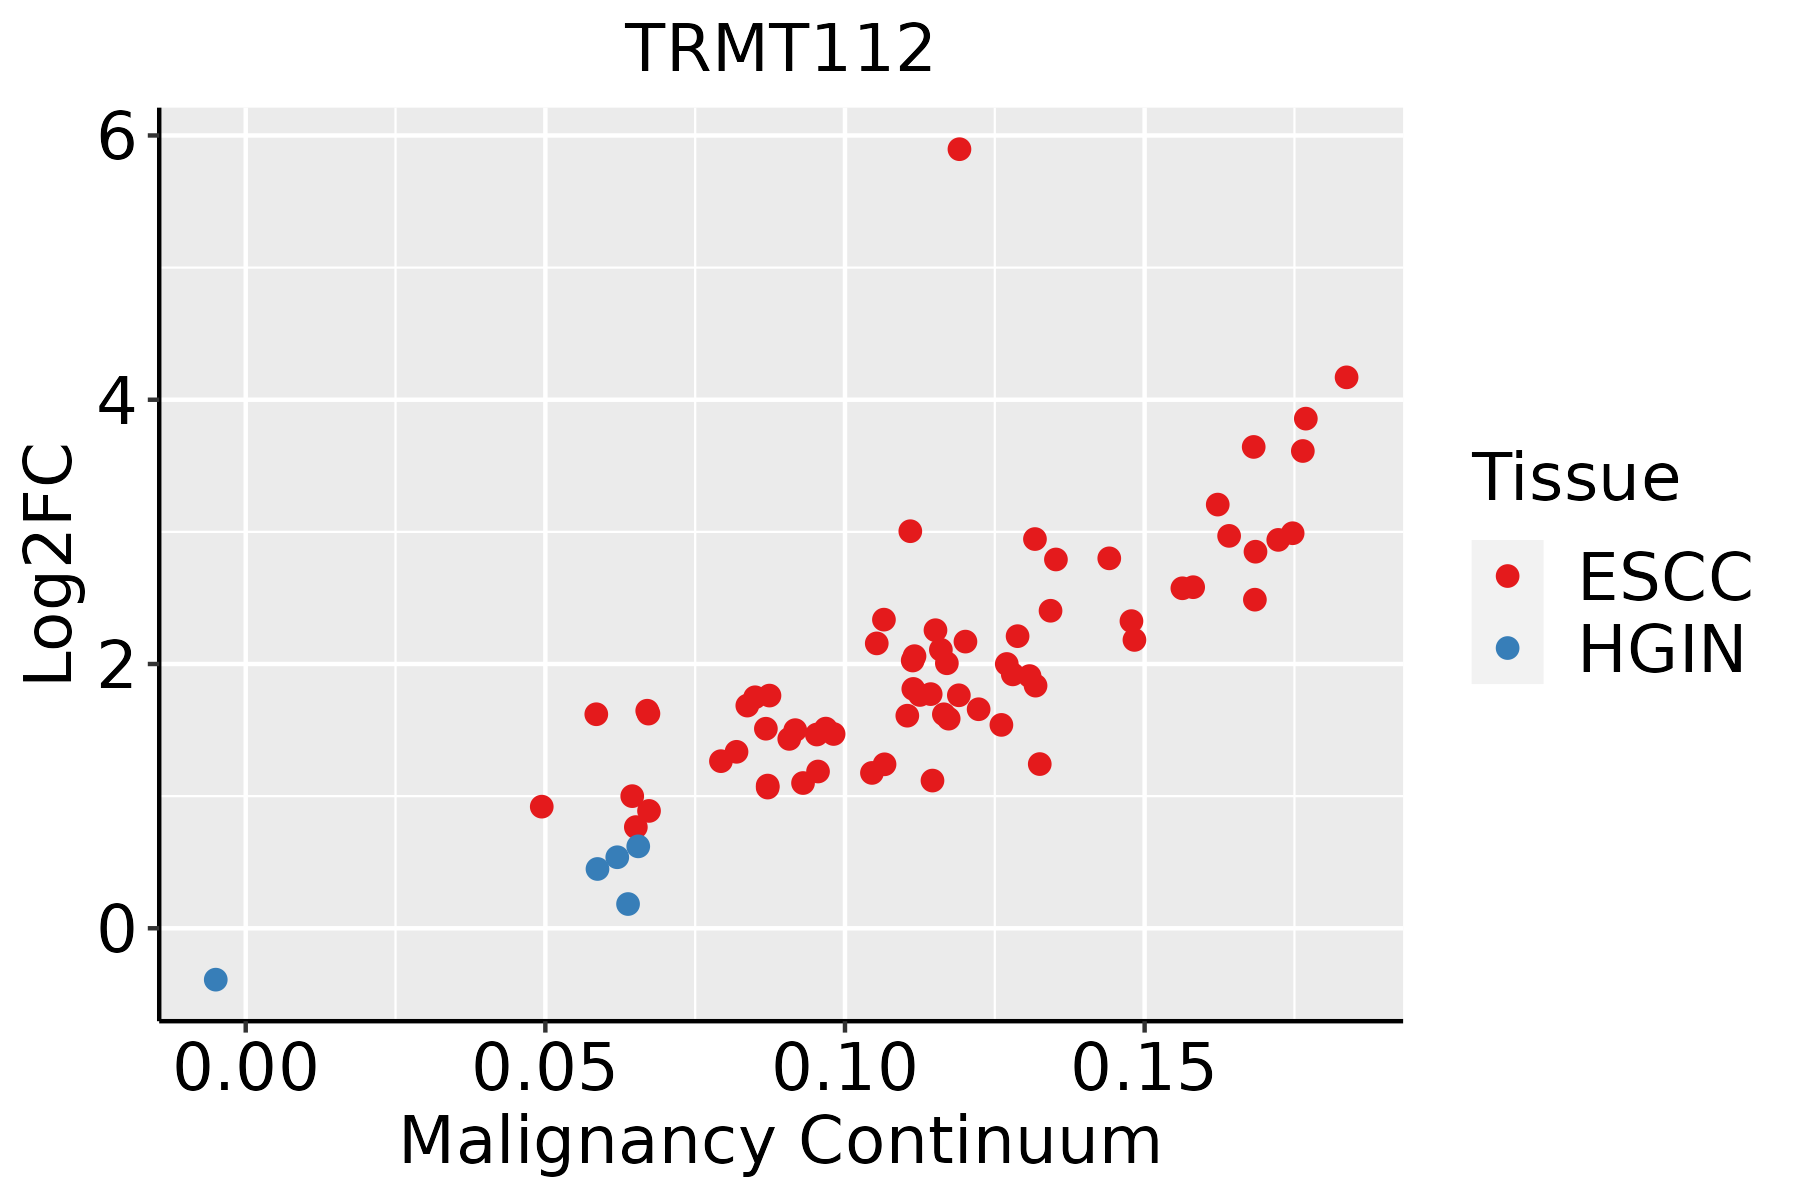 | ESCC: Esophageal squamous cell carcinoma |
| HGIN: High-grade intraepithelial neoplasias | ||
| LGIN: Low-grade intraepithelial neoplasias | ||
| Liver | 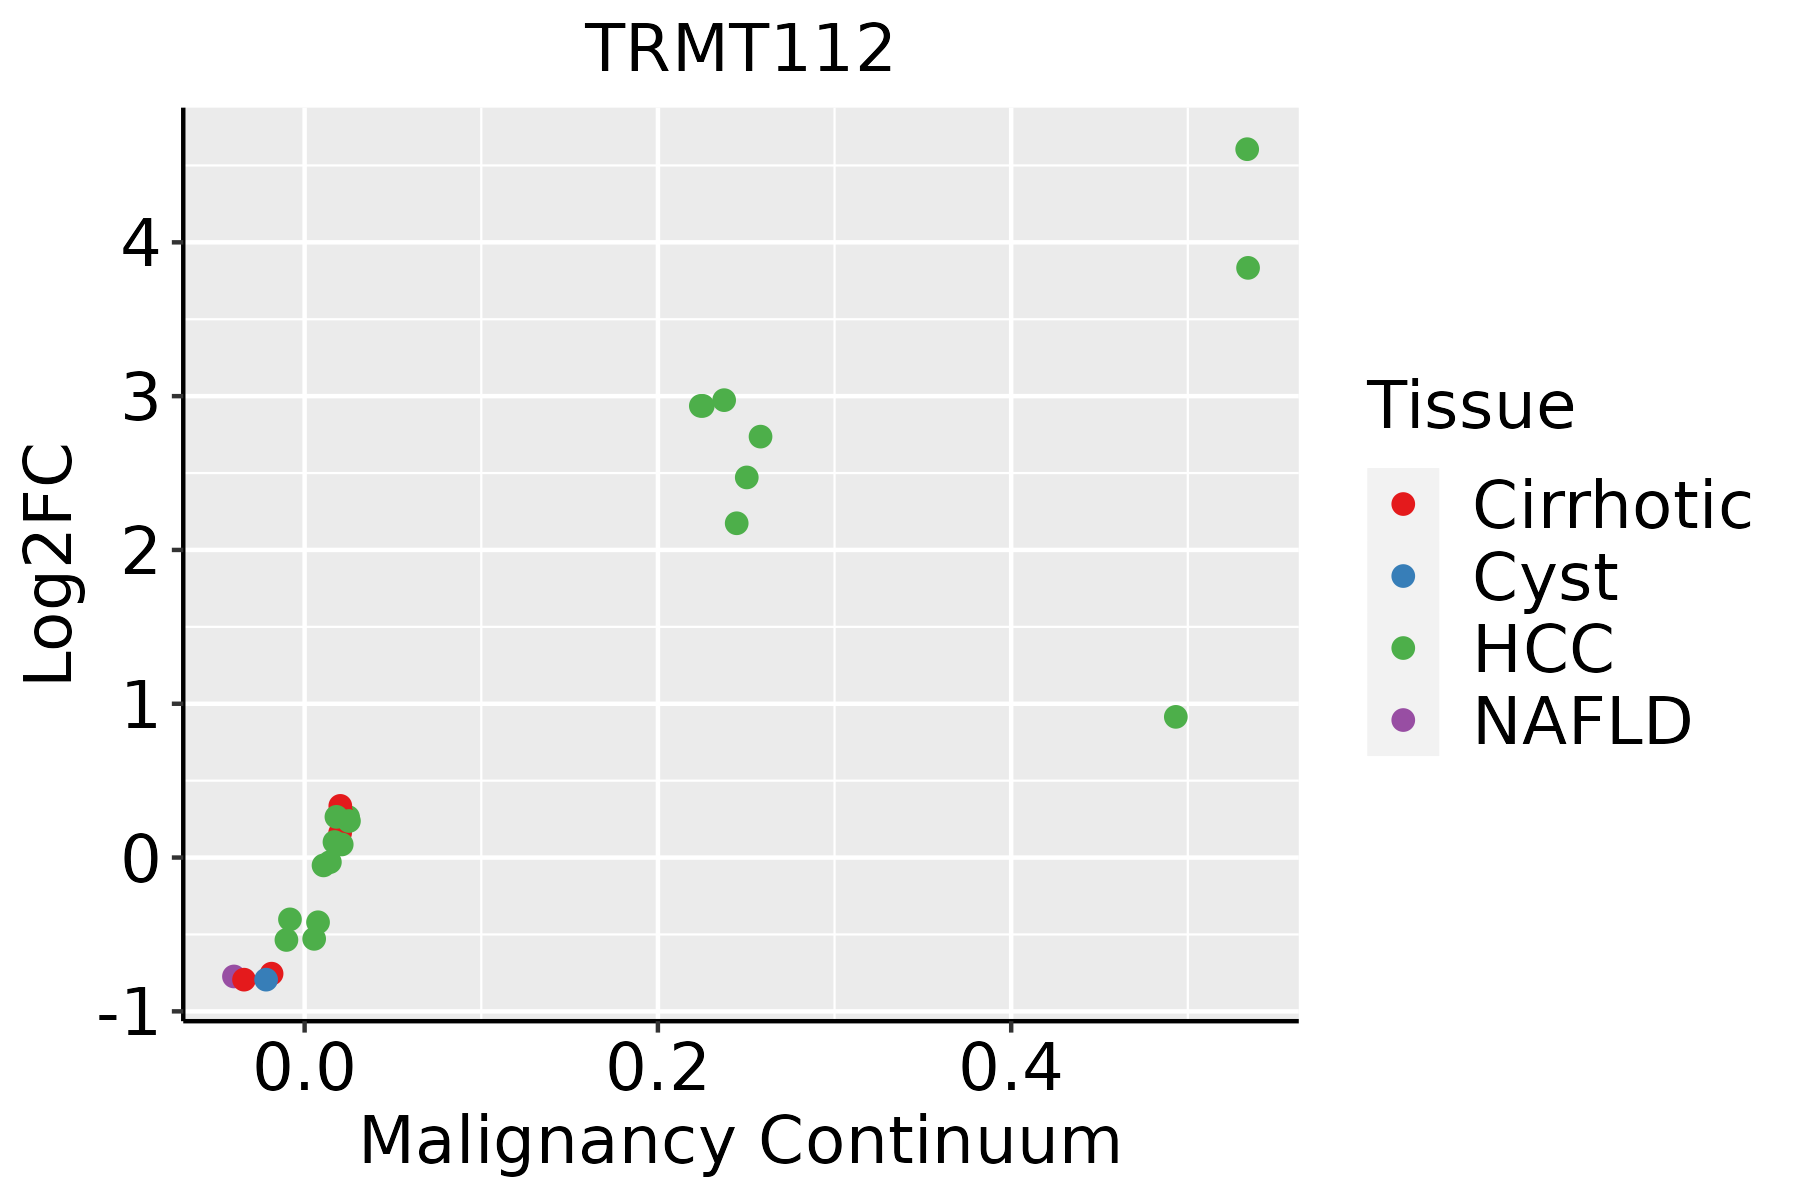 | HCC: Hepatocellular carcinoma |
| NAFLD: Non-alcoholic fatty liver disease | ||
| Oral Cavity | 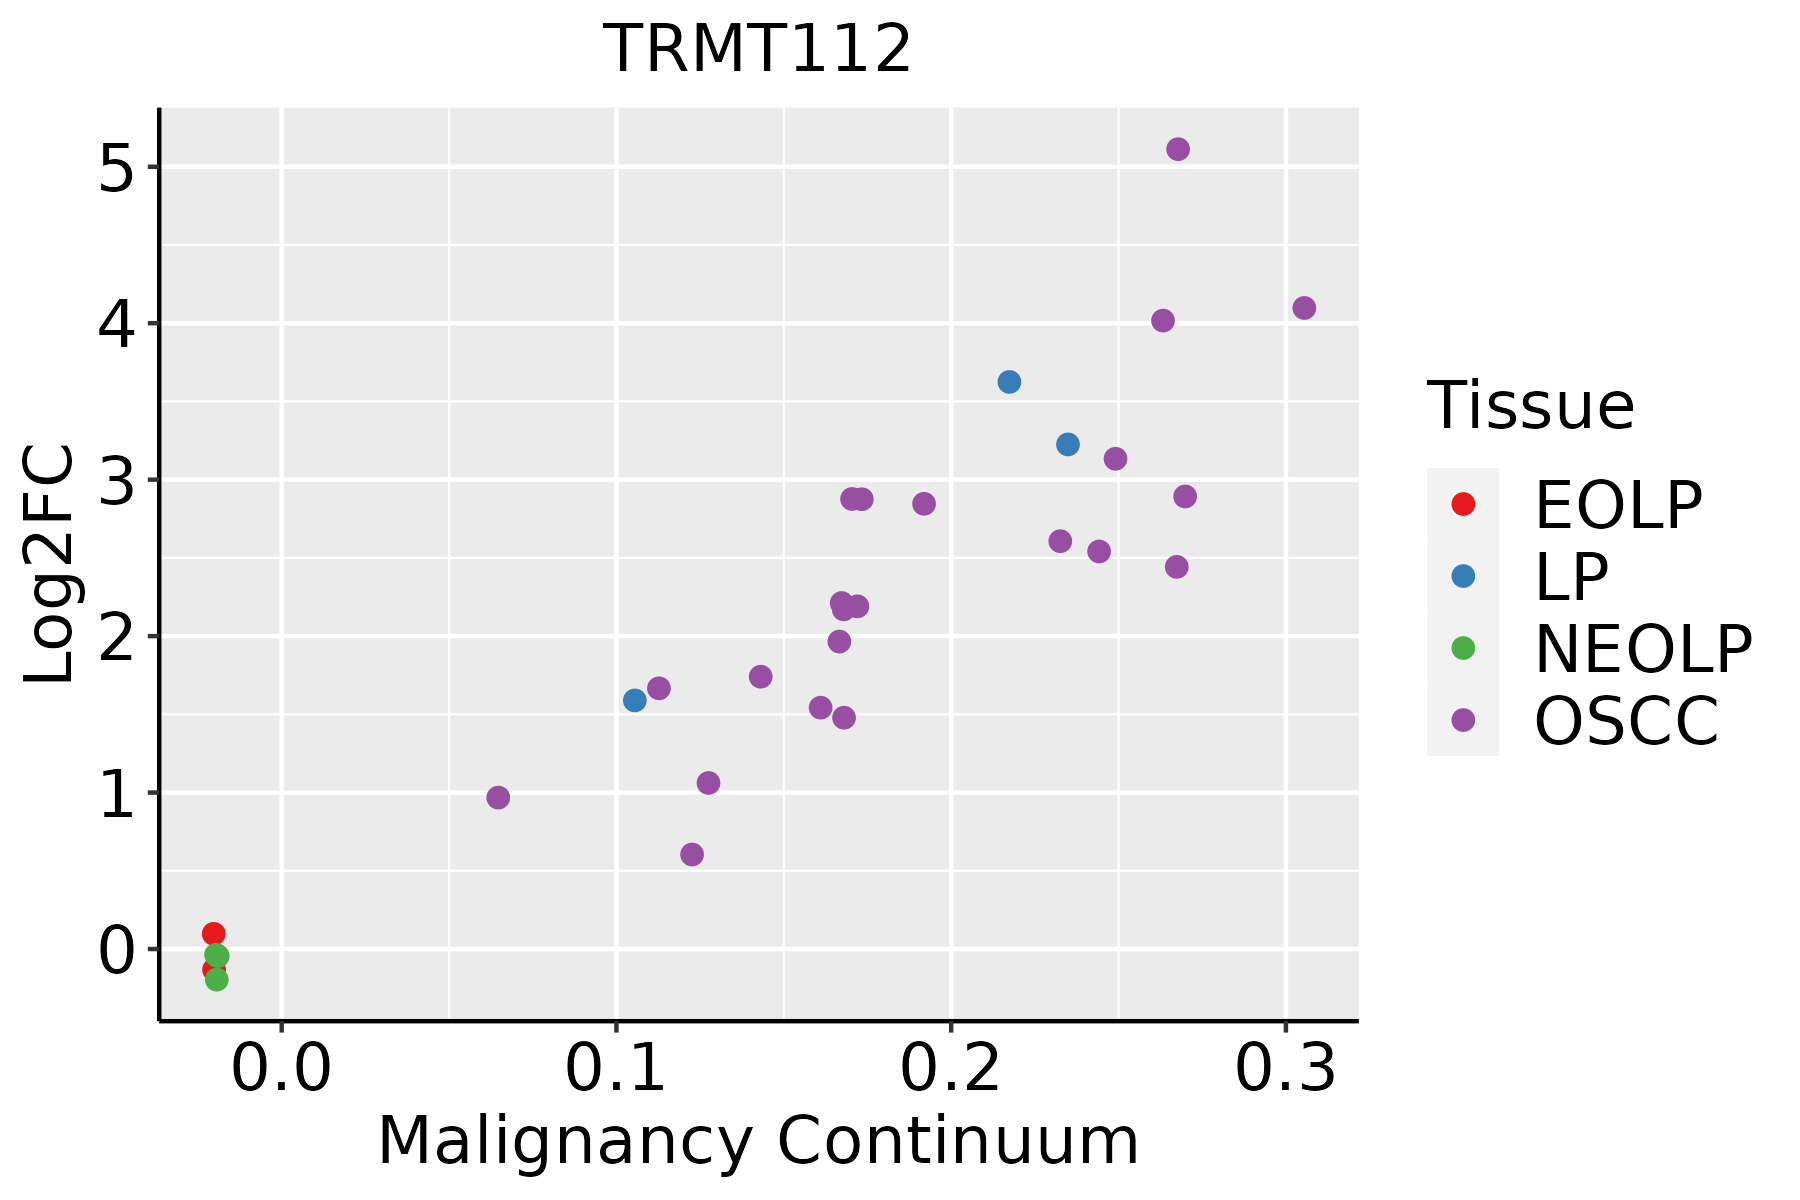 | EOLP: Erosive Oral lichen planus |
| LP: leukoplakia | ||
| NEOLP: Non-erosive oral lichen planus | ||
| OSCC: Oral squamous cell carcinoma | ||
| Prostate | 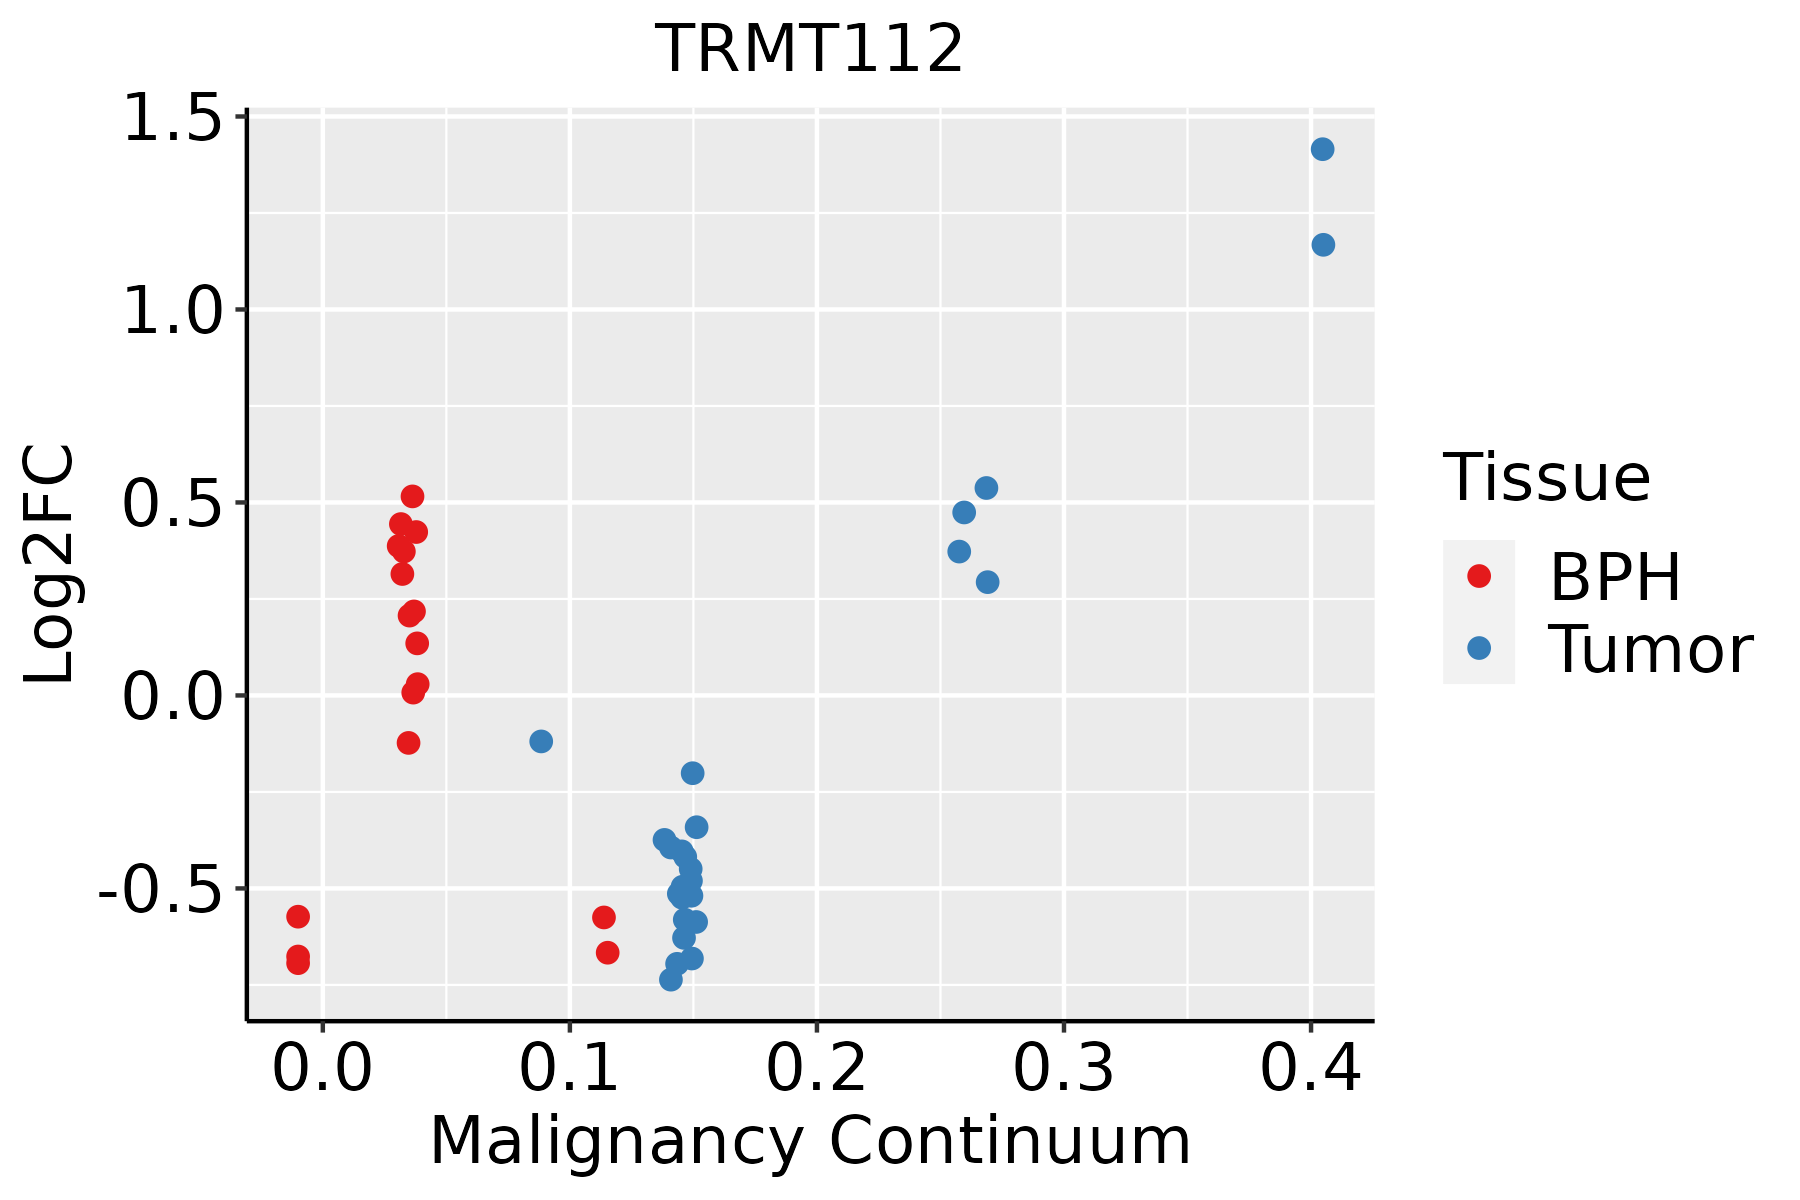 | BPH: Benign Prostatic Hyperplasia |
| Skin |  | AK: Actinic keratosis |
| cSCC: Cutaneous squamous cell carcinoma | ||
| SCCIS:squamous cell carcinoma in situ | ||
| Thyroid | 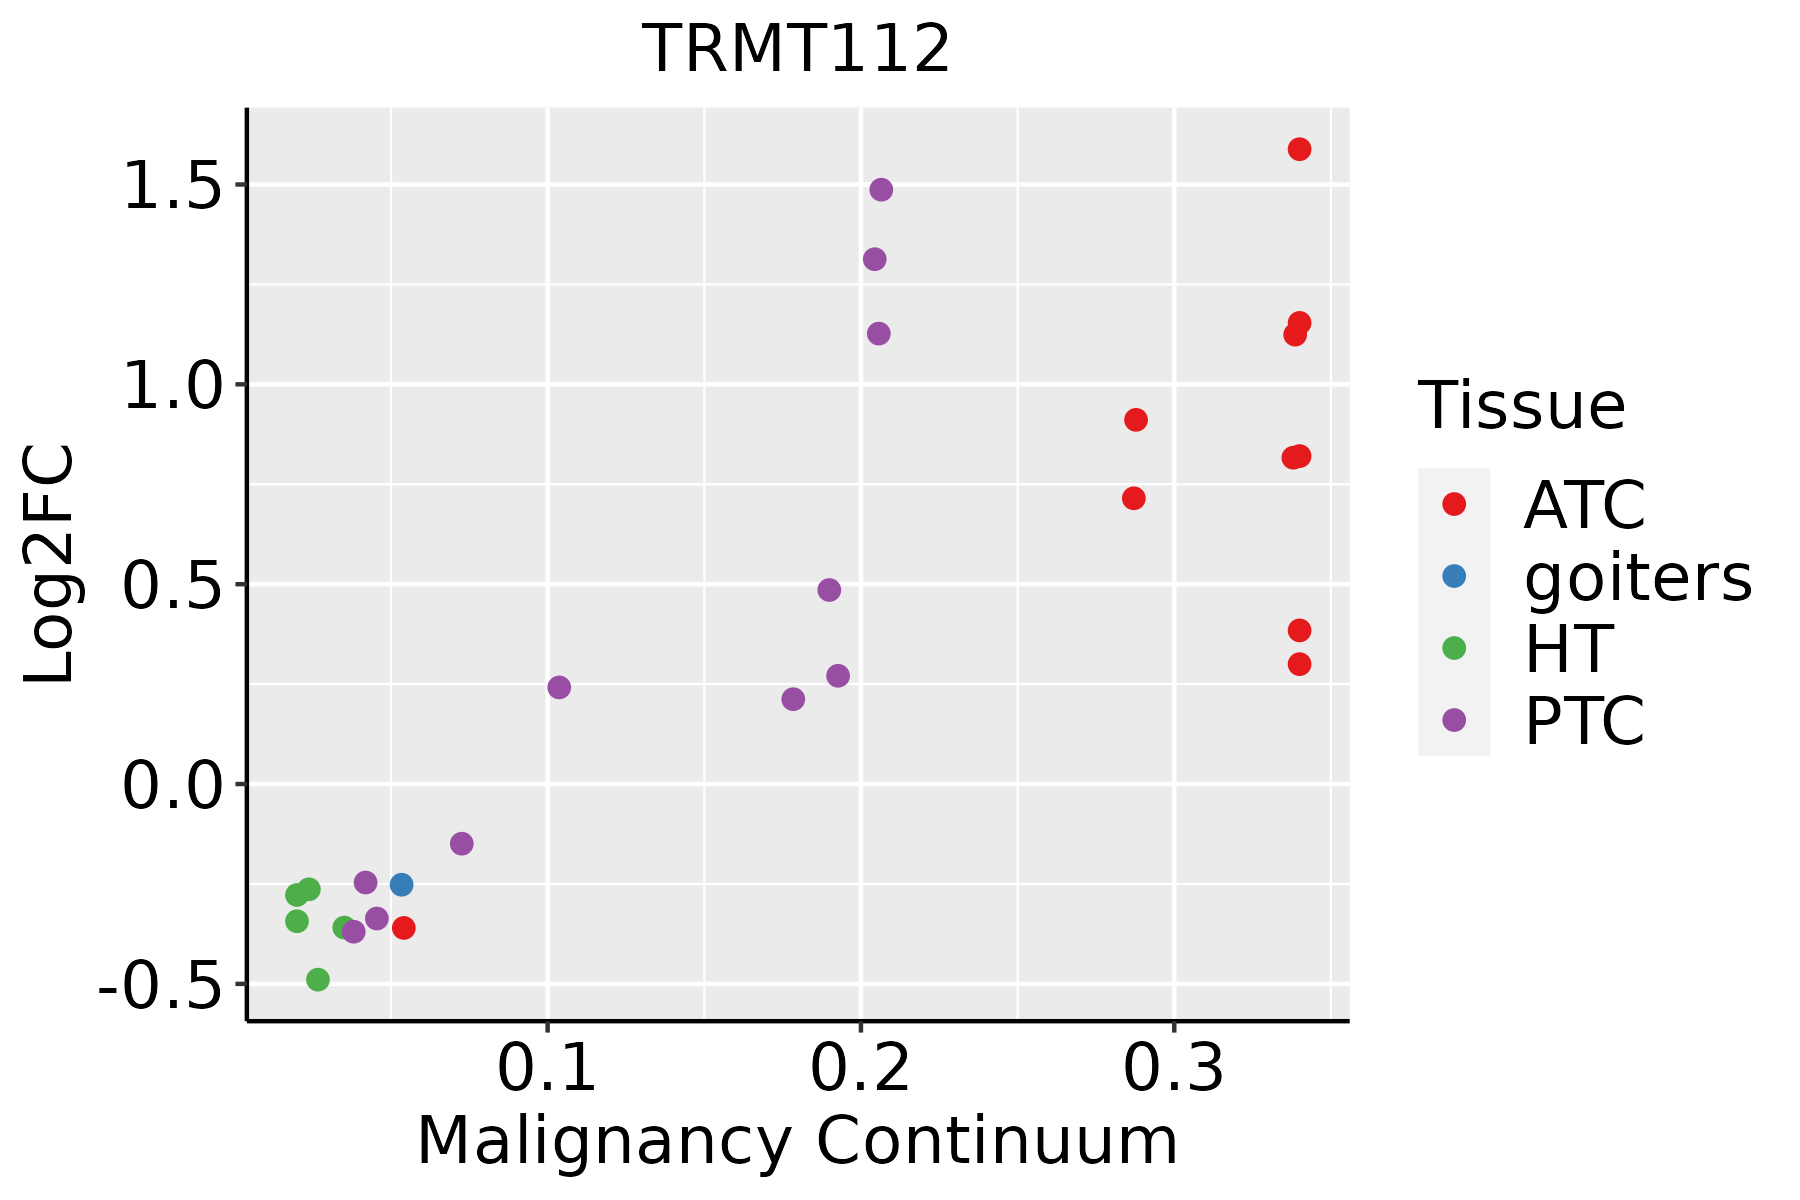 | ATC: Anaplastic thyroid cancer |
| HT: Hashimoto's thyroiditis | ||
| PTC: Papillary thyroid cancer |
| ∗log2FC in expression of this searched gene in stem-like cells from each diseased tissue sample relative to stem-like cells in normal samples in each tissue plotted against the malignancy continuum. Samples are colored based on if they are from different disease stage. |
Top |
Malignant transformation related pathway analysis |
| Find out the enriched GO biological processes and KEGG pathways involved in transition from healthy to precancer to cancer |
| Tissue | Disease Stage | Enriched GO biological Processes |
| Colorectum | AD |  |
| Colorectum | SER |  |
| Colorectum | MSS |  |
| Colorectum | MSI-H |  |
| Colorectum | FAP |  |
| ∗Top 15 enriched GO BP terms are showed in the bar plot of each disease state in each tissue. Each row represents a significant GO biological process which is colored according to the -log10(p.adjust). |
| Page: 1 2 3 4 5 6 7 8 9 |
| GO ID | Tissue | Disease Stage | Description | Gene Ratio | Bg Ratio | pvalue | p.adjust | Count |
| GO:00226139 | Breast | Precancer | ribonucleoprotein complex biogenesis | 79/1080 | 463/18723 | 2.11e-18 | 1.03e-15 | 79 |
| GO:00422549 | Breast | Precancer | ribosome biogenesis | 52/1080 | 299/18723 | 7.35e-13 | 1.51e-10 | 52 |
| GO:00063646 | Breast | Precancer | rRNA processing | 35/1080 | 225/18723 | 7.90e-08 | 4.60e-06 | 35 |
| GO:00160726 | Breast | Precancer | rRNA metabolic process | 36/1080 | 236/18723 | 8.59e-08 | 4.84e-06 | 36 |
| GO:00344705 | Breast | Precancer | ncRNA processing | 42/1080 | 395/18723 | 9.91e-05 | 1.83e-03 | 42 |
| GO:00346604 | Breast | Precancer | ncRNA metabolic process | 45/1080 | 485/18723 | 1.15e-03 | 1.26e-02 | 45 |
| GO:002261314 | Breast | IDC | ribonucleoprotein complex biogenesis | 83/1434 | 463/18723 | 2.01e-13 | 5.20e-11 | 83 |
| GO:004225414 | Breast | IDC | ribosome biogenesis | 52/1434 | 299/18723 | 1.90e-08 | 1.32e-06 | 52 |
| GO:000636414 | Breast | IDC | rRNA processing | 35/1434 | 225/18723 | 4.59e-05 | 1.03e-03 | 35 |
| GO:001607214 | Breast | IDC | rRNA metabolic process | 36/1434 | 236/18723 | 5.48e-05 | 1.17e-03 | 36 |
| GO:002261324 | Breast | DCIS | ribonucleoprotein complex biogenesis | 83/1390 | 463/18723 | 3.65e-14 | 1.09e-11 | 83 |
| GO:004225423 | Breast | DCIS | ribosome biogenesis | 52/1390 | 299/18723 | 6.73e-09 | 5.44e-07 | 52 |
| GO:000636422 | Breast | DCIS | rRNA processing | 35/1390 | 225/18723 | 2.41e-05 | 5.62e-04 | 35 |
| GO:001607222 | Breast | DCIS | rRNA metabolic process | 36/1390 | 236/18723 | 2.86e-05 | 6.42e-04 | 36 |
| GO:003447011 | Breast | DCIS | ncRNA processing | 44/1390 | 395/18723 | 4.56e-03 | 3.49e-02 | 44 |
| GO:002261310 | Cervix | CC | ribonucleoprotein complex biogenesis | 88/2311 | 463/18723 | 2.11e-05 | 3.82e-04 | 88 |
| GO:004225410 | Cervix | CC | ribosome biogenesis | 62/2311 | 299/18723 | 2.48e-05 | 4.27e-04 | 62 |
| GO:00165705 | Cervix | CC | histone modification | 84/2311 | 463/18723 | 1.70e-04 | 2.01e-03 | 84 |
| GO:00349685 | Cervix | CC | histone lysine methylation | 27/2311 | 115/18723 | 6.61e-04 | 6.09e-03 | 27 |
| GO:00165715 | Cervix | CC | histone methylation | 30/2311 | 141/18723 | 1.88e-03 | 1.39e-02 | 30 |
| Page: 1 2 3 4 5 6 7 8 9 10 11 12 |
| Pathway ID | Tissue | Disease Stage | Description | Gene Ratio | Bg Ratio | pvalue | p.adjust | qvalue | Count |
| Page: 1 |
Top |
Cell-cell communication analysis |
| Identification of potential cell-cell interactions between two cell types and their ligand-receptor pairs for different disease states |
| Ligand | Receptor | LRpair | Pathway | Tissue | Disease Stage |
| Page: 1 |
Top |
Single-cell gene regulatory network inference analysis |
| Find out the significant the regulons (TFs) and the target genes of each regulon across cell types for different disease states |
| TF | Cell Type | Tissue | Disease Stage | Target Gene | RSS | Regulon Activity |
| ∗The dot plots of a searched regulon are shown for all cell subpopulations in each disease state of each tissue based on the regulon specific score inferred using pySCENIC and by calculating the average expression. |
| Page: 1 |
Top |
Somatic mutation of malignant transformation related genes |
| Annotation of somatic variants for genes involved in malignant transformation |
| Hugo Symbol | Variant Class | Variant Classification | dbSNP RS | HGVSc | HGVSp | HGVSp Short | SWISSPROT | BIOTYPE | SIFT | PolyPhen | Tumor Sample Barcode | Tissue | Histology | Sex | Age | Stage | Therapy Types | Drugs | Outcome |
| TRMT112 | SNV | Missense_Mutation | c.214N>A | p.Glu72Lys | p.E72K | Q9UI30 | protein_coding | tolerated(0.51) | benign(0.038) | TCGA-A8-A091-01 | Breast | breast invasive carcinoma | Female | <65 | I/II | Chemotherapy | 5-fluorouracil | PD | |
| TRMT112 | SNV | Missense_Mutation | c.236N>G | p.Glu79Gly | p.E79G | Q9UI30 | protein_coding | tolerated(0.06) | benign(0.078) | TCGA-D8-A1XQ-01 | Breast | breast invasive carcinoma | Female | >=65 | I/II | Unknown | Unknown | SD | |
| TRMT112 | SNV | Missense_Mutation | c.317N>G | p.Met106Arg | p.M106R | Q9UI30 | protein_coding | tolerated(0.41) | benign(0) | TCGA-E2-A1L7-01 | Breast | breast invasive carcinoma | Female | <65 | III/IV | Chemotherapy | cyclophosphamide | PD | |
| TRMT112 | SNV | Missense_Mutation | novel | c.127N>A | p.Ala43Thr | p.A43T | Q9UI30 | protein_coding | tolerated(0.46) | benign(0.026) | TCGA-AA-3672-01 | Colorectum | colon adenocarcinoma | Female | >=65 | III/IV | Unknown | Unknown | SD |
| TRMT112 | SNV | Missense_Mutation | novel | c.59N>A | p.Gly20Asp | p.G20D | Q9UI30 | protein_coding | deleterious(0) | probably_damaging(0.999) | TCGA-DI-A1BU-01 | Endometrium | uterine corpus endometrioid carcinoma | Female | <65 | I/II | Chemotherapy | paclitaxel | SD |
| TRMT112 | SNV | Missense_Mutation | novel | c.287N>T | p.Gly96Val | p.G96V | Q9UI30 | protein_coding | deleterious(0) | probably_damaging(0.998) | TCGA-52-7812-01 | Lung | lung squamous cell carcinoma | Male | >=65 | I/II | Chemotherapy | paclitaxel | PD |
| TRMT112 | SNV | Missense_Mutation | novel | c.218N>C | p.Gly73Ala | p.G73A | Q9UI30 | protein_coding | tolerated(0.55) | benign(0.101) | TCGA-77-7463-01 | Lung | lung squamous cell carcinoma | Male | >=65 | I/II | Unknown | Unknown | SD |
| TRMT112 | insertion | Frame_Shift_Ins | rs762738556 | c.46_47insG | p.Val16GlyfsTer33 | p.V16Gfs*33 | Q9UI30 | protein_coding | TCGA-CV-A45W-01 | Oral cavity | head & neck squamous cell carcinoma | Male | >=65 | I/II | Unknown | Unknown | SD |
| Page: 1 |
Top |
Related drugs of malignant transformation related genes |
| Identification of chemicals and drugs interact with genes involved in malignant transfromation |
| (DGIdb 4.0) |
| Entrez ID | Symbol | Category | Interaction Types | Drug Claim Name | Drug Name | PMIDs |
| Page: 1 |

Copyright 2023-Present -The University of Texas Health Science Center at Houston |