
|
|||||
|
 | |
| |
| |
| |
| |
| |
|
Gene: TRMT10B |
Gene summary for TRMT10B |
| Gene information | Species | Human | Gene symbol | TRMT10B | Gene ID | 158234 |
| Gene name | tRNA methyltransferase 10B | |
| Gene Alias | RG9MTD3 | |
| Cytomap | 9p13.2 | |
| Gene Type | protein-coding | GO ID | GO:0001510 | UniProtAcc | Q6PF06 |
Top |
Malignant transformation analysis |
| Identification of the aberrant gene expression in precancerous and cancerous lesions by comparing the gene expression of stem-like cells in diseased tissues with normal stem cells |
| Entrez ID | Symbol | Replicates | Species | Organ | Tissue | Adj P-value | Log2FC | Malignancy |
| 158234 | TRMT10B | LZE4T | Human | Esophagus | ESCC | 3.05e-05 | 1.86e-01 | 0.0811 |
| 158234 | TRMT10B | LZE5T | Human | Esophagus | ESCC | 5.16e-07 | 3.78e-01 | 0.0514 |
| 158234 | TRMT10B | LZE8T | Human | Esophagus | ESCC | 4.03e-04 | 1.08e-01 | 0.067 |
| 158234 | TRMT10B | LZE24T | Human | Esophagus | ESCC | 2.07e-12 | 2.42e-01 | 0.0596 |
| 158234 | TRMT10B | P1T-E | Human | Esophagus | ESCC | 2.95e-03 | 2.41e-01 | 0.0875 |
| 158234 | TRMT10B | P2T-E | Human | Esophagus | ESCC | 2.05e-18 | 2.75e-01 | 0.1177 |
| 158234 | TRMT10B | P4T-E | Human | Esophagus | ESCC | 2.40e-05 | 1.40e-01 | 0.1323 |
| 158234 | TRMT10B | P8T-E | Human | Esophagus | ESCC | 1.49e-09 | 1.87e-01 | 0.0889 |
| 158234 | TRMT10B | P9T-E | Human | Esophagus | ESCC | 2.66e-07 | 1.12e-01 | 0.1131 |
| 158234 | TRMT10B | P10T-E | Human | Esophagus | ESCC | 2.70e-15 | 2.43e-01 | 0.116 |
| 158234 | TRMT10B | P11T-E | Human | Esophagus | ESCC | 4.57e-06 | 2.43e-01 | 0.1426 |
| 158234 | TRMT10B | P12T-E | Human | Esophagus | ESCC | 7.30e-10 | 1.76e-01 | 0.1122 |
| 158234 | TRMT10B | P15T-E | Human | Esophagus | ESCC | 1.08e-13 | 1.55e-01 | 0.1149 |
| 158234 | TRMT10B | P16T-E | Human | Esophagus | ESCC | 9.76e-08 | 1.87e-01 | 0.1153 |
| 158234 | TRMT10B | P17T-E | Human | Esophagus | ESCC | 3.85e-04 | 1.37e-01 | 0.1278 |
| 158234 | TRMT10B | P20T-E | Human | Esophagus | ESCC | 1.42e-10 | 1.59e-01 | 0.1124 |
| 158234 | TRMT10B | P21T-E | Human | Esophagus | ESCC | 1.21e-08 | 1.27e-01 | 0.1617 |
| 158234 | TRMT10B | P22T-E | Human | Esophagus | ESCC | 1.74e-17 | 2.20e-01 | 0.1236 |
| 158234 | TRMT10B | P23T-E | Human | Esophagus | ESCC | 3.24e-11 | 2.19e-01 | 0.108 |
| 158234 | TRMT10B | P24T-E | Human | Esophagus | ESCC | 5.59e-12 | 1.13e-01 | 0.1287 |
| Page: 1 2 3 |
| Tissue | Expression Dynamics | Abbreviation |
| Esophagus | 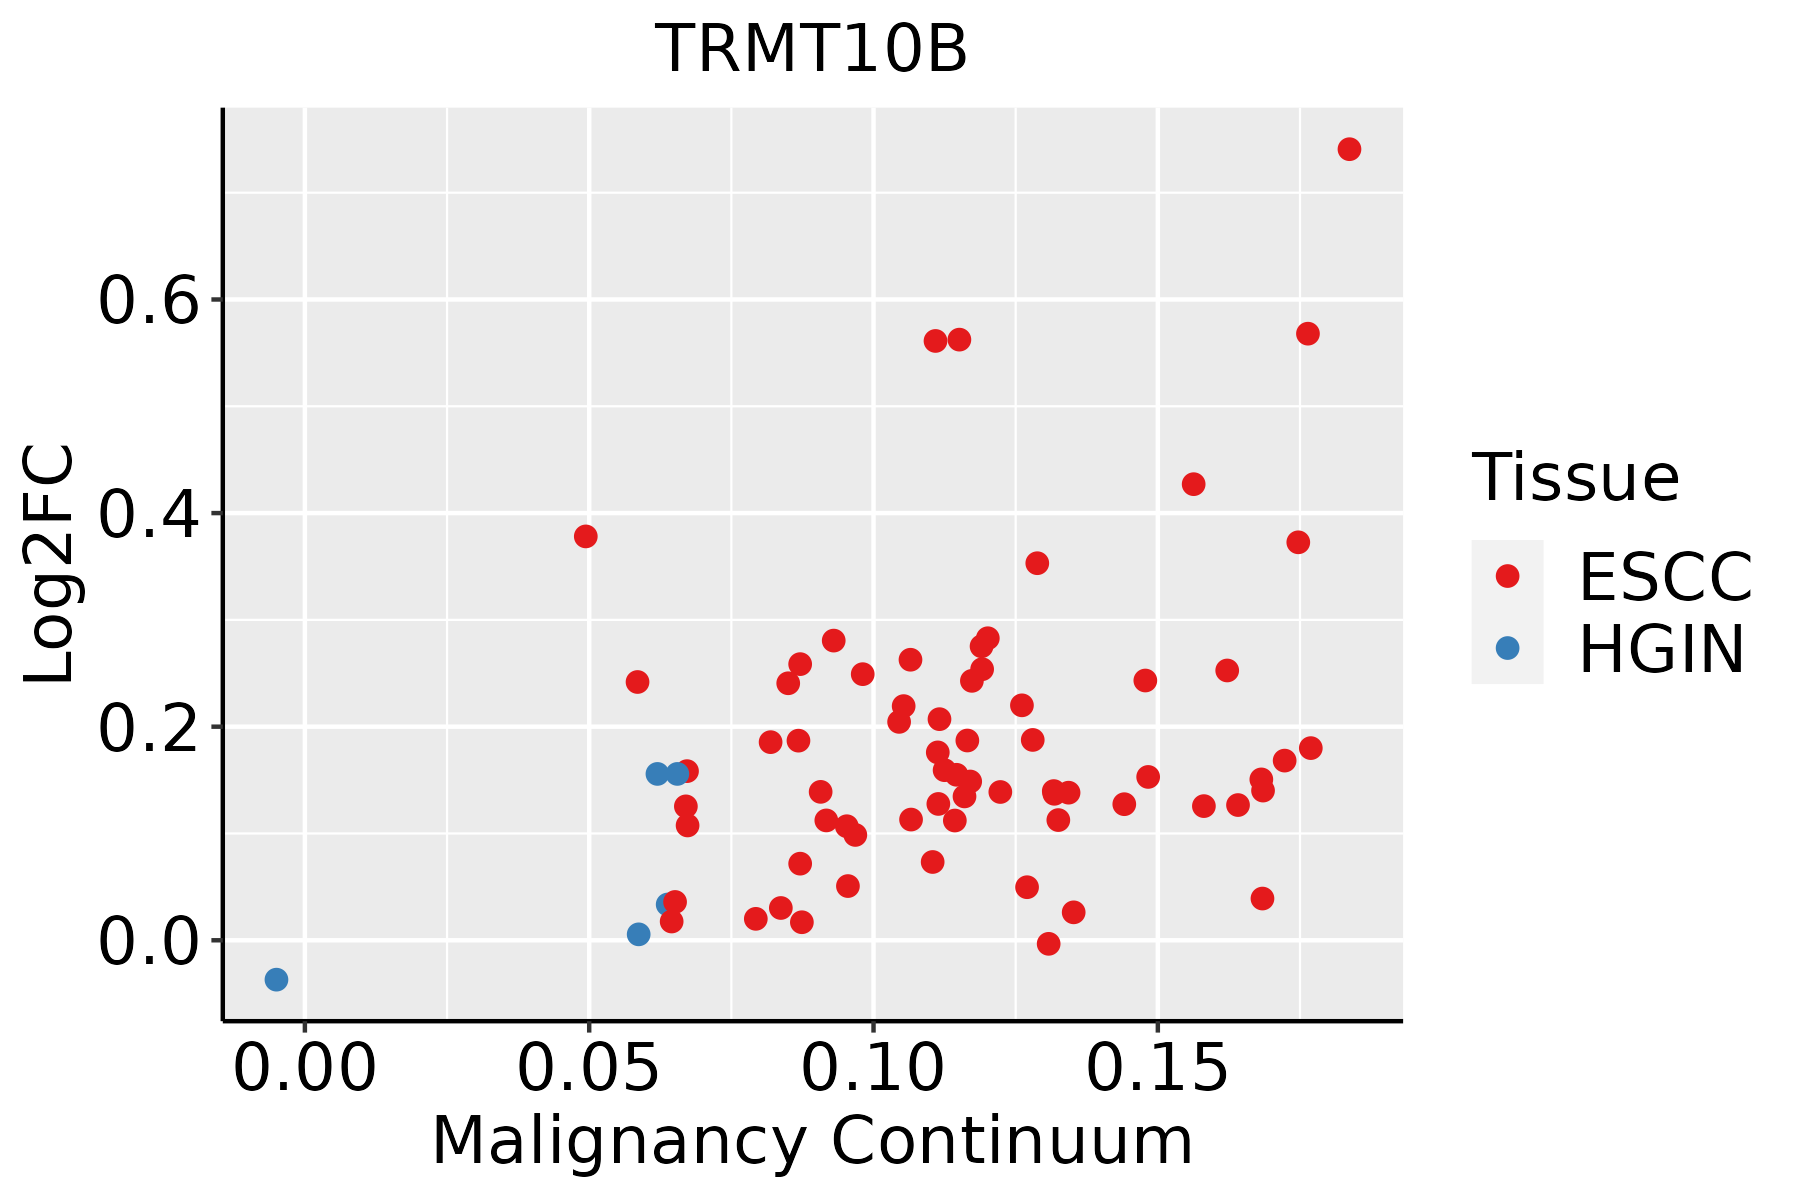 | ESCC: Esophageal squamous cell carcinoma |
| HGIN: High-grade intraepithelial neoplasias | ||
| LGIN: Low-grade intraepithelial neoplasias | ||
| Liver | 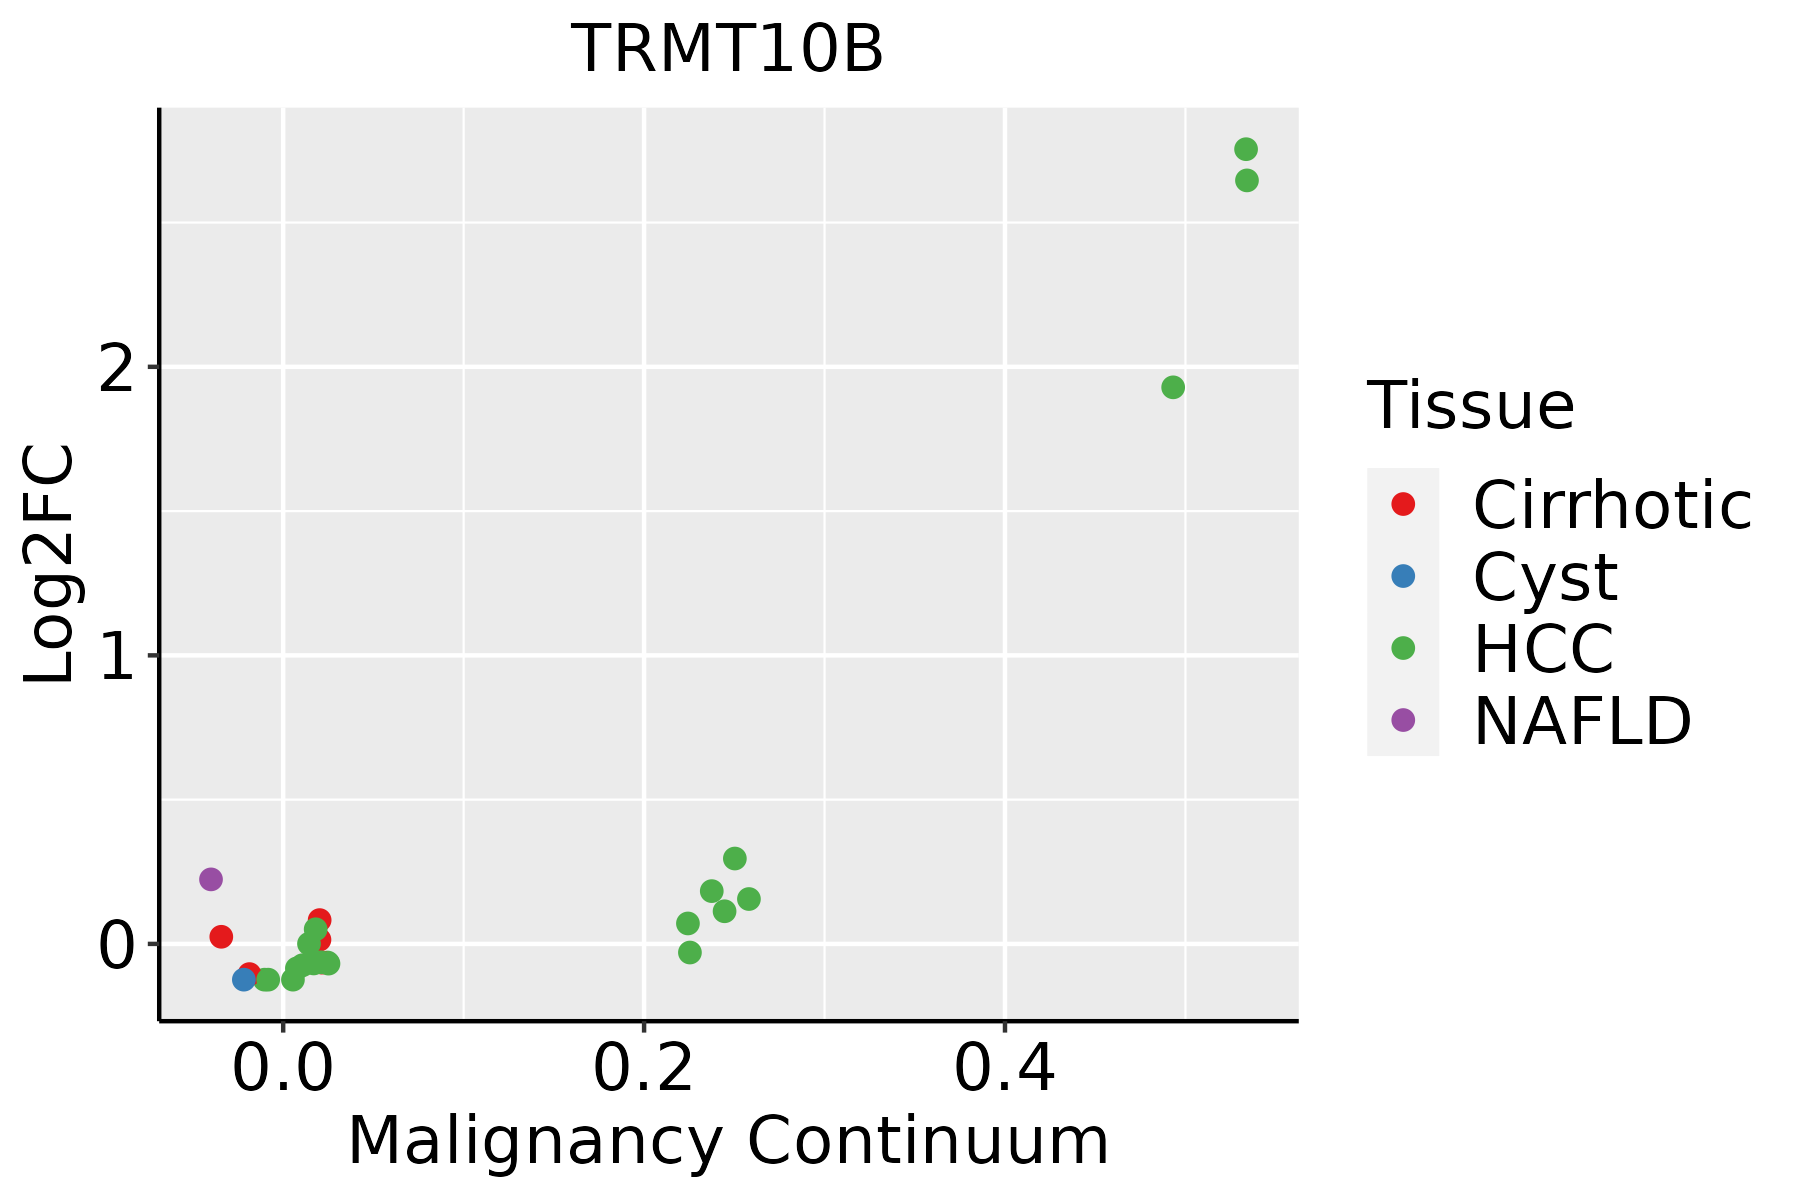 | HCC: Hepatocellular carcinoma |
| NAFLD: Non-alcoholic fatty liver disease |
| ∗log2FC in expression of this searched gene in stem-like cells from each diseased tissue sample relative to stem-like cells in normal samples in each tissue plotted against the malignancy continuum. Samples are colored based on if they are from different disease stage. |
Top |
Malignant transformation related pathway analysis |
| Find out the enriched GO biological processes and KEGG pathways involved in transition from healthy to precancer to cancer |
| Tissue | Disease Stage | Enriched GO biological Processes |
| Colorectum | AD |  |
| Colorectum | SER |  |
| Colorectum | MSS |  |
| Colorectum | MSI-H |  |
| Colorectum | FAP |  |
| ∗Top 15 enriched GO BP terms are showed in the bar plot of each disease state in each tissue. Each row represents a significant GO biological process which is colored according to the -log10(p.adjust). |
| Page: 1 2 3 4 5 6 7 8 9 |
| GO ID | Tissue | Disease Stage | Description | Gene Ratio | Bg Ratio | pvalue | p.adjust | Count |
| GO:003447015 | Esophagus | ESCC | ncRNA processing | 300/8552 | 395/18723 | 3.09e-35 | 3.26e-32 | 300 |
| GO:003466012 | Esophagus | ESCC | ncRNA metabolic process | 346/8552 | 485/18723 | 4.35e-31 | 2.51e-28 | 346 |
| GO:00434143 | Esophagus | ESCC | macromolecule methylation | 199/8552 | 316/18723 | 3.44e-10 | 9.57e-09 | 199 |
| GO:00080333 | Esophagus | ESCC | tRNA processing | 92/8552 | 127/18723 | 7.83e-10 | 1.93e-08 | 92 |
| GO:00063992 | Esophagus | ESCC | tRNA metabolic process | 122/8552 | 179/18723 | 9.03e-10 | 2.19e-08 | 122 |
| GO:00322592 | Esophagus | ESCC | methylation | 222/8552 | 364/18723 | 2.26e-09 | 5.09e-08 | 222 |
| GO:00094512 | Esophagus | ESCC | RNA modification | 114/8552 | 167/18723 | 2.76e-09 | 6.04e-08 | 114 |
| GO:00015101 | Esophagus | ESCC | RNA methylation | 58/8552 | 83/18723 | 6.87e-06 | 6.94e-05 | 58 |
| GO:00064002 | Esophagus | ESCC | tRNA modification | 62/8552 | 90/18723 | 7.02e-06 | 7.04e-05 | 62 |
| GO:00304881 | Esophagus | ESCC | tRNA methylation | 30/8552 | 41/18723 | 3.27e-04 | 1.93e-03 | 30 |
| GO:00344702 | Liver | HCC | ncRNA processing | 293/7958 | 395/18723 | 4.26e-38 | 6.76e-35 | 293 |
| GO:00346601 | Liver | HCC | ncRNA metabolic process | 332/7958 | 485/18723 | 1.48e-31 | 7.80e-29 | 332 |
| GO:0008033 | Liver | HCC | tRNA processing | 87/7958 | 127/18723 | 2.66e-09 | 7.23e-08 | 87 |
| GO:00434141 | Liver | HCC | macromolecule methylation | 183/7958 | 316/18723 | 2.00e-08 | 4.72e-07 | 183 |
| GO:0032259 | Liver | HCC | methylation | 206/7958 | 364/18723 | 3.35e-08 | 7.53e-07 | 206 |
| GO:0006399 | Liver | HCC | tRNA metabolic process | 108/7958 | 179/18723 | 1.07e-06 | 1.59e-05 | 108 |
| GO:0009451 | Liver | HCC | RNA modification | 101/7958 | 167/18723 | 2.02e-06 | 2.78e-05 | 101 |
| GO:0006400 | Liver | HCC | tRNA modification | 60/7958 | 90/18723 | 3.09e-06 | 4.09e-05 | 60 |
| GO:0001510 | Liver | HCC | RNA methylation | 53/7958 | 83/18723 | 6.96e-05 | 6.29e-04 | 53 |
| GO:0030488 | Liver | HCC | tRNA methylation | 29/7958 | 41/18723 | 2.38e-04 | 1.79e-03 | 29 |
| Page: 1 |
| Pathway ID | Tissue | Disease Stage | Description | Gene Ratio | Bg Ratio | pvalue | p.adjust | qvalue | Count |
| Page: 1 |
Top |
Cell-cell communication analysis |
| Identification of potential cell-cell interactions between two cell types and their ligand-receptor pairs for different disease states |
| Ligand | Receptor | LRpair | Pathway | Tissue | Disease Stage |
| Page: 1 |
Top |
Single-cell gene regulatory network inference analysis |
| Find out the significant the regulons (TFs) and the target genes of each regulon across cell types for different disease states |
| TF | Cell Type | Tissue | Disease Stage | Target Gene | RSS | Regulon Activity |
| ∗The dot plots of a searched regulon are shown for all cell subpopulations in each disease state of each tissue based on the regulon specific score inferred using pySCENIC and by calculating the average expression. |
| Page: 1 |
Top |
Somatic mutation of malignant transformation related genes |
| Annotation of somatic variants for genes involved in malignant transformation |
| Hugo Symbol | Variant Class | Variant Classification | dbSNP RS | HGVSc | HGVSp | HGVSp Short | SWISSPROT | BIOTYPE | SIFT | PolyPhen | Tumor Sample Barcode | Tissue | Histology | Sex | Age | Stage | Therapy Types | Drugs | Outcome |
| TRMT10B | SNV | Missense_Mutation | novel | c.120N>C | p.Gln40His | p.Q40H | Q6PF06 | protein_coding | tolerated(0.08) | benign(0.075) | TCGA-5L-AAT1-01 | Breast | breast invasive carcinoma | Female | <65 | III/IV | Hormone Therapy | letrozol | SD |
| TRMT10B | SNV | Missense_Mutation | rs777987343 | c.198N>C | p.Gln66His | p.Q66H | Q6PF06 | protein_coding | deleterious(0.03) | possibly_damaging(0.628) | TCGA-5L-AAT1-01 | Breast | breast invasive carcinoma | Female | <65 | III/IV | Hormone Therapy | letrozol | SD |
| TRMT10B | SNV | Missense_Mutation | novel | c.383N>T | p.Cys128Phe | p.C128F | Q6PF06 | protein_coding | deleterious(0) | possibly_damaging(0.812) | TCGA-C5-A8ZZ-01 | Cervix | cervical & endocervical cancer | Female | <65 | I/II | Unspecific | Cisplatin | SD |
| TRMT10B | SNV | Missense_Mutation | c.377G>T | p.Arg126Ile | p.R126I | Q6PF06 | protein_coding | deleterious(0) | benign(0.293) | TCGA-AA-A010-01 | Colorectum | colon adenocarcinoma | Female | <65 | I/II | Chemotherapy | folinic | CR | |
| TRMT10B | SNV | Missense_Mutation | novel | c.828A>G | p.Ile276Met | p.I276M | Q6PF06 | protein_coding | deleterious(0.04) | benign(0.378) | TCGA-CA-6717-01 | Colorectum | colon adenocarcinoma | Male | <65 | I/II | Chemotherapy | oxaliplatin | CR |
| TRMT10B | SNV | Missense_Mutation | rs747899671 | c.266N>A | p.Arg89Gln | p.R89Q | Q6PF06 | protein_coding | deleterious(0) | probably_damaging(0.998) | TCGA-CA-6718-01 | Colorectum | colon adenocarcinoma | Male | <65 | I/II | Unknown | Unknown | PD |
| TRMT10B | SNV | Missense_Mutation | rs370222676 | c.111N>T | p.Gln37His | p.Q37H | Q6PF06 | protein_coding | tolerated(0.06) | possibly_damaging(0.459) | TCGA-DM-A1HB-01 | Colorectum | colon adenocarcinoma | Male | >=65 | III/IV | Unknown | Unknown | SD |
| TRMT10B | deletion | Frame_Shift_Del | c.469delN | p.Ala159LeufsTer23 | p.A159Lfs*23 | Q6PF06 | protein_coding | TCGA-AD-A5EJ-01 | Colorectum | colon adenocarcinoma | Female | >=65 | I/II | Unknown | Unknown | SD | |||
| TRMT10B | SNV | Missense_Mutation | rs367875883 | c.691N>A | p.Gly231Ser | p.G231S | Q6PF06 | protein_coding | deleterious(0) | probably_damaging(0.975) | TCGA-A5-A0G2-01 | Endometrium | uterine corpus endometrioid carcinoma | Female | <65 | III/IV | Unknown | Unknown | SD |
| TRMT10B | SNV | Missense_Mutation | c.248N>T | p.Arg83Ile | p.R83I | Q6PF06 | protein_coding | deleterious(0) | probably_damaging(0.998) | TCGA-A5-A1OF-01 | Endometrium | uterine corpus endometrioid carcinoma | Female | <65 | I/II | Unknown | Unknown | SD |
| Page: 1 2 3 4 |
Top |
Related drugs of malignant transformation related genes |
| Identification of chemicals and drugs interact with genes involved in malignant transfromation |
| (DGIdb 4.0) |
| Entrez ID | Symbol | Category | Interaction Types | Drug Claim Name | Drug Name | PMIDs |
| Page: 1 |

Copyright 2023-Present -The University of Texas Health Science Center at Houston |