
|
|||||
|
 | |
| |
| |
| |
| |
| |
|
Gene: TRMT1 |
Gene summary for TRMT1 |
| Gene information | Species | Human | Gene symbol | TRMT1 | Gene ID | 55621 |
| Gene name | tRNA methyltransferase 1 | |
| Gene Alias | MRT68 | |
| Cytomap | 19p13.13 | |
| Gene Type | protein-coding | GO ID | GO:0001510 | UniProtAcc | A0A024R7I5 |
Top |
Malignant transformation analysis |
| Identification of the aberrant gene expression in precancerous and cancerous lesions by comparing the gene expression of stem-like cells in diseased tissues with normal stem cells |
| Entrez ID | Symbol | Replicates | Species | Organ | Tissue | Adj P-value | Log2FC | Malignancy |
| 55621 | TRMT1 | LZE4T | Human | Esophagus | ESCC | 2.97e-04 | 1.22e-01 | 0.0811 |
| 55621 | TRMT1 | LZE7T | Human | Esophagus | ESCC | 3.13e-14 | 5.22e-01 | 0.0667 |
| 55621 | TRMT1 | LZE8T | Human | Esophagus | ESCC | 1.70e-03 | 1.63e-01 | 0.067 |
| 55621 | TRMT1 | LZE20T | Human | Esophagus | ESCC | 4.84e-02 | 1.27e-01 | 0.0662 |
| 55621 | TRMT1 | LZE21D1 | Human | Esophagus | HGIN | 4.09e-05 | 3.24e-01 | 0.0632 |
| 55621 | TRMT1 | LZE22D1 | Human | Esophagus | HGIN | 3.08e-02 | 1.12e-01 | 0.0595 |
| 55621 | TRMT1 | LZE22T | Human | Esophagus | ESCC | 2.70e-05 | 3.45e-01 | 0.068 |
| 55621 | TRMT1 | LZE24T | Human | Esophagus | ESCC | 1.69e-13 | 3.74e-01 | 0.0596 |
| 55621 | TRMT1 | LZE21T | Human | Esophagus | ESCC | 1.05e-05 | 4.77e-01 | 0.0655 |
| 55621 | TRMT1 | LZE6T | Human | Esophagus | ESCC | 1.30e-05 | 2.26e-01 | 0.0845 |
| 55621 | TRMT1 | P1T-E | Human | Esophagus | ESCC | 1.60e-13 | 4.85e-01 | 0.0875 |
| 55621 | TRMT1 | P2T-E | Human | Esophagus | ESCC | 1.19e-18 | 2.45e-01 | 0.1177 |
| 55621 | TRMT1 | P4T-E | Human | Esophagus | ESCC | 3.45e-13 | 2.52e-01 | 0.1323 |
| 55621 | TRMT1 | P5T-E | Human | Esophagus | ESCC | 3.27e-19 | 3.49e-01 | 0.1327 |
| 55621 | TRMT1 | P8T-E | Human | Esophagus | ESCC | 3.75e-22 | 3.65e-01 | 0.0889 |
| 55621 | TRMT1 | P9T-E | Human | Esophagus | ESCC | 1.90e-11 | 3.20e-01 | 0.1131 |
| 55621 | TRMT1 | P10T-E | Human | Esophagus | ESCC | 3.37e-24 | 3.83e-01 | 0.116 |
| 55621 | TRMT1 | P11T-E | Human | Esophagus | ESCC | 1.55e-06 | 4.44e-01 | 0.1426 |
| 55621 | TRMT1 | P12T-E | Human | Esophagus | ESCC | 4.76e-24 | 4.36e-01 | 0.1122 |
| 55621 | TRMT1 | P15T-E | Human | Esophagus | ESCC | 3.26e-14 | 3.50e-01 | 0.1149 |
| Page: 1 2 3 4 5 |
| Tissue | Expression Dynamics | Abbreviation |
| Esophagus |  | ESCC: Esophageal squamous cell carcinoma |
| HGIN: High-grade intraepithelial neoplasias | ||
| LGIN: Low-grade intraepithelial neoplasias | ||
| Liver | 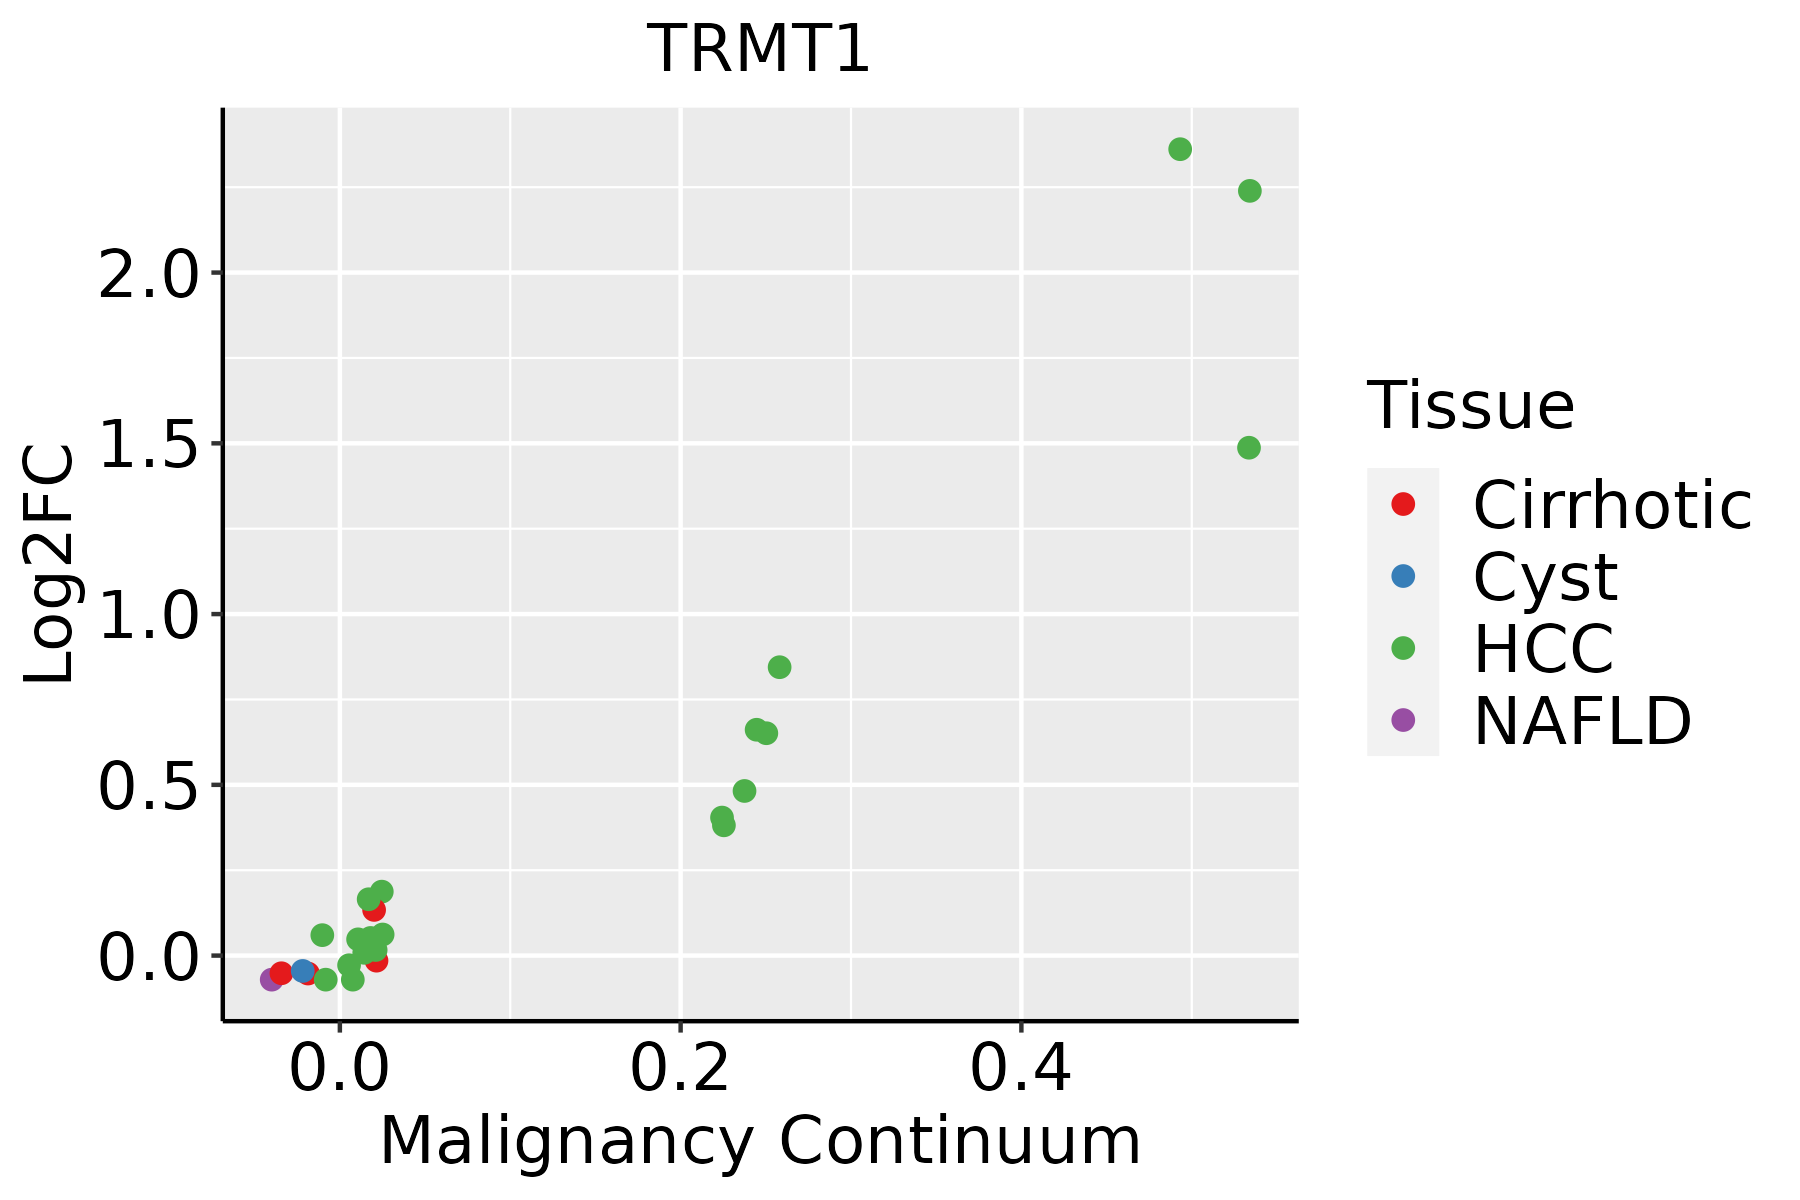 | HCC: Hepatocellular carcinoma |
| NAFLD: Non-alcoholic fatty liver disease | ||
| Oral Cavity | 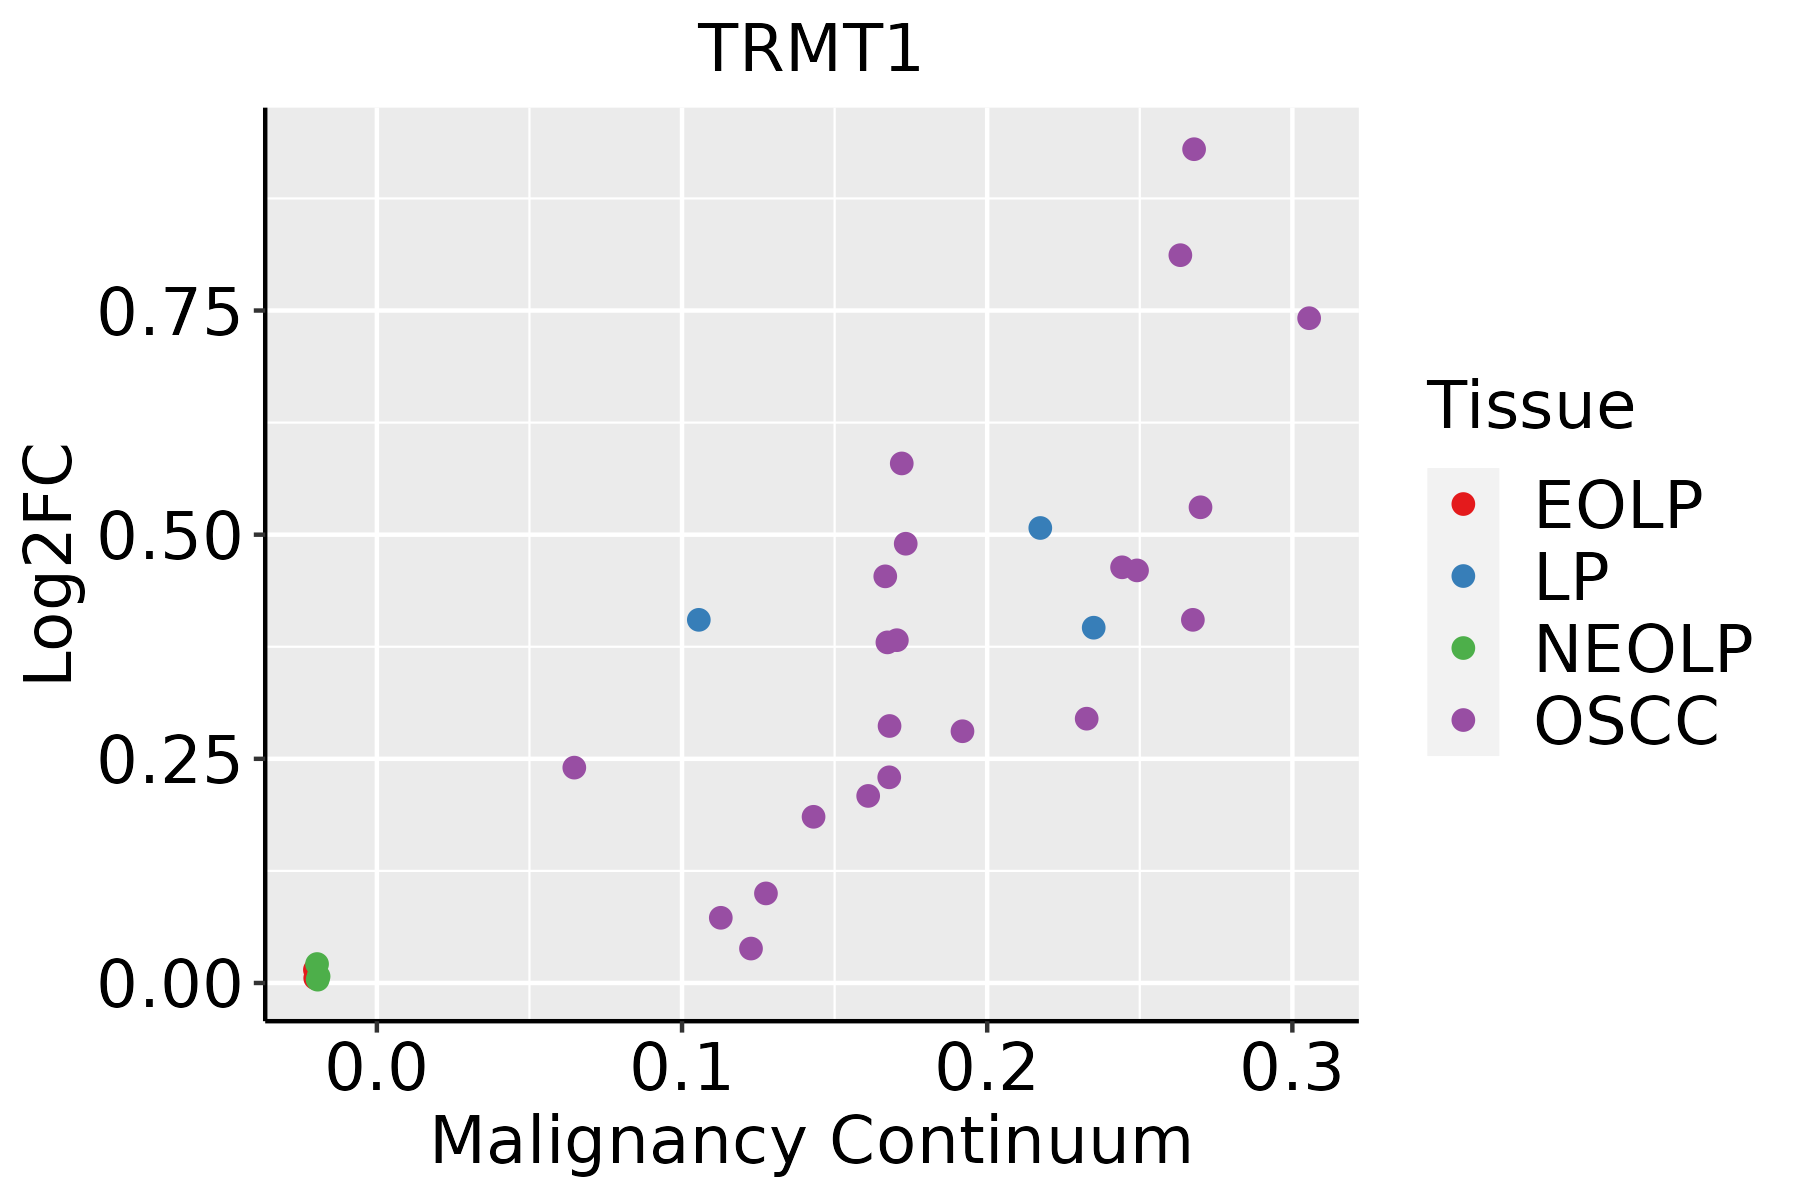 | EOLP: Erosive Oral lichen planus |
| LP: leukoplakia | ||
| NEOLP: Non-erosive oral lichen planus | ||
| OSCC: Oral squamous cell carcinoma | ||
| Skin |  | AK: Actinic keratosis |
| cSCC: Cutaneous squamous cell carcinoma | ||
| SCCIS:squamous cell carcinoma in situ |
| ∗log2FC in expression of this searched gene in stem-like cells from each diseased tissue sample relative to stem-like cells in normal samples in each tissue plotted against the malignancy continuum. Samples are colored based on if they are from different disease stage. |
Top |
Malignant transformation related pathway analysis |
| Find out the enriched GO biological processes and KEGG pathways involved in transition from healthy to precancer to cancer |
| Tissue | Disease Stage | Enriched GO biological Processes |
| Colorectum | AD |  |
| Colorectum | SER |  |
| Colorectum | MSS |  |
| Colorectum | MSI-H |  |
| Colorectum | FAP |  |
| ∗Top 15 enriched GO BP terms are showed in the bar plot of each disease state in each tissue. Each row represents a significant GO biological process which is colored according to the -log10(p.adjust). |
| Page: 1 2 3 4 5 6 7 8 9 |
| GO ID | Tissue | Disease Stage | Description | Gene Ratio | Bg Ratio | pvalue | p.adjust | Count |
| GO:00226139 | Breast | Precancer | ribonucleoprotein complex biogenesis | 79/1080 | 463/18723 | 2.11e-18 | 1.03e-15 | 79 |
| GO:00422549 | Breast | Precancer | ribosome biogenesis | 52/1080 | 299/18723 | 7.35e-13 | 1.51e-10 | 52 |
| GO:00063646 | Breast | Precancer | rRNA processing | 35/1080 | 225/18723 | 7.90e-08 | 4.60e-06 | 35 |
| GO:00160726 | Breast | Precancer | rRNA metabolic process | 36/1080 | 236/18723 | 8.59e-08 | 4.84e-06 | 36 |
| GO:00344705 | Breast | Precancer | ncRNA processing | 42/1080 | 395/18723 | 9.91e-05 | 1.83e-03 | 42 |
| GO:00346604 | Breast | Precancer | ncRNA metabolic process | 45/1080 | 485/18723 | 1.15e-03 | 1.26e-02 | 45 |
| GO:002261314 | Breast | IDC | ribonucleoprotein complex biogenesis | 83/1434 | 463/18723 | 2.01e-13 | 5.20e-11 | 83 |
| GO:004225414 | Breast | IDC | ribosome biogenesis | 52/1434 | 299/18723 | 1.90e-08 | 1.32e-06 | 52 |
| GO:000636414 | Breast | IDC | rRNA processing | 35/1434 | 225/18723 | 4.59e-05 | 1.03e-03 | 35 |
| GO:001607214 | Breast | IDC | rRNA metabolic process | 36/1434 | 236/18723 | 5.48e-05 | 1.17e-03 | 36 |
| GO:002261324 | Breast | DCIS | ribonucleoprotein complex biogenesis | 83/1390 | 463/18723 | 3.65e-14 | 1.09e-11 | 83 |
| GO:004225423 | Breast | DCIS | ribosome biogenesis | 52/1390 | 299/18723 | 6.73e-09 | 5.44e-07 | 52 |
| GO:000636422 | Breast | DCIS | rRNA processing | 35/1390 | 225/18723 | 2.41e-05 | 5.62e-04 | 35 |
| GO:001607222 | Breast | DCIS | rRNA metabolic process | 36/1390 | 236/18723 | 2.86e-05 | 6.42e-04 | 36 |
| GO:003447011 | Breast | DCIS | ncRNA processing | 44/1390 | 395/18723 | 4.56e-03 | 3.49e-02 | 44 |
| GO:002261310 | Cervix | CC | ribonucleoprotein complex biogenesis | 88/2311 | 463/18723 | 2.11e-05 | 3.82e-04 | 88 |
| GO:004225410 | Cervix | CC | ribosome biogenesis | 62/2311 | 299/18723 | 2.48e-05 | 4.27e-04 | 62 |
| GO:00165705 | Cervix | CC | histone modification | 84/2311 | 463/18723 | 1.70e-04 | 2.01e-03 | 84 |
| GO:00349685 | Cervix | CC | histone lysine methylation | 27/2311 | 115/18723 | 6.61e-04 | 6.09e-03 | 27 |
| GO:00165715 | Cervix | CC | histone methylation | 30/2311 | 141/18723 | 1.88e-03 | 1.39e-02 | 30 |
| Page: 1 2 3 4 5 6 7 8 9 10 11 12 13 14 15 16 |
| Pathway ID | Tissue | Disease Stage | Description | Gene Ratio | Bg Ratio | pvalue | p.adjust | qvalue | Count |
| Page: 1 |
Top |
Cell-cell communication analysis |
| Identification of potential cell-cell interactions between two cell types and their ligand-receptor pairs for different disease states |
| Ligand | Receptor | LRpair | Pathway | Tissue | Disease Stage |
| Page: 1 |
Top |
Single-cell gene regulatory network inference analysis |
| Find out the significant the regulons (TFs) and the target genes of each regulon across cell types for different disease states |
| TF | Cell Type | Tissue | Disease Stage | Target Gene | RSS | Regulon Activity |
| ∗The dot plots of a searched regulon are shown for all cell subpopulations in each disease state of each tissue based on the regulon specific score inferred using pySCENIC and by calculating the average expression. |
| Page: 1 |
Top |
Somatic mutation of malignant transformation related genes |
| Annotation of somatic variants for genes involved in malignant transformation |
| Hugo Symbol | Variant Class | Variant Classification | dbSNP RS | HGVSc | HGVSp | HGVSp Short | SWISSPROT | BIOTYPE | SIFT | PolyPhen | Tumor Sample Barcode | Tissue | Histology | Sex | Age | Stage | Therapy Types | Drugs | Outcome |
| TRMT1 | SNV | Missense_Mutation | novel | c.1144N>A | p.Pro382Thr | p.P382T | Q9NXH9 | protein_coding | tolerated(0.1) | benign(0.062) | TCGA-AC-A3BB-01 | Breast | breast invasive carcinoma | Female | <65 | III/IV | Chemotherapy | cytoxan | CR |
| TRMT1 | SNV | Missense_Mutation | novel | c.1541C>T | p.Ser514Leu | p.S514L | Q9NXH9 | protein_coding | tolerated(0.15) | benign(0.118) | TCGA-AC-A5XS-01 | Breast | breast invasive carcinoma | Female | >=65 | I/II | Hormone Therapy | femara | SD |
| TRMT1 | SNV | Missense_Mutation | rs772461605 | c.1463C>T | p.Thr488Met | p.T488M | Q9NXH9 | protein_coding | deleterious(0) | probably_damaging(1) | TCGA-AN-A0FK-01 | Breast | breast invasive carcinoma | Female | >=65 | III/IV | Unknown | Unknown | SD |
| TRMT1 | SNV | Missense_Mutation | c.866N>T | p.Glu289Val | p.E289V | Q9NXH9 | protein_coding | deleterious(0) | probably_damaging(0.997) | TCGA-BH-A0BZ-01 | Breast | breast invasive carcinoma | Female | <65 | III/IV | Chemotherapy | doxorubicin | CR | |
| TRMT1 | SNV | Missense_Mutation | c.832G>A | p.Gly278Arg | p.G278R | Q9NXH9 | protein_coding | deleterious(0) | probably_damaging(0.996) | TCGA-D8-A1Y1-01 | Breast | breast invasive carcinoma | Female | >=65 | III/IV | Hormone Therapy | tamoxiphen | PD | |
| TRMT1 | SNV | Missense_Mutation | c.1637N>A | p.Arg546Gln | p.R546Q | Q9NXH9 | protein_coding | tolerated(0.5) | benign(0.001) | TCGA-D8-A27G-01 | Breast | breast invasive carcinoma | Female | >=65 | I/II | Unknown | Unknown | SD | |
| TRMT1 | SNV | Missense_Mutation | novel | c.851N>T | p.Ser284Ile | p.S284I | Q9NXH9 | protein_coding | deleterious(0.02) | benign(0.439) | TCGA-LL-A5YL-01 | Breast | breast invasive carcinoma | Female | <65 | I/II | Chemotherapy | adriamycin | SD |
| TRMT1 | SNV | Missense_Mutation | novel | c.1669G>T | p.Ala557Ser | p.A557S | Q9NXH9 | protein_coding | tolerated(0.12) | benign(0.041) | TCGA-OL-A5RZ-01 | Breast | breast invasive carcinoma | Female | <65 | I/II | Chemotherapy | doxorubicin | CR |
| TRMT1 | insertion | Frame_Shift_Ins | novel | c.1409_1410insGAACCCCGGGGGGCAGAGC | p.His471AsnfsTer9 | p.H471Nfs*9 | Q9NXH9 | protein_coding | TCGA-A2-A0CU-01 | Breast | breast invasive carcinoma | Female | >=65 | I/II | Hormone Therapy | tamoxiphen | SD | ||
| TRMT1 | insertion | Frame_Shift_Ins | novel | c.197_198insCAGCC | p.Pro67SerfsTer20 | p.P67Sfs*20 | Q9NXH9 | protein_coding | TCGA-BH-A0B1-01 | Breast | breast invasive carcinoma | Female | >=65 | I/II | Chemotherapy | adriamycin | SD |
| Page: 1 2 3 4 5 6 7 |
Top |
Related drugs of malignant transformation related genes |
| Identification of chemicals and drugs interact with genes involved in malignant transfromation |
| (DGIdb 4.0) |
| Entrez ID | Symbol | Category | Interaction Types | Drug Claim Name | Drug Name | PMIDs |
| Page: 1 |

Copyright 2023-Present -The University of Texas Health Science Center at Houston |