
|
|||||
|
 | |
| |
| |
| |
| |
| |
|
Gene: TRIT1 |
Gene summary for TRIT1 |
| Gene information | Species | Human | Gene symbol | TRIT1 | Gene ID | 54802 |
| Gene name | tRNA isopentenyltransferase 1 | |
| Gene Alias | COXPD35 | |
| Cytomap | 1p34.2 | |
| Gene Type | protein-coding | GO ID | GO:0000959 | UniProtAcc | Q53F11 |
Top |
Malignant transformation analysis |
| Identification of the aberrant gene expression in precancerous and cancerous lesions by comparing the gene expression of stem-like cells in diseased tissues with normal stem cells |
| Entrez ID | Symbol | Replicates | Species | Organ | Tissue | Adj P-value | Log2FC | Malignancy |
| 54802 | TRIT1 | LZE4T | Human | Esophagus | ESCC | 1.33e-08 | 2.49e-01 | 0.0811 |
| 54802 | TRIT1 | LZE7T | Human | Esophagus | ESCC | 4.02e-11 | 5.47e-01 | 0.0667 |
| 54802 | TRIT1 | LZE24T | Human | Esophagus | ESCC | 3.00e-10 | 2.67e-01 | 0.0596 |
| 54802 | TRIT1 | P1T-E | Human | Esophagus | ESCC | 1.05e-04 | 2.29e-01 | 0.0875 |
| 54802 | TRIT1 | P2T-E | Human | Esophagus | ESCC | 2.74e-16 | 3.85e-01 | 0.1177 |
| 54802 | TRIT1 | P4T-E | Human | Esophagus | ESCC | 1.88e-13 | 2.85e-01 | 0.1323 |
| 54802 | TRIT1 | P5T-E | Human | Esophagus | ESCC | 5.11e-14 | 2.86e-01 | 0.1327 |
| 54802 | TRIT1 | P8T-E | Human | Esophagus | ESCC | 4.48e-09 | 1.99e-01 | 0.0889 |
| 54802 | TRIT1 | P10T-E | Human | Esophagus | ESCC | 2.63e-61 | 1.05e+00 | 0.116 |
| 54802 | TRIT1 | P11T-E | Human | Esophagus | ESCC | 9.92e-09 | 2.91e-01 | 0.1426 |
| 54802 | TRIT1 | P12T-E | Human | Esophagus | ESCC | 3.91e-23 | 4.31e-01 | 0.1122 |
| 54802 | TRIT1 | P15T-E | Human | Esophagus | ESCC | 5.78e-23 | 4.36e-01 | 0.1149 |
| 54802 | TRIT1 | P16T-E | Human | Esophagus | ESCC | 1.41e-14 | 3.19e-01 | 0.1153 |
| 54802 | TRIT1 | P20T-E | Human | Esophagus | ESCC | 7.47e-15 | 4.17e-01 | 0.1124 |
| 54802 | TRIT1 | P21T-E | Human | Esophagus | ESCC | 9.63e-20 | 3.82e-01 | 0.1617 |
| 54802 | TRIT1 | P22T-E | Human | Esophagus | ESCC | 1.67e-11 | 2.22e-01 | 0.1236 |
| 54802 | TRIT1 | P23T-E | Human | Esophagus | ESCC | 4.17e-21 | 3.19e-01 | 0.108 |
| 54802 | TRIT1 | P24T-E | Human | Esophagus | ESCC | 7.38e-15 | 1.61e-01 | 0.1287 |
| 54802 | TRIT1 | P26T-E | Human | Esophagus | ESCC | 2.50e-13 | 2.88e-01 | 0.1276 |
| 54802 | TRIT1 | P27T-E | Human | Esophagus | ESCC | 3.19e-16 | 5.80e-01 | 0.1055 |
| Page: 1 2 3 4 |
| Tissue | Expression Dynamics | Abbreviation |
| Esophagus | 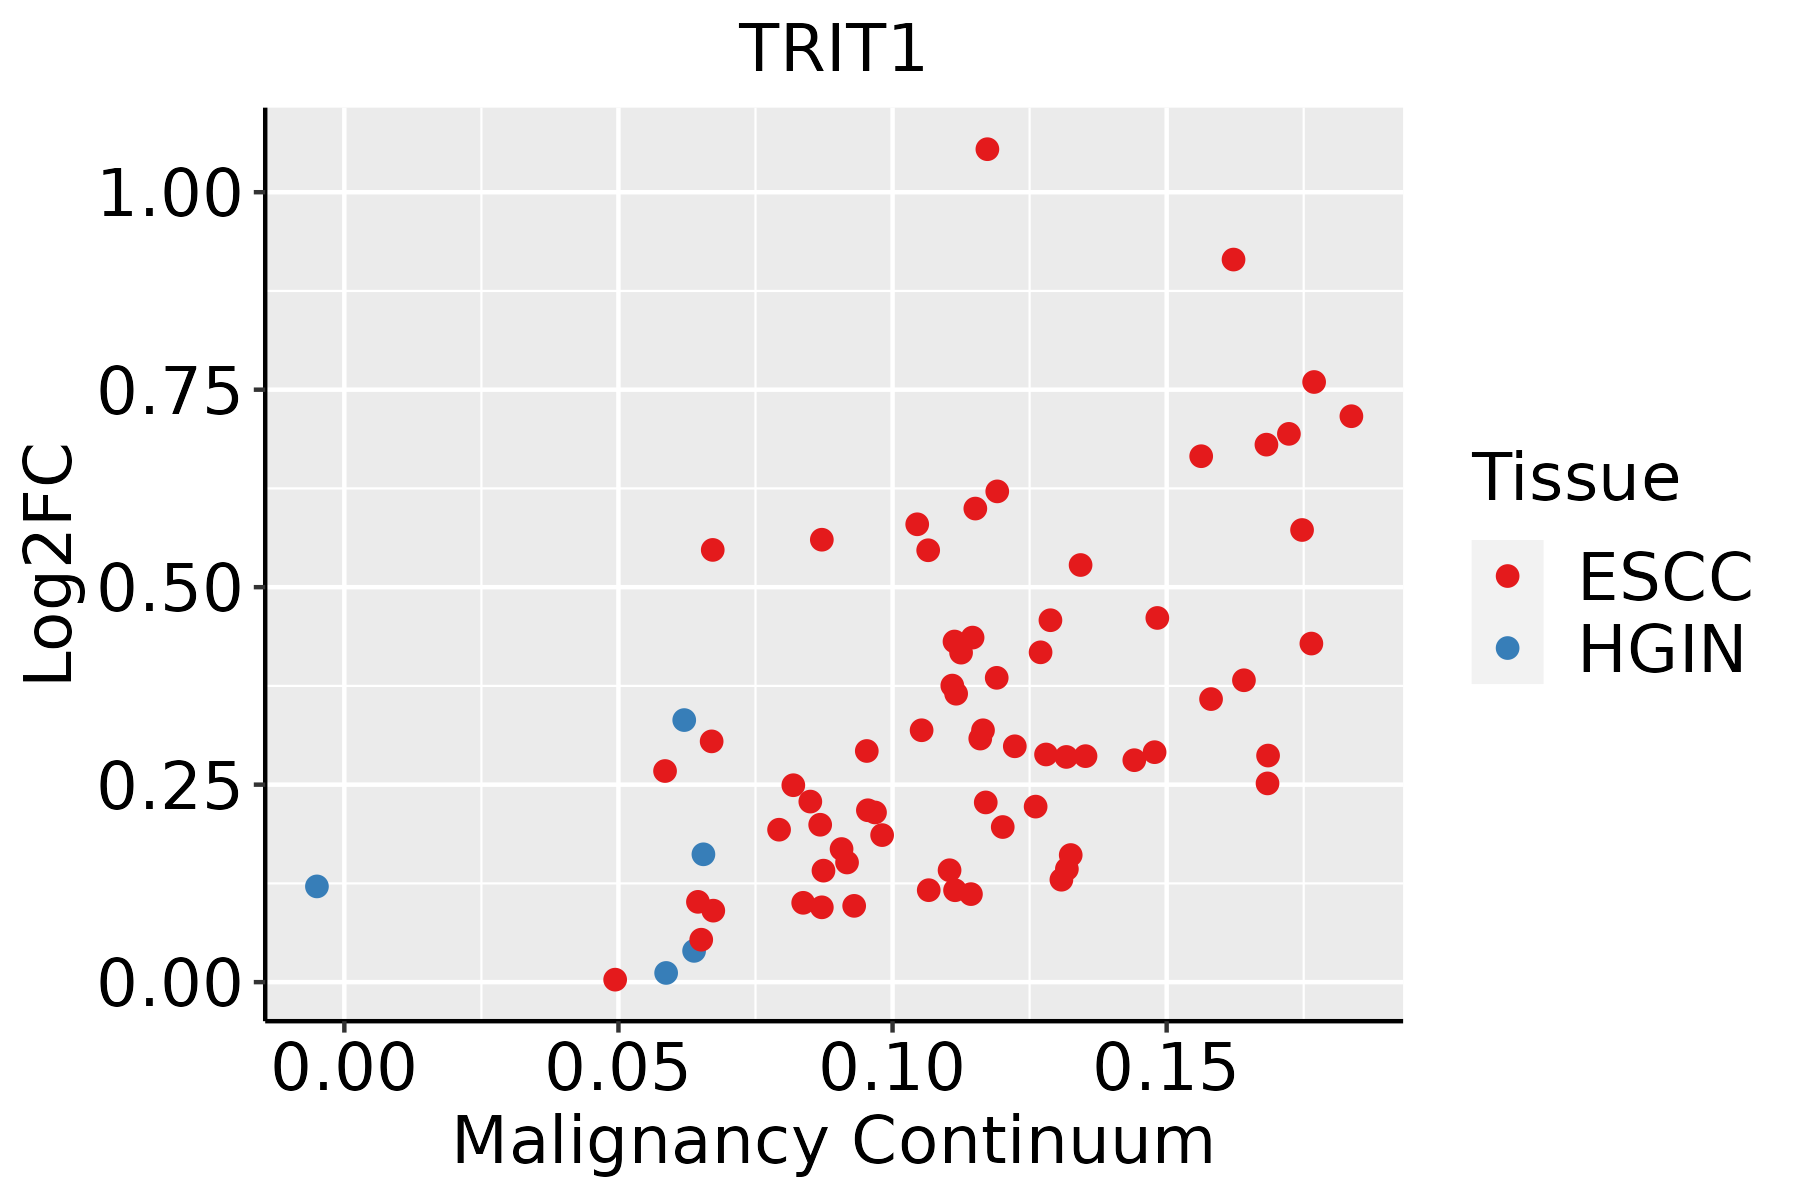 | ESCC: Esophageal squamous cell carcinoma |
| HGIN: High-grade intraepithelial neoplasias | ||
| LGIN: Low-grade intraepithelial neoplasias | ||
| Oral Cavity | 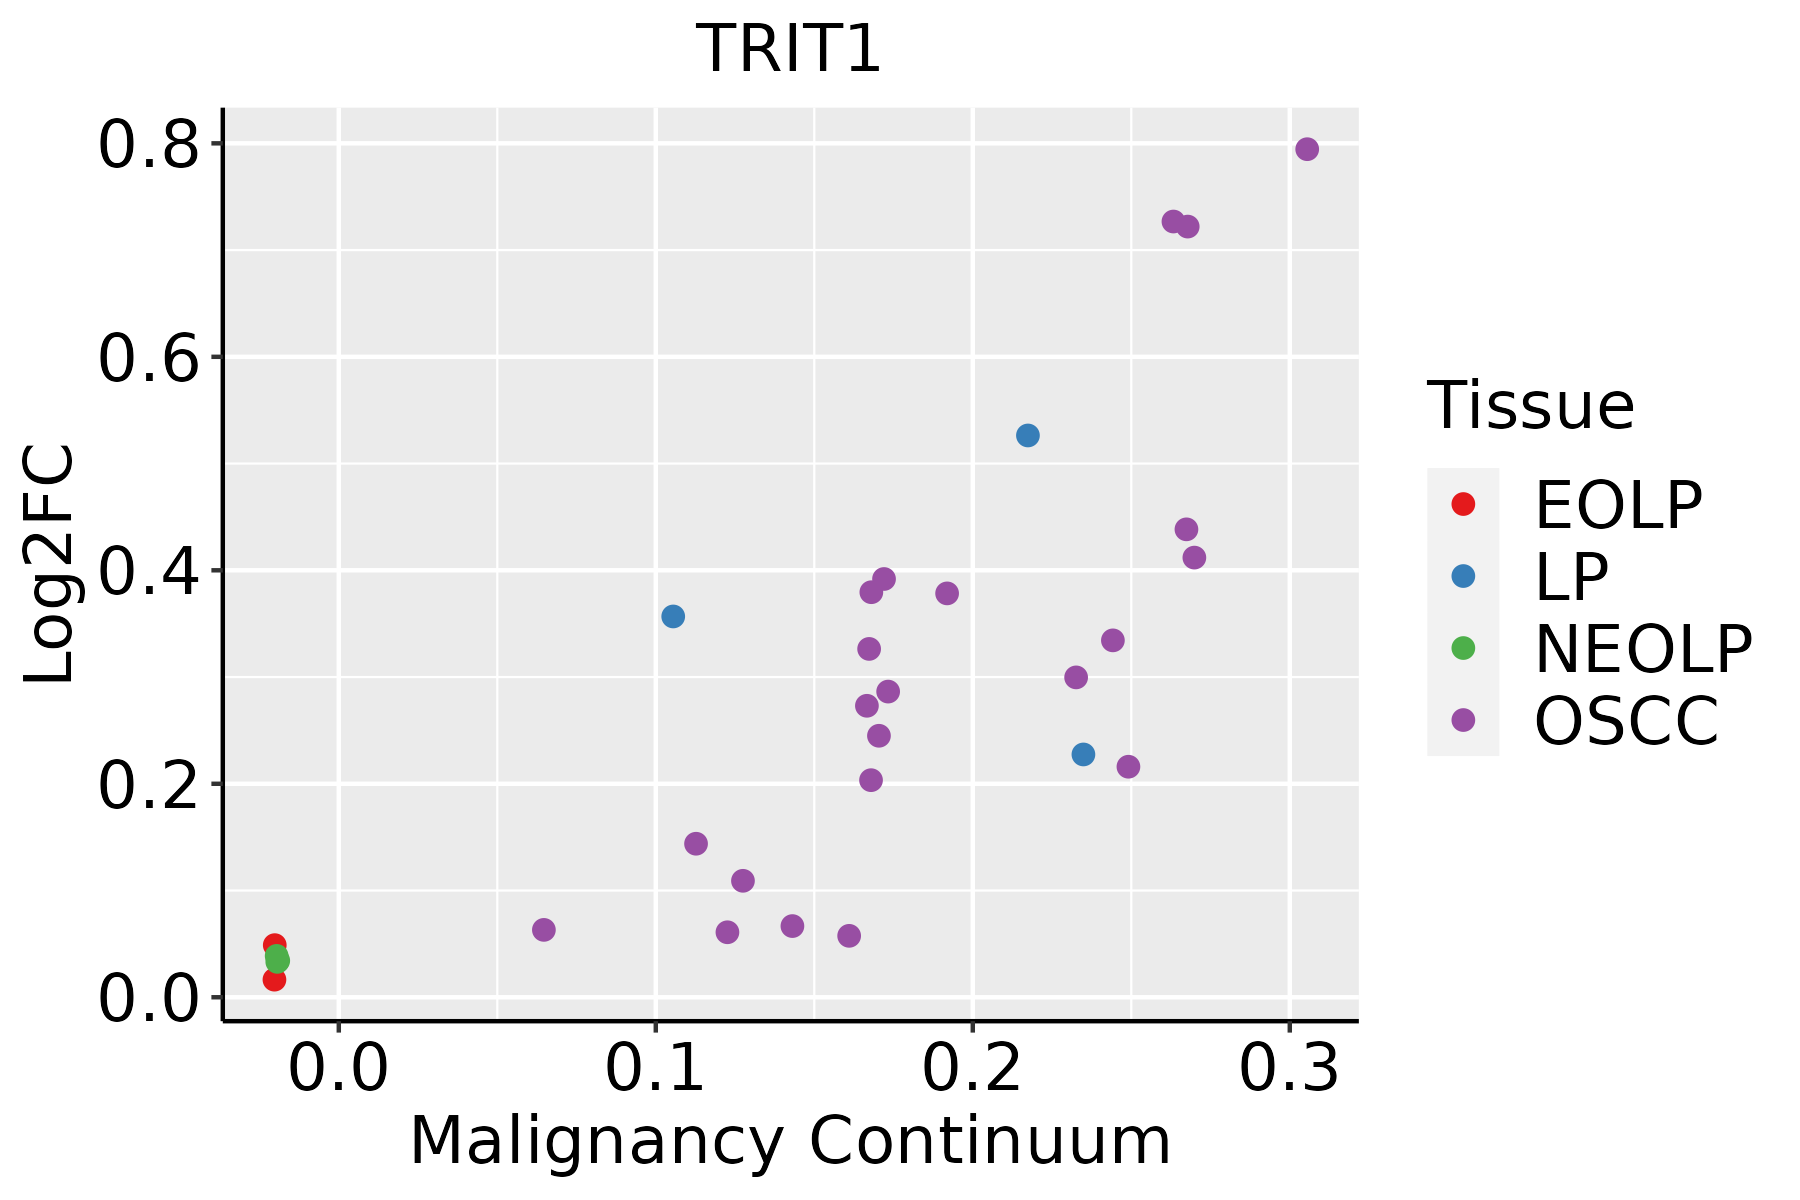 | EOLP: Erosive Oral lichen planus |
| LP: leukoplakia | ||
| NEOLP: Non-erosive oral lichen planus | ||
| OSCC: Oral squamous cell carcinoma |
| ∗log2FC in expression of this searched gene in stem-like cells from each diseased tissue sample relative to stem-like cells in normal samples in each tissue plotted against the malignancy continuum. Samples are colored based on if they are from different disease stage. |
Top |
Malignant transformation related pathway analysis |
| Find out the enriched GO biological processes and KEGG pathways involved in transition from healthy to precancer to cancer |
| Tissue | Disease Stage | Enriched GO biological Processes |
| Colorectum | AD |  |
| Colorectum | SER |  |
| Colorectum | MSS |  |
| Colorectum | MSI-H |  |
| Colorectum | FAP |  |
| ∗Top 15 enriched GO BP terms are showed in the bar plot of each disease state in each tissue. Each row represents a significant GO biological process which is colored according to the -log10(p.adjust). |
| Page: 1 2 3 4 5 6 7 8 9 |
| GO ID | Tissue | Disease Stage | Description | Gene Ratio | Bg Ratio | pvalue | p.adjust | Count |
| GO:003447015 | Esophagus | ESCC | ncRNA processing | 300/8552 | 395/18723 | 3.09e-35 | 3.26e-32 | 300 |
| GO:003466012 | Esophagus | ESCC | ncRNA metabolic process | 346/8552 | 485/18723 | 4.35e-31 | 2.51e-28 | 346 |
| GO:014005313 | Esophagus | ESCC | mitochondrial gene expression | 93/8552 | 108/18723 | 1.96e-18 | 2.03e-16 | 93 |
| GO:00080333 | Esophagus | ESCC | tRNA processing | 92/8552 | 127/18723 | 7.83e-10 | 1.93e-08 | 92 |
| GO:00063992 | Esophagus | ESCC | tRNA metabolic process | 122/8552 | 179/18723 | 9.03e-10 | 2.19e-08 | 122 |
| GO:00094512 | Esophagus | ESCC | RNA modification | 114/8552 | 167/18723 | 2.76e-09 | 6.04e-08 | 114 |
| GO:00009592 | Esophagus | ESCC | mitochondrial RNA metabolic process | 39/8552 | 49/18723 | 1.20e-06 | 1.49e-05 | 39 |
| GO:00009631 | Esophagus | ESCC | mitochondrial RNA processing | 19/8552 | 20/18723 | 3.83e-06 | 4.14e-05 | 19 |
| GO:00064002 | Esophagus | ESCC | tRNA modification | 62/8552 | 90/18723 | 7.02e-06 | 7.04e-05 | 62 |
| GO:0090646 | Esophagus | ESCC | mitochondrial tRNA processing | 11/8552 | 12/18723 | 1.26e-03 | 6.06e-03 | 11 |
| GO:00344709 | Oral cavity | OSCC | ncRNA processing | 263/7305 | 395/18723 | 4.38e-29 | 2.78e-26 | 263 |
| GO:00346605 | Oral cavity | OSCC | ncRNA metabolic process | 296/7305 | 485/18723 | 2.94e-23 | 6.65e-21 | 296 |
| GO:01400533 | Oral cavity | OSCC | mitochondrial gene expression | 78/7305 | 108/18723 | 2.37e-12 | 9.86e-11 | 78 |
| GO:00080332 | Oral cavity | OSCC | tRNA processing | 78/7305 | 127/18723 | 2.56e-07 | 4.00e-06 | 78 |
| GO:00063991 | Oral cavity | OSCC | tRNA metabolic process | 101/7305 | 179/18723 | 1.65e-06 | 2.15e-05 | 101 |
| GO:00094511 | Oral cavity | OSCC | RNA modification | 95/7305 | 167/18723 | 2.05e-06 | 2.62e-05 | 95 |
| GO:00064001 | Oral cavity | OSCC | tRNA modification | 53/7305 | 90/18723 | 1.04e-04 | 7.70e-04 | 53 |
| GO:00009591 | Oral cavity | OSCC | mitochondrial RNA metabolic process | 29/7305 | 49/18723 | 3.33e-03 | 1.42e-02 | 29 |
| GO:0000963 | Oral cavity | OSCC | mitochondrial RNA processing | 14/7305 | 20/18723 | 4.95e-03 | 1.94e-02 | 14 |
| Page: 1 |
| Pathway ID | Tissue | Disease Stage | Description | Gene Ratio | Bg Ratio | pvalue | p.adjust | qvalue | Count |
| Page: 1 |
Top |
Cell-cell communication analysis |
| Identification of potential cell-cell interactions between two cell types and their ligand-receptor pairs for different disease states |
| Ligand | Receptor | LRpair | Pathway | Tissue | Disease Stage |
| Page: 1 |
Top |
Single-cell gene regulatory network inference analysis |
| Find out the significant the regulons (TFs) and the target genes of each regulon across cell types for different disease states |
| TF | Cell Type | Tissue | Disease Stage | Target Gene | RSS | Regulon Activity |
| ∗The dot plots of a searched regulon are shown for all cell subpopulations in each disease state of each tissue based on the regulon specific score inferred using pySCENIC and by calculating the average expression. |
| Page: 1 |
Top |
Somatic mutation of malignant transformation related genes |
| Annotation of somatic variants for genes involved in malignant transformation |
| Hugo Symbol | Variant Class | Variant Classification | dbSNP RS | HGVSc | HGVSp | HGVSp Short | SWISSPROT | BIOTYPE | SIFT | PolyPhen | Tumor Sample Barcode | Tissue | Histology | Sex | Age | Stage | Therapy Types | Drugs | Outcome |
| TRIT1 | SNV | Missense_Mutation | c.706C>A | p.Leu236Ile | p.L236I | Q9H3H1 | protein_coding | deleterious(0.01) | probably_damaging(0.987) | TCGA-AN-A046-01 | Breast | breast invasive carcinoma | Female | >=65 | I/II | Unknown | Unknown | SD | |
| TRIT1 | SNV | Missense_Mutation | c.1272N>C | p.Lys424Asn | p.K424N | Q9H3H1 | protein_coding | deleterious(0.01) | benign(0.334) | TCGA-AN-A0FJ-01 | Breast | breast invasive carcinoma | Female | <65 | III/IV | Unknown | Unknown | SD | |
| TRIT1 | SNV | Missense_Mutation | rs768054657 | c.1381C>G | p.Gln461Glu | p.Q461E | Q9H3H1 | protein_coding | tolerated_low_confidence(0.66) | benign(0) | TCGA-E9-A1ND-01 | Breast | breast invasive carcinoma | Female | >=65 | I/II | Hormone Therapy | aromasin | SD |
| TRIT1 | insertion | Nonsense_Mutation | novel | c.427_428insATTTGAATATAAATACCTCCTTGTATTTTTAACCTCCTCTCTCTGTCCCTCCACCT | p.Gly143AspfsTer11 | p.G143Dfs*11 | Q9H3H1 | protein_coding | TCGA-BH-A1F6-01 | Breast | breast invasive carcinoma | Female | <65 | III/IV | Unknown | Unknown | SD | ||
| TRIT1 | SNV | Missense_Mutation | novel | c.881N>G | p.Thr294Ser | p.T294S | Q9H3H1 | protein_coding | tolerated(0.6) | benign(0.01) | TCGA-C5-A8XK-01 | Cervix | cervical & endocervical cancer | Female | <65 | I/II | Chemotherapy | cisplatin | SD |
| TRIT1 | SNV | Missense_Mutation | novel | c.337N>A | p.Asp113Asn | p.D113N | Q9H3H1 | protein_coding | tolerated(0.84) | benign(0.003) | TCGA-EA-A410-01 | Cervix | cervical & endocervical cancer | Female | <65 | I/II | Unknown | Unknown | SD |
| TRIT1 | SNV | Missense_Mutation | novel | c.1226N>T | p.Glu409Val | p.E409V | Q9H3H1 | protein_coding | deleterious(0) | probably_damaging(0.983) | TCGA-VS-A94Z-01 | Cervix | cervical & endocervical cancer | Female | <65 | I/II | Chemotherapy | cisplatin | CR |
| TRIT1 | SNV | Missense_Mutation | c.1078N>A | p.Leu360Ile | p.L360I | Q9H3H1 | protein_coding | deleterious(0.01) | benign(0.011) | TCGA-AA-3489-01 | Colorectum | colon adenocarcinoma | Male | >=65 | I/II | Unknown | Unknown | PD | |
| TRIT1 | SNV | Missense_Mutation | c.664N>C | p.Ser222Pro | p.S222P | Q9H3H1 | protein_coding | tolerated(1) | benign(0) | TCGA-AA-3715-01 | Colorectum | colon adenocarcinoma | Male | >=65 | I/II | Unknown | Unknown | PD | |
| TRIT1 | SNV | Missense_Mutation | c.706C>A | p.Leu236Ile | p.L236I | Q9H3H1 | protein_coding | deleterious(0.01) | probably_damaging(0.987) | TCGA-AA-3977-01 | Colorectum | colon adenocarcinoma | Male | >=65 | I/II | Unknown | Unknown | SD |
| Page: 1 2 3 4 5 |
Top |
Related drugs of malignant transformation related genes |
| Identification of chemicals and drugs interact with genes involved in malignant transfromation |
| (DGIdb 4.0) |
| Entrez ID | Symbol | Category | Interaction Types | Drug Claim Name | Drug Name | PMIDs |
| 54802 | TRIT1 | NA | 5-AZACYTIDINE | AZACITIDINE | 2479825 |
| Page: 1 |

Copyright 2023-Present -The University of Texas Health Science Center at Houston |