
|
|||||
|
 | |
| |
| |
| |
| |
| |
|
Gene: TRIQK |
Gene summary for TRIQK |
| Gene information | Species | Human | Gene symbol | TRIQK | Gene ID | 286144 |
| Gene name | triple QxxK/R motif containing | |
| Gene Alias | C8orf83 | |
| Cytomap | 8q22.1 | |
| Gene Type | protein-coding | GO ID | GO:0005575 | UniProtAcc | A0A024R9A0 |
Top |
Malignant transformation analysis |
| Identification of the aberrant gene expression in precancerous and cancerous lesions by comparing the gene expression of stem-like cells in diseased tissues with normal stem cells |
| Entrez ID | Symbol | Replicates | Species | Organ | Tissue | Adj P-value | Log2FC | Malignancy |
| 286144 | TRIQK | LZE20T | Human | Esophagus | ESCC | 7.45e-04 | 1.38e-01 | 0.0662 |
| 286144 | TRIQK | LZE22D1 | Human | Esophagus | HGIN | 9.80e-06 | 2.10e-01 | 0.0595 |
| 286144 | TRIQK | LZE22T | Human | Esophagus | ESCC | 3.86e-03 | 1.70e-01 | 0.068 |
| 286144 | TRIQK | LZE24T | Human | Esophagus | ESCC | 1.60e-29 | 8.54e-01 | 0.0596 |
| 286144 | TRIQK | P1T-E | Human | Esophagus | ESCC | 3.58e-03 | 2.84e-01 | 0.0875 |
| 286144 | TRIQK | P2T-E | Human | Esophagus | ESCC | 2.85e-15 | 2.17e-01 | 0.1177 |
| 286144 | TRIQK | P4T-E | Human | Esophagus | ESCC | 1.40e-11 | 3.39e-01 | 0.1323 |
| 286144 | TRIQK | P5T-E | Human | Esophagus | ESCC | 2.69e-19 | 1.83e-01 | 0.1327 |
| 286144 | TRIQK | P8T-E | Human | Esophagus | ESCC | 1.35e-18 | 3.47e-01 | 0.0889 |
| 286144 | TRIQK | P9T-E | Human | Esophagus | ESCC | 2.44e-08 | 1.65e-01 | 0.1131 |
| 286144 | TRIQK | P10T-E | Human | Esophagus | ESCC | 2.77e-24 | 4.42e-01 | 0.116 |
| 286144 | TRIQK | P11T-E | Human | Esophagus | ESCC | 4.68e-11 | 4.21e-01 | 0.1426 |
| 286144 | TRIQK | P12T-E | Human | Esophagus | ESCC | 2.06e-17 | 4.28e-01 | 0.1122 |
| 286144 | TRIQK | P15T-E | Human | Esophagus | ESCC | 3.01e-12 | 1.22e-01 | 0.1149 |
| 286144 | TRIQK | P16T-E | Human | Esophagus | ESCC | 4.73e-12 | 2.50e-01 | 0.1153 |
| 286144 | TRIQK | P17T-E | Human | Esophagus | ESCC | 5.45e-05 | 3.88e-01 | 0.1278 |
| 286144 | TRIQK | P19T-E | Human | Esophagus | ESCC | 1.13e-06 | 4.10e-01 | 0.1662 |
| 286144 | TRIQK | P20T-E | Human | Esophagus | ESCC | 1.24e-21 | 5.63e-01 | 0.1124 |
| 286144 | TRIQK | P21T-E | Human | Esophagus | ESCC | 9.14e-18 | 3.34e-01 | 0.1617 |
| 286144 | TRIQK | P22T-E | Human | Esophagus | ESCC | 5.28e-10 | 1.60e-01 | 0.1236 |
| Page: 1 2 3 4 5 |
| Tissue | Expression Dynamics | Abbreviation |
| Esophagus | 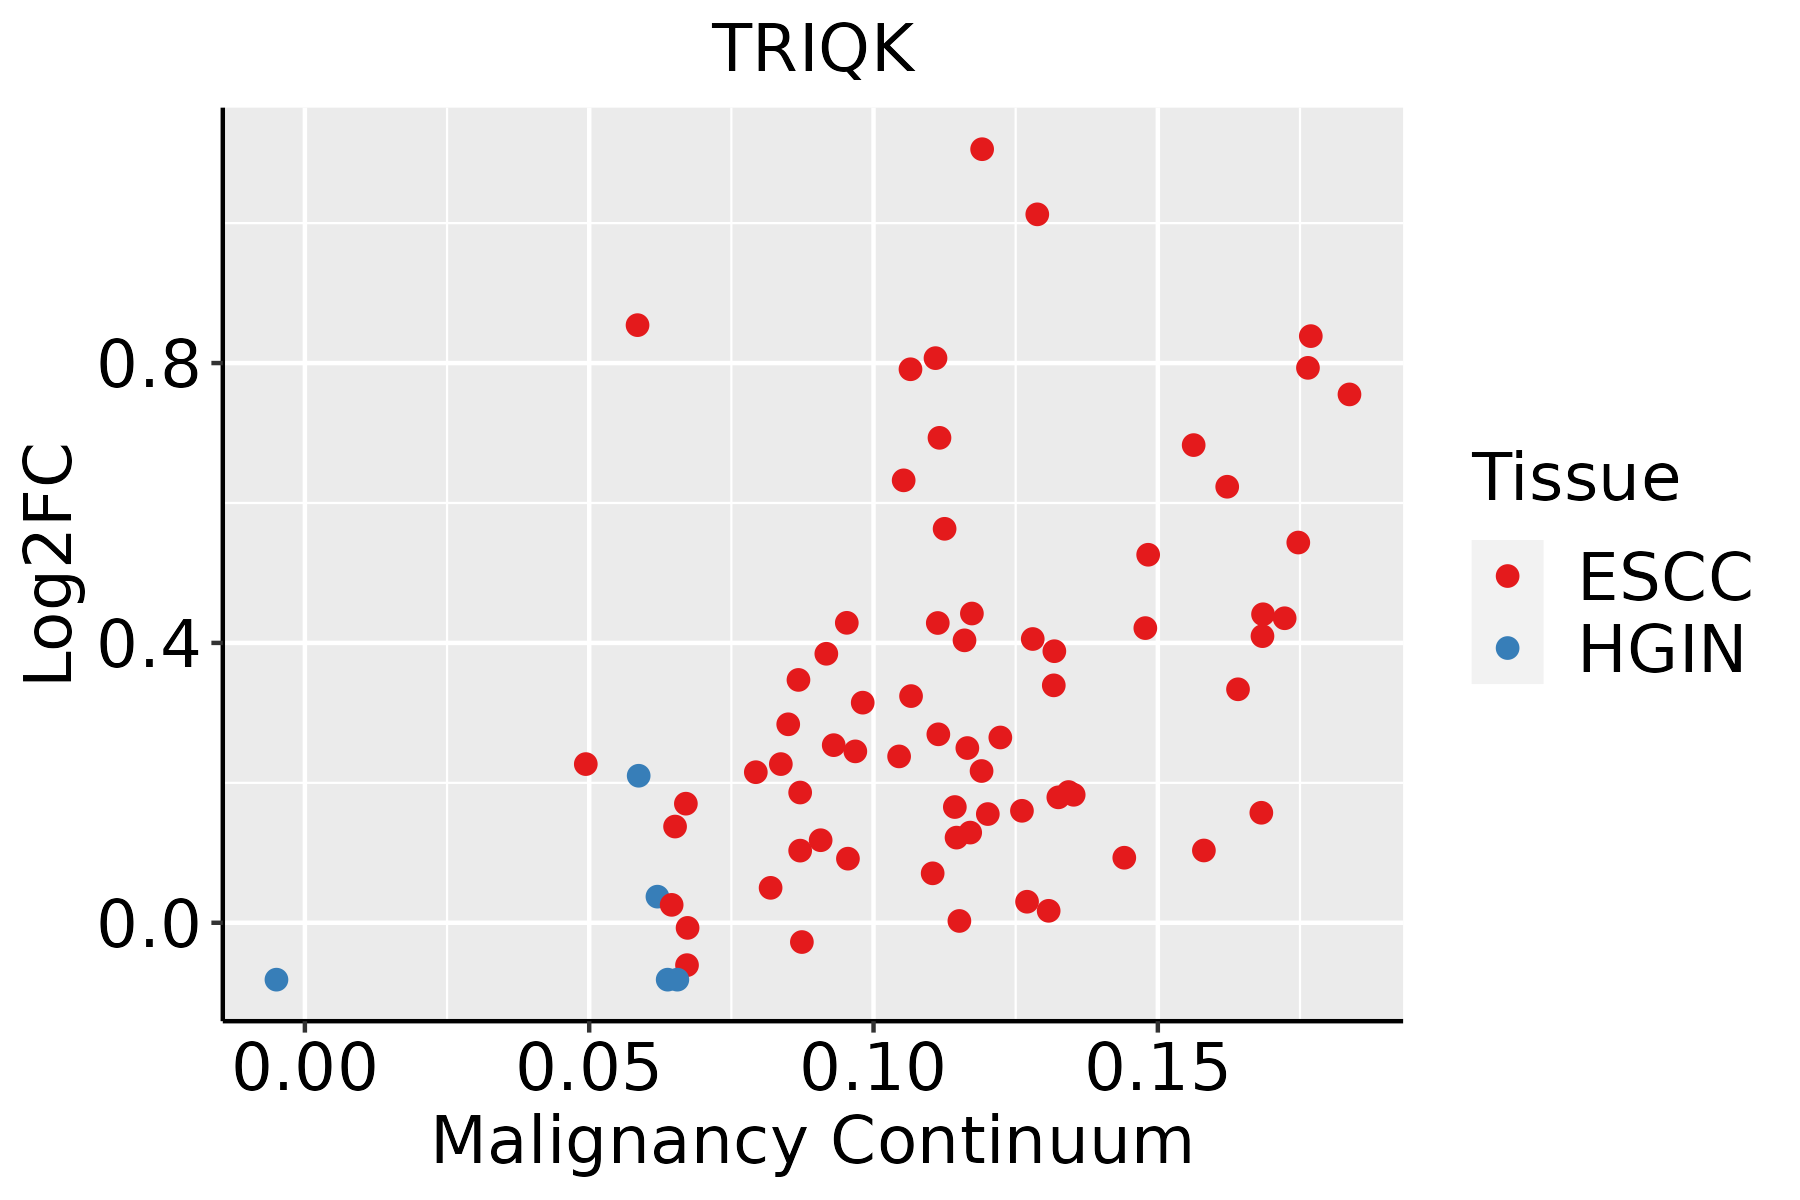 | ESCC: Esophageal squamous cell carcinoma |
| HGIN: High-grade intraepithelial neoplasias | ||
| LGIN: Low-grade intraepithelial neoplasias | ||
| Liver | 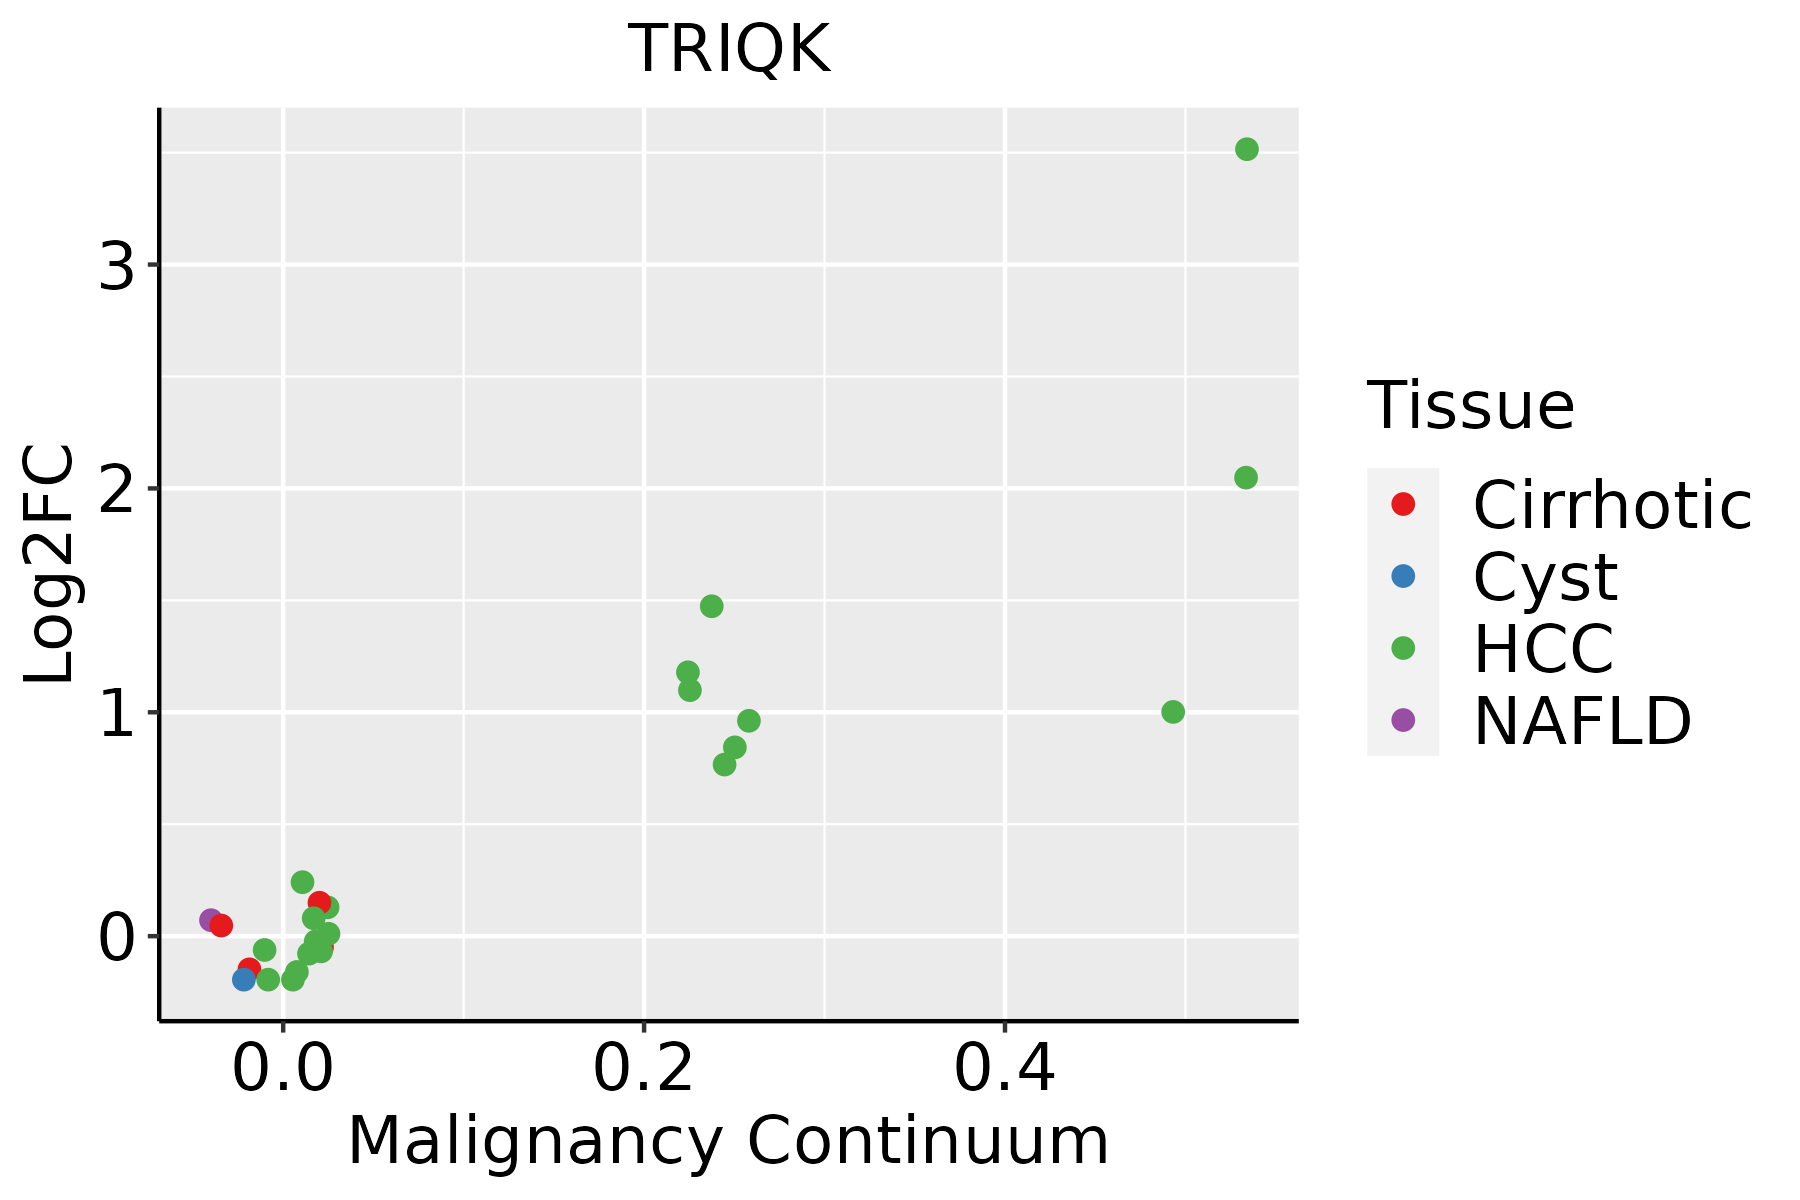 | HCC: Hepatocellular carcinoma |
| NAFLD: Non-alcoholic fatty liver disease | ||
| Oral Cavity | 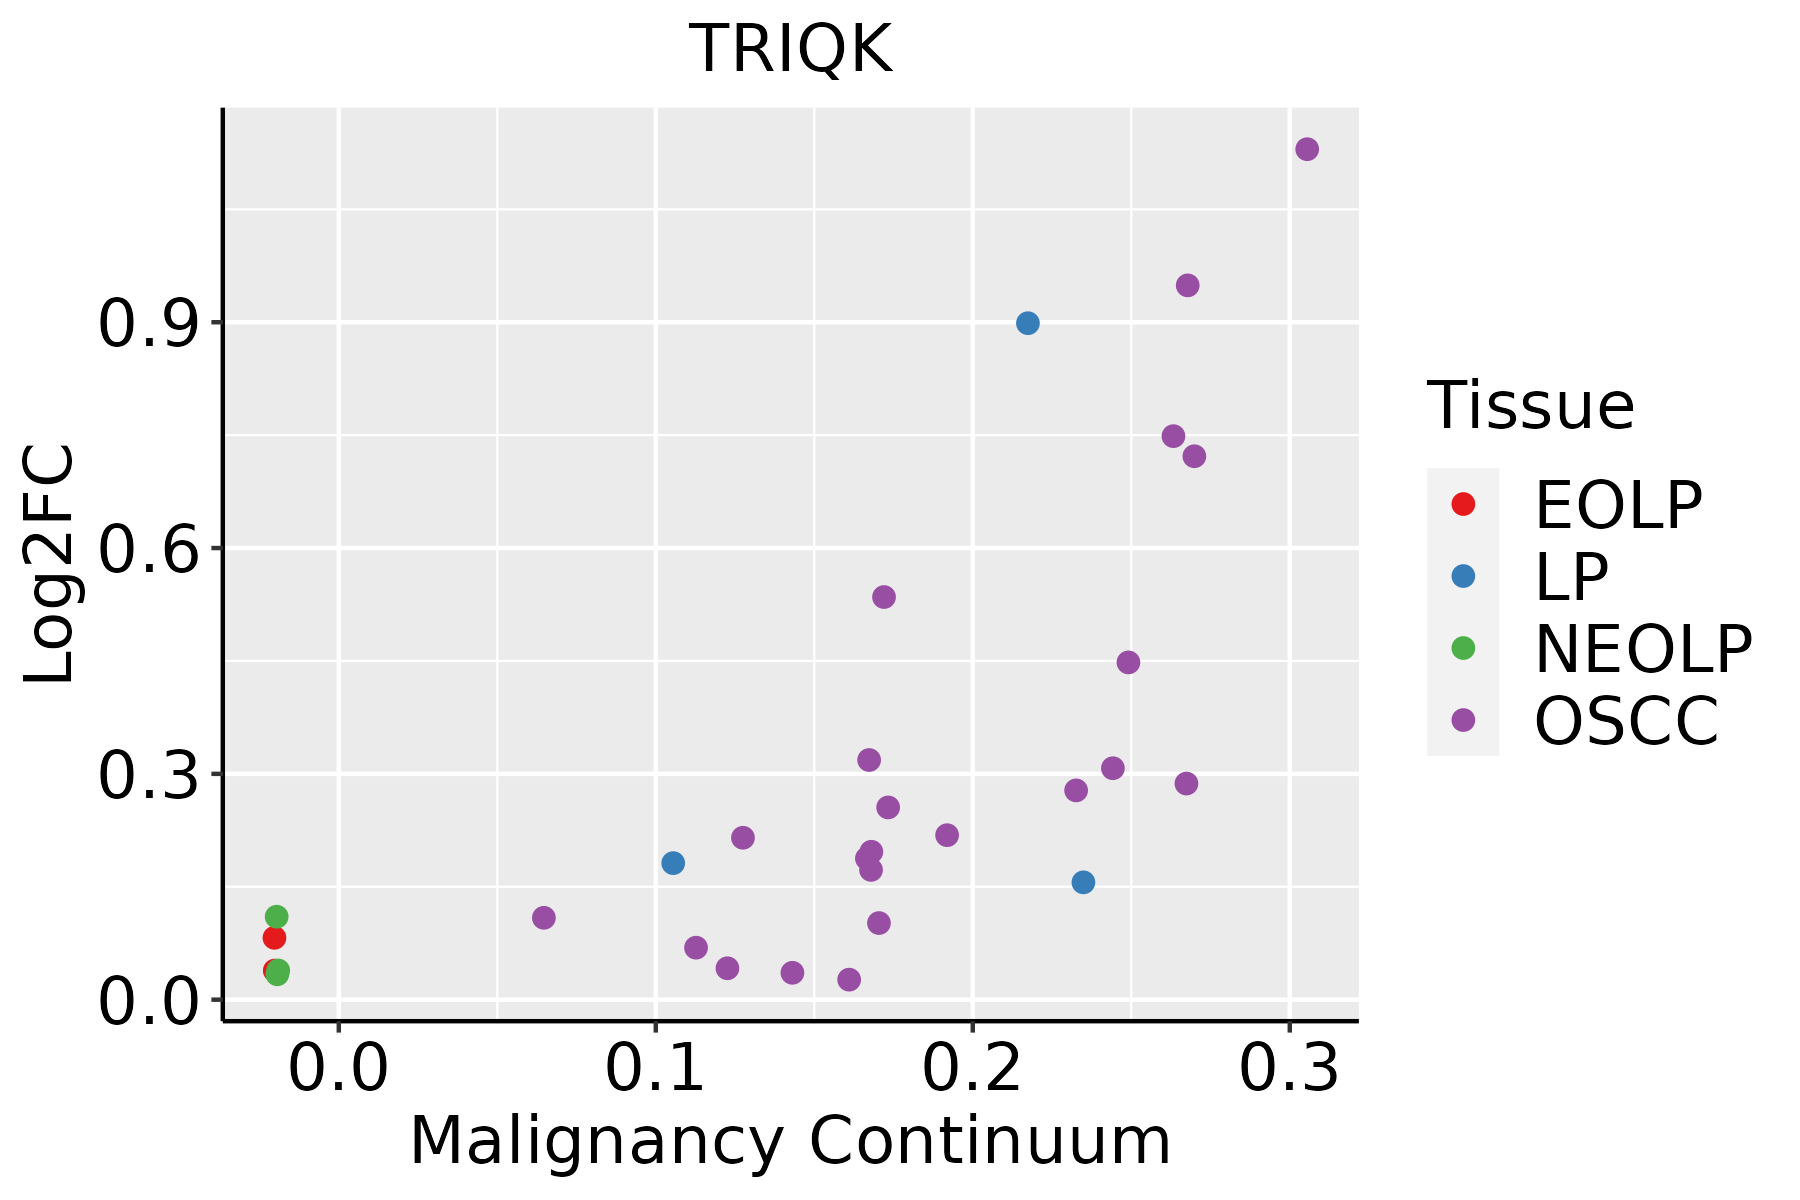 | EOLP: Erosive Oral lichen planus |
| LP: leukoplakia | ||
| NEOLP: Non-erosive oral lichen planus | ||
| OSCC: Oral squamous cell carcinoma |
| ∗log2FC in expression of this searched gene in stem-like cells from each diseased tissue sample relative to stem-like cells in normal samples in each tissue plotted against the malignancy continuum. Samples are colored based on if they are from different disease stage. |
Top |
Malignant transformation related pathway analysis |
| Find out the enriched GO biological processes and KEGG pathways involved in transition from healthy to precancer to cancer |
| Tissue | Disease Stage | Enriched GO biological Processes |
| Colorectum | AD |  |
| Colorectum | SER |  |
| Colorectum | MSS |  |
| Colorectum | MSI-H |  |
| Colorectum | FAP |  |
| ∗Top 15 enriched GO BP terms are showed in the bar plot of each disease state in each tissue. Each row represents a significant GO biological process which is colored according to the -log10(p.adjust). |
| Page: 1 2 3 4 5 6 7 8 9 |
| GO ID | Tissue | Disease Stage | Description | Gene Ratio | Bg Ratio | pvalue | p.adjust | Count |
| Page: 1 |
| Pathway ID | Tissue | Disease Stage | Description | Gene Ratio | Bg Ratio | pvalue | p.adjust | qvalue | Count |
| Page: 1 |
Top |
Cell-cell communication analysis |
| Identification of potential cell-cell interactions between two cell types and their ligand-receptor pairs for different disease states |
| Ligand | Receptor | LRpair | Pathway | Tissue | Disease Stage |
| Page: 1 |
Top |
Single-cell gene regulatory network inference analysis |
| Find out the significant the regulons (TFs) and the target genes of each regulon across cell types for different disease states |
| TF | Cell Type | Tissue | Disease Stage | Target Gene | RSS | Regulon Activity |
| ∗The dot plots of a searched regulon are shown for all cell subpopulations in each disease state of each tissue based on the regulon specific score inferred using pySCENIC and by calculating the average expression. |
| Page: 1 |
Top |
Somatic mutation of malignant transformation related genes |
| Annotation of somatic variants for genes involved in malignant transformation |
| Hugo Symbol | Variant Class | Variant Classification | dbSNP RS | HGVSc | HGVSp | HGVSp Short | SWISSPROT | BIOTYPE | SIFT | PolyPhen | Tumor Sample Barcode | Tissue | Histology | Sex | Age | Stage | Therapy Types | Drugs | Outcome |
| TRIQK | SNV | Missense_Mutation | rs758550065 | c.5N>A | p.Gly2Asp | p.G2D | Q629K1 | protein_coding | deleterious(0) | probably_damaging(0.999) | TCGA-A2-A0CM-01 | Breast | breast invasive carcinoma | Female | <65 | I/II | Chemotherapy | adriamycin | PD |
| TRIQK | SNV | Missense_Mutation | novel | c.126N>T | p.Lys42Asn | p.K42N | Q629K1 | protein_coding | deleterious(0.01) | benign(0.31) | TCGA-AJ-A3EK-01 | Endometrium | uterine corpus endometrioid carcinoma | Female | <65 | I/II | Chemotherapy | carboplatin | CR |
| TRIQK | SNV | Missense_Mutation | c.155N>C | p.Gly52Ala | p.G52A | Q629K1 | protein_coding | tolerated(0.51) | benign(0.011) | TCGA-AP-A0LF-01 | Endometrium | uterine corpus endometrioid carcinoma | Female | >=65 | III/IV | Unknown | Unknown | SD | |
| TRIQK | SNV | Missense_Mutation | novel | c.126N>T | p.Lys42Asn | p.K42N | Q629K1 | protein_coding | deleterious(0.01) | benign(0.31) | TCGA-AP-A1E0-01 | Endometrium | uterine corpus endometrioid carcinoma | Female | <65 | III/IV | Chemotherapy | paclitaxel | SD |
| TRIQK | SNV | Missense_Mutation | c.98N>C | p.Arg33Pro | p.R33P | Q629K1 | protein_coding | deleterious(0.01) | possibly_damaging(0.774) | TCGA-B5-A0JX-01 | Endometrium | uterine corpus endometrioid carcinoma | Female | <65 | I/II | Unknown | Unknown | SD | |
| TRIQK | SNV | Missense_Mutation | c.98N>C | p.Arg33Pro | p.R33P | Q629K1 | protein_coding | deleterious(0.01) | possibly_damaging(0.774) | TCGA-BG-A18A-01 | Endometrium | uterine corpus endometrioid carcinoma | Female | >=65 | I/II | Unknown | Unknown | SD | |
| TRIQK | SNV | Missense_Mutation | novel | c.28N>C | p.Lys10Gln | p.K10Q | Q629K1 | protein_coding | tolerated(0.33) | benign(0.261) | TCGA-D1-A2G5-01 | Endometrium | uterine corpus endometrioid carcinoma | Female | <65 | I/II | Unknown | Unknown | PD |
| TRIQK | insertion | Frame_Shift_Ins | novel | c.79_80insTGAGATTTATTGAA | p.Lys27MetfsTer16 | p.K27Mfs*16 | Q629K1 | protein_coding | TCGA-A5-A0R7-01 | Endometrium | uterine corpus endometrioid carcinoma | Female | <65 | I/II | Unknown | Unknown | SD | ||
| TRIQK | insertion | In_Frame_Ins | novel | c.75_76insGTC | p.Tyr25_Lys26insVal | p.Y25_K26insV | Q629K1 | protein_coding | TCGA-AP-A0LM-01 | Endometrium | uterine corpus endometrioid carcinoma | Female | <65 | III/IV | Chemotherapy | cisplatin | SD | ||
| TRIQK | insertion | Frame_Shift_Ins | novel | c.82dupA | p.Thr28AsnfsTer2 | p.T28Nfs*2 | Q629K1 | protein_coding | TCGA-B5-A3FC-01 | Endometrium | uterine corpus endometrioid carcinoma | Female | <65 | I/II | Unknown | Unknown | SD |
| Page: 1 2 |
Top |
Related drugs of malignant transformation related genes |
| Identification of chemicals and drugs interact with genes involved in malignant transfromation |
| (DGIdb 4.0) |
| Entrez ID | Symbol | Category | Interaction Types | Drug Claim Name | Drug Name | PMIDs |
| Page: 1 |

Copyright 2023-Present -The University of Texas Health Science Center at Houston |