
|
|||||
|
 | |
| |
| |
| |
| |
| |
|
Gene: TRIP4 |
Gene summary for TRIP4 |
| Gene information | Species | Human | Gene symbol | TRIP4 | Gene ID | 9325 |
| Gene name | thyroid hormone receptor interactor 4 | |
| Gene Alias | ASC-1 | |
| Cytomap | 15q22.31 | |
| Gene Type | protein-coding | GO ID | GO:0006139 | UniProtAcc | Q15650 |
Top |
Malignant transformation analysis |
| Identification of the aberrant gene expression in precancerous and cancerous lesions by comparing the gene expression of stem-like cells in diseased tissues with normal stem cells |
| Entrez ID | Symbol | Replicates | Species | Organ | Tissue | Adj P-value | Log2FC | Malignancy |
| 9325 | TRIP4 | LZE4T | Human | Esophagus | ESCC | 1.35e-04 | 1.48e-01 | 0.0811 |
| 9325 | TRIP4 | LZE7T | Human | Esophagus | ESCC | 8.02e-06 | 2.83e-01 | 0.0667 |
| 9325 | TRIP4 | LZE24T | Human | Esophagus | ESCC | 8.88e-07 | 2.11e-01 | 0.0596 |
| 9325 | TRIP4 | P1T-E | Human | Esophagus | ESCC | 2.94e-02 | 1.88e-01 | 0.0875 |
| 9325 | TRIP4 | P2T-E | Human | Esophagus | ESCC | 2.97e-08 | 1.92e-01 | 0.1177 |
| 9325 | TRIP4 | P4T-E | Human | Esophagus | ESCC | 1.49e-10 | 2.45e-01 | 0.1323 |
| 9325 | TRIP4 | P5T-E | Human | Esophagus | ESCC | 2.27e-08 | 1.90e-01 | 0.1327 |
| 9325 | TRIP4 | P8T-E | Human | Esophagus | ESCC | 2.29e-14 | 2.94e-01 | 0.0889 |
| 9325 | TRIP4 | P9T-E | Human | Esophagus | ESCC | 4.35e-05 | 1.48e-01 | 0.1131 |
| 9325 | TRIP4 | P10T-E | Human | Esophagus | ESCC | 8.83e-14 | 1.91e-01 | 0.116 |
| 9325 | TRIP4 | P11T-E | Human | Esophagus | ESCC | 1.50e-09 | 4.43e-01 | 0.1426 |
| 9325 | TRIP4 | P12T-E | Human | Esophagus | ESCC | 1.43e-08 | 2.78e-01 | 0.1122 |
| 9325 | TRIP4 | P15T-E | Human | Esophagus | ESCC | 1.05e-16 | 3.16e-01 | 0.1149 |
| 9325 | TRIP4 | P16T-E | Human | Esophagus | ESCC | 9.71e-15 | 2.30e-01 | 0.1153 |
| 9325 | TRIP4 | P19T-E | Human | Esophagus | ESCC | 2.24e-04 | 3.41e-01 | 0.1662 |
| 9325 | TRIP4 | P20T-E | Human | Esophagus | ESCC | 5.42e-12 | 1.98e-01 | 0.1124 |
| 9325 | TRIP4 | P21T-E | Human | Esophagus | ESCC | 3.95e-16 | 2.33e-01 | 0.1617 |
| 9325 | TRIP4 | P22T-E | Human | Esophagus | ESCC | 2.46e-05 | 1.14e-01 | 0.1236 |
| 9325 | TRIP4 | P23T-E | Human | Esophagus | ESCC | 5.39e-19 | 4.33e-01 | 0.108 |
| 9325 | TRIP4 | P24T-E | Human | Esophagus | ESCC | 7.98e-08 | 2.32e-01 | 0.1287 |
| Page: 1 2 3 4 |
| Tissue | Expression Dynamics | Abbreviation |
| Esophagus |  | ESCC: Esophageal squamous cell carcinoma |
| HGIN: High-grade intraepithelial neoplasias | ||
| LGIN: Low-grade intraepithelial neoplasias | ||
| Oral Cavity |  | EOLP: Erosive Oral lichen planus |
| LP: leukoplakia | ||
| NEOLP: Non-erosive oral lichen planus | ||
| OSCC: Oral squamous cell carcinoma | ||
| Skin | 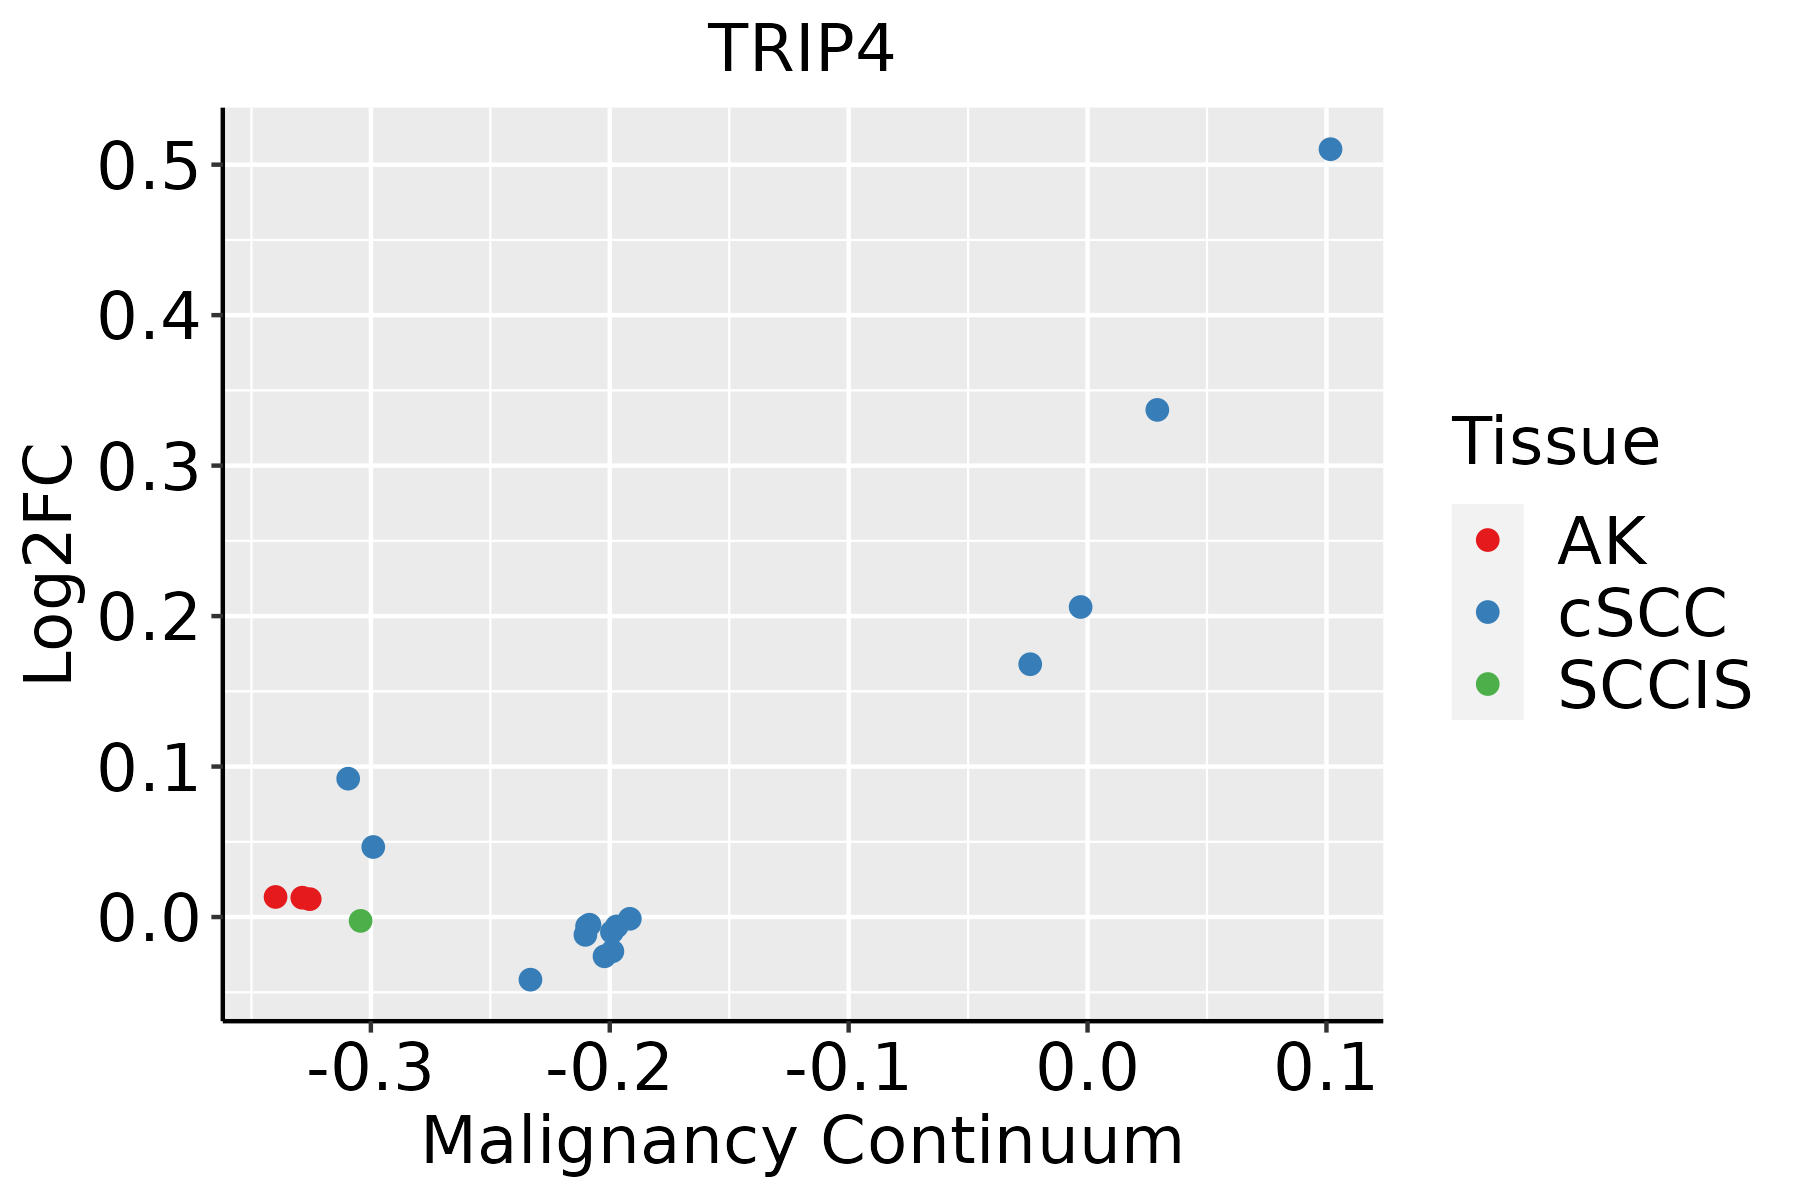 | AK: Actinic keratosis |
| cSCC: Cutaneous squamous cell carcinoma | ||
| SCCIS:squamous cell carcinoma in situ |
| ∗log2FC in expression of this searched gene in stem-like cells from each diseased tissue sample relative to stem-like cells in normal samples in each tissue plotted against the malignancy continuum. Samples are colored based on if they are from different disease stage. |
Top |
Malignant transformation related pathway analysis |
| Find out the enriched GO biological processes and KEGG pathways involved in transition from healthy to precancer to cancer |
| Tissue | Disease Stage | Enriched GO biological Processes |
| Colorectum | AD |  |
| Colorectum | SER |  |
| Colorectum | MSS |  |
| Colorectum | MSI-H |  |
| Colorectum | FAP |  |
| ∗Top 15 enriched GO BP terms are showed in the bar plot of each disease state in each tissue. Each row represents a significant GO biological process which is colored according to the -log10(p.adjust). |
| Page: 1 2 3 4 5 6 7 8 9 |
| GO ID | Tissue | Disease Stage | Description | Gene Ratio | Bg Ratio | pvalue | p.adjust | Count |
| GO:0010498111 | Esophagus | ESCC | proteasomal protein catabolic process | 369/8552 | 490/18723 | 1.13e-41 | 1.80e-38 | 369 |
| GO:0043161111 | Esophagus | ESCC | proteasome-mediated ubiquitin-dependent protein catabolic process | 312/8552 | 412/18723 | 3.53e-36 | 4.48e-33 | 312 |
| GO:0006417111 | Esophagus | ESCC | regulation of translation | 304/8552 | 468/18723 | 1.53e-17 | 1.33e-15 | 304 |
| GO:0030522110 | Esophagus | ESCC | intracellular receptor signaling pathway | 170/8552 | 265/18723 | 8.58e-10 | 2.09e-08 | 170 |
| GO:0048545111 | Esophagus | ESCC | response to steroid hormone | 204/8552 | 339/18723 | 4.47e-08 | 8.11e-07 | 204 |
| GO:0071383110 | Esophagus | ESCC | cellular response to steroid hormone stimulus | 127/8552 | 204/18723 | 1.26e-06 | 1.55e-05 | 127 |
| GO:003051819 | Esophagus | ESCC | intracellular steroid hormone receptor signaling pathway | 76/8552 | 116/18723 | 1.25e-05 | 1.15e-04 | 76 |
| GO:004340119 | Esophagus | ESCC | steroid hormone mediated signaling pathway | 87/8552 | 136/18723 | 1.25e-05 | 1.15e-04 | 87 |
| GO:000641419 | Esophagus | ESCC | translational elongation | 41/8552 | 55/18723 | 1.26e-05 | 1.16e-04 | 41 |
| GO:19019987 | Esophagus | ESCC | toxin transport | 28/8552 | 40/18723 | 1.61e-03 | 7.50e-03 | 28 |
| GO:00454454 | Esophagus | ESCC | myoblast differentiation | 52/8552 | 84/18723 | 1.98e-03 | 8.90e-03 | 52 |
| GO:000975516 | Esophagus | ESCC | hormone-mediated signaling pathway | 106/8552 | 190/18723 | 3.13e-03 | 1.30e-02 | 106 |
| GO:003052014 | Esophagus | ESCC | intracellular estrogen receptor signaling pathway | 35/8552 | 54/18723 | 3.55e-03 | 1.45e-02 | 35 |
| GO:001049820 | Oral cavity | OSCC | proteasomal protein catabolic process | 336/7305 | 490/18723 | 5.45e-41 | 8.63e-38 | 336 |
| GO:004316120 | Oral cavity | OSCC | proteasome-mediated ubiquitin-dependent protein catabolic process | 285/7305 | 412/18723 | 5.68e-36 | 5.99e-33 | 285 |
| GO:000641720 | Oral cavity | OSCC | regulation of translation | 274/7305 | 468/18723 | 4.39e-18 | 4.63e-16 | 274 |
| GO:004854520 | Oral cavity | OSCC | response to steroid hormone | 186/7305 | 339/18723 | 1.86e-09 | 4.42e-08 | 186 |
| GO:003052218 | Oral cavity | OSCC | intracellular receptor signaling pathway | 149/7305 | 265/18723 | 8.69e-09 | 1.81e-07 | 149 |
| GO:007138318 | Oral cavity | OSCC | cellular response to steroid hormone stimulus | 112/7305 | 204/18723 | 2.82e-06 | 3.47e-05 | 112 |
| GO:000641416 | Oral cavity | OSCC | translational elongation | 37/7305 | 55/18723 | 2.03e-05 | 1.94e-04 | 37 |
| Page: 1 2 3 |
| Pathway ID | Tissue | Disease Stage | Description | Gene Ratio | Bg Ratio | pvalue | p.adjust | qvalue | Count |
| Page: 1 |
Top |
Cell-cell communication analysis |
| Identification of potential cell-cell interactions between two cell types and their ligand-receptor pairs for different disease states |
| Ligand | Receptor | LRpair | Pathway | Tissue | Disease Stage |
| Page: 1 |
Top |
Single-cell gene regulatory network inference analysis |
| Find out the significant the regulons (TFs) and the target genes of each regulon across cell types for different disease states |
| TF | Cell Type | Tissue | Disease Stage | Target Gene | RSS | Regulon Activity |
| ∗The dot plots of a searched regulon are shown for all cell subpopulations in each disease state of each tissue based on the regulon specific score inferred using pySCENIC and by calculating the average expression. |
| Page: 1 |
Top |
Somatic mutation of malignant transformation related genes |
| Annotation of somatic variants for genes involved in malignant transformation |
| Hugo Symbol | Variant Class | Variant Classification | dbSNP RS | HGVSc | HGVSp | HGVSp Short | SWISSPROT | BIOTYPE | SIFT | PolyPhen | Tumor Sample Barcode | Tissue | Histology | Sex | Age | Stage | Therapy Types | Drugs | Outcome |
| TRIP4 | SNV | Missense_Mutation | c.1501N>A | p.Asp501Asn | p.D501N | Q15650 | protein_coding | deleterious(0.01) | possibly_damaging(0.899) | TCGA-A2-A0YG-01 | Breast | breast invasive carcinoma | Female | <65 | III/IV | Chemotherapy | cytoxan | SD | |
| TRIP4 | SNV | Missense_Mutation | novel | c.1584C>G | p.Asp528Glu | p.D528E | Q15650 | protein_coding | tolerated(0.26) | benign(0.07) | TCGA-B6-A0RS-01 | Breast | breast invasive carcinoma | Female | <65 | I/II | Unknown | Unknown | PD |
| TRIP4 | SNV | Missense_Mutation | c.289A>G | p.Lys97Glu | p.K97E | Q15650 | protein_coding | tolerated(0.48) | benign(0.013) | TCGA-BH-A18V-01 | Breast | breast invasive carcinoma | Female | <65 | I/II | Unknown | Unknown | SD | |
| TRIP4 | insertion | Frame_Shift_Ins | novel | c.1531_1532insATGAGTTT | p.Val511AspfsTer6 | p.V511Dfs*6 | Q15650 | protein_coding | TCGA-AR-A0U0-01 | Breast | breast invasive carcinoma | Female | >=65 | I/II | Unknown | Unknown | SD | ||
| TRIP4 | SNV | Missense_Mutation | novel | c.302N>C | p.His101Pro | p.H101P | Q15650 | protein_coding | tolerated(0.2) | benign(0.003) | TCGA-VS-A8EC-01 | Cervix | cervical & endocervical cancer | Female | <65 | III/IV | Chemotherapy | carboplatin | CR |
| TRIP4 | SNV | Missense_Mutation | c.7G>A | p.Val3Met | p.V3M | Q15650 | protein_coding | deleterious_low_confidence(0.03) | benign(0.01) | TCGA-AA-3815-01 | Colorectum | colon adenocarcinoma | Female | >=65 | I/II | Unknown | Unknown | SD | |
| TRIP4 | SNV | Missense_Mutation | rs143968963 | c.761G>A | p.Arg254Gln | p.R254Q | Q15650 | protein_coding | tolerated(0.09) | benign(0.246) | TCGA-AA-3864-01 | Colorectum | colon adenocarcinoma | Male | >=65 | I/II | Unknown | Unknown | SD |
| TRIP4 | SNV | Missense_Mutation | c.195N>C | p.Glu65Asp | p.E65D | Q15650 | protein_coding | tolerated(0.45) | benign(0.026) | TCGA-AA-A00N-01 | Colorectum | colon adenocarcinoma | Male | >=65 | I/II | Unknown | Unknown | PD | |
| TRIP4 | SNV | Missense_Mutation | rs777959222 | c.653G>A | p.Arg218His | p.R218H | Q15650 | protein_coding | deleterious(0) | probably_damaging(0.939) | TCGA-AA-A010-01 | Colorectum | colon adenocarcinoma | Female | <65 | I/II | Chemotherapy | folinic | CR |
| TRIP4 | SNV | Missense_Mutation | rs144113386 | c.427N>A | p.Val143Ile | p.V143I | Q15650 | protein_coding | tolerated(0.44) | benign(0.022) | TCGA-AA-A01P-01 | Colorectum | colon adenocarcinoma | Female | >=65 | III/IV | Unknown | Unknown | PD |
| Page: 1 2 3 4 5 |
Top |
Related drugs of malignant transformation related genes |
| Identification of chemicals and drugs interact with genes involved in malignant transfromation |
| (DGIdb 4.0) |
| Entrez ID | Symbol | Category | Interaction Types | Drug Claim Name | Drug Name | PMIDs |
| Page: 1 |

Copyright 2023-Present -The University of Texas Health Science Center at Houston |